BDC Filing Season: Q1 2023 Week 3
BDC Filing Season Q1 2023 Week 3
BDC data provided by the Advantage Data Workstation, a SOLVE product. For more information about our BDC data or our other products please contact marketpluse@solvefixedincome.com.
Filing Recap
This report will analyze the 33 BDCs that filed last week. Aggregate Fair Value reported by these BDCs is 28.50 Billion USD which is approximately 10.87% of aggregate AUM of all BDCs.
| Name | Number of Investments | % Portfolio | Cost | % Gain/Loss | Principal Value | Fair Value | FV Yield | Filtered Yield | Cost Yield |
|---|---|---|---|---|---|---|---|---|---|
| HPS Corporate Lending Fund | 366 | 100.00% | 6,839,415 | -0.962 | 7,685,590 | 6,773,623 | 17.86 | 11.77 | 17.01 |
| Morgan Stanley Direct Lending Fund | 405 | 100.00% | 2,992,717 | -2.226 | 2,991,261 | 2,926,097 | 11.83 | 11.67 | 11.27 |
| North Haven Private Income Fund LLC | 354 | 100.00% | 2,204,301 | -3.074 | 2,212,744 | 2,136,533 | 11.51 | 11.22 | 10.77 |
| Stone Point Capital Credit LLC | 139 | 100.00% | 1,778,957 | -1.492 | 1,806,554 | 1,752,410 | 11.79 | 11.65 | 11.44 |
| FS Energy & Power Fund | 76 | 100.00% | 1,648,959 | 5.682 | 1,071,773 | 1,742,661 | 11.78 | 11.49 | 203.23 |
| T Series Middle Market Loan Fund LLC | 242 | 100.00% | 1,367,999 | -2.371 | 1,380,912 | 1,335,567 | 11.69 | 11.55 | 11.21 |
| MSD Investment Corp. | 64 | 100.00% | 1,327,074 | -3.03 | 1,226,093 | 1,286,860 | 13.74 | 13.54 | 13.16 |
| Kayne Anderson BDC, LLC | 173 | 100.00% | 1,252,096 | 1.394 | 1,255,729 | 1,269,551 | 11.38 | 11.3 | 11.74 |
| AB Private Credit Investors Corp. | 450 | 100.00% | 1,253,166 | -1.531 | 1,251,345 | 1,233,974 | 25.87 | 11.21 | 11.06 |
| NMF SLF I, Inc. | 277 | 100.00% | 1,213,356 | -1.364 | 1,351,753 | 1,196,808 | 11.37 | 11.21 | 11.07 |
| SL Investment Corp. | 334 | 100.00% | 1,123,224 | -2.346 | 1,132,165 | 1,096,868 | 11.65 | 11.5 | 11.06 |
| MSC Income Fund Inc. | 365 | 100.00% | 1,081,391 | 0.381 | 933,169 | 1,085,509 | 20.15 | 12.99 | 13 |
| AG Twin Brook Capital Income Fund | 128 | 100.00% | 880,118 | 0.513 | 1,114,404 | 884,633 | 41.27 | 11.43 | 42.89 |
| Audax Credit BDC Inc. | 281 | 100.00% | 406,273 | -1.829 | 407,506 | 398,844 | 11.34 | 10.55 | 10.18 |
| Brightwood Capital Corp I | 36 | 100.00% | 389,188 | 0.709 | 390,558 | 391,946 | 11.92 | 11.92 | 12.1 |
| ARES STRATEGIC INCOME FUND | 150 | 100.00% | 334,822 | -0.22 | 341,635 | 334,085 | 9.9 | 9.84 | 9.82 |
| Star Mountain Lower Middle-Market Capital Corp. | 82 | 100.00% | 326,015 | 0.508 | 305,375 | 327,671 | 15.21 | 13.18 | 13.58 |
| Redwood Enhanced Income Corp. | 41 | 100.00% | 328,220 | -4.338 | 357,250 | 313,982 | 14.52 | 12.61 | 31.42 |
| Golub Capital Direct Lending Corp | 446 | 100.00% | 265,211 | -0.762 | 255,335 | 263,191 | 11.41 | 11.39 | 11.17 |
| Carlyle Secured Lending III | 72 | 100.00% | 238,478 | -0.422 | 242,597 | 237,472 | 12.03 | 12.02 | 11.94 |
| PIMCO Capital Solutions BDC Corp. | 32 | 100.00% | 244,421 | -3.613 | 268,339 | 235,590 | 16.97 | 10.33 | 15.59 |
| Investcorp Credit Management BDC Inc. | 60 | 100.00% | 244,372 | -9.435 | 217,631 | 221,315 | 13.31 | 12.3 | 12.95 |
| New Mountain Guardian IV BDC LLC | 75 | 100.00% | 190,895 | 0.558 | 237,660 | 191,960 | 11.9 | 11.75 | 12.06 |
| Muzinich BDC Inc. | 23 | 100.00% | 172,228 | 0.738 | 172,694 | 173,499 | 13.76 | 13.76 | 13.89 |
| Kayne DL 2021 Inc. | 91 | 100.00% | 131,468 | 2.067 | 131,588 | 134,186 | 11.19 | 11.19 | 11.73 |
| Kennedy Lewis Capital Co | 55 | 100.00% | 129,519 | -0.75 | 99,450 | 128,548 | 10.72 | 10.56 | 10.51 |
| Steele Creek Capital Corp | 167 | 100.00% | 136,253 | -5.723 | 137,774 | 128,455 | 11.08 | 9.76 | 9.36 |
| Fidelity Private Credit Fund | 16 | 100.00% | 103,516 | 1.006 | 107,447 | 104,557 | 11.81 | 11.81 | 12.02 |
| NexPoint Capital Inc. | 40 | 100.00% | 50,811 | -2.57 | 19,039 | 49,505 | — | 17.06 | 14.85 |
| Investcorp US Institutional Private Credit Fund | 23 | 100.00% | 41,966 | -0.239 | 42,760 | 41,865 | 12.13 | 12.13 | 12.35 |
| Firsthand Technology Value Fund Inc. | 76 | 100.00% | 134,709 | -73.749 | 98,375 | 35,362 | 9.08 | 9.08 | 109.6 |
| Guggenheim Credit Income Fund | 32 | 100.00% | 41,941 | -18.34 | 41,899 | 34,249 | 15.91 | 12.58 | 14.15 |
| Princeton Capital Corp. | 18 | 100.00% | 39,236 | -25.399 | 22,752 | 29,270 | — | — | 9.5 |
| Total | 5,189 | 100.00% | 28,912,314 | -1.44% | 29,311,155 | 28,496,647 | 15.54 | 11.66 | 19.55 |
Non-Accruals
At least 13 BDCs that filed last week have reported Non–Accruals amounting to 549.78 Million USD at Cost. Audax Credit BDC Inc. and MSC Income Fund Inc. are leading the Non-Accruals list.
| Name | Number of Investments | % Portfolio | Cost | % Gain/Loss | Principal Value | Fair Value | FV Yield | Filtered Yield | Cost Yield |
|---|---|---|---|---|---|---|---|---|---|
| Audax Credit BDC Inc. | 266 | 99.11% | 403,136 | -1.944 | 407,506 | 395,299 | 11.34 | 10.55 | 10.18 |
| MSC Income Fund Inc. | 8 | 0.68% | 48,744 | -84.94 | 50,025 | 7,341 | 449.87 | — | 21.46 |
| HPS Corporate Lending Fund | 5 | 0.49% | 34,775 | -4.874 | 35,190 | 33,080 | 14.95 | 13.18 | 12.73 |
| AB Private Credit Investors Corp. | 13 | 0.96% | 22,593 | -47.838 | 23,445 | 11,785 | 5,027.69 | — | 22.8 |
| MSD Investment Corp. | 1 | 0.28% | 11,287 | -67.768 | 11,928 | 3,638 | — | — | — |
| Investcorp Credit Management BDC Inc. | 4 | 1.32% | 10,363 | -71.756 | 10,381 | 2,927 | — | — | 19.49 |
| Princeton Capital Corp. | 2 | 12.17% | 6,016 | -40.813 | 6,016 | 3,561 | — | — | — |
| Star Mountain Lower Middle-Market Capital Corp. | 1 | 0.69% | 4,454 | -49.277 | 4,519 | 2,259 | 85.56 | — | 16.98 |
| FS Energy & Power Fund | 1 | — | 3,827 | — | 3,827 | — | — | — | — |
| Morgan Stanley Direct Lending Fund | 1 | 0.02% | 1,500 | -60.067 | 1,500 | 599 | — | — | — |
| Guggenheim Credit Income Fund | 1 | 0.13% | 1,458 | -97.051 | 4,291 | 43 | — | — | — |
| Steele Creek Capital Corp | 1 | 0.09% | 1,130 | -89.469 | 1,134 | 119 | — | — | — |
| SL Investment Corp. | 1 | 0.02% | 500 | -60 | 500 | 200 | — | — | — |
| Total | 305 | 2.67% | 549,784 | -16.18% | 560,261 | 460,851 | 57.37 | 10.71 | 11.69 |
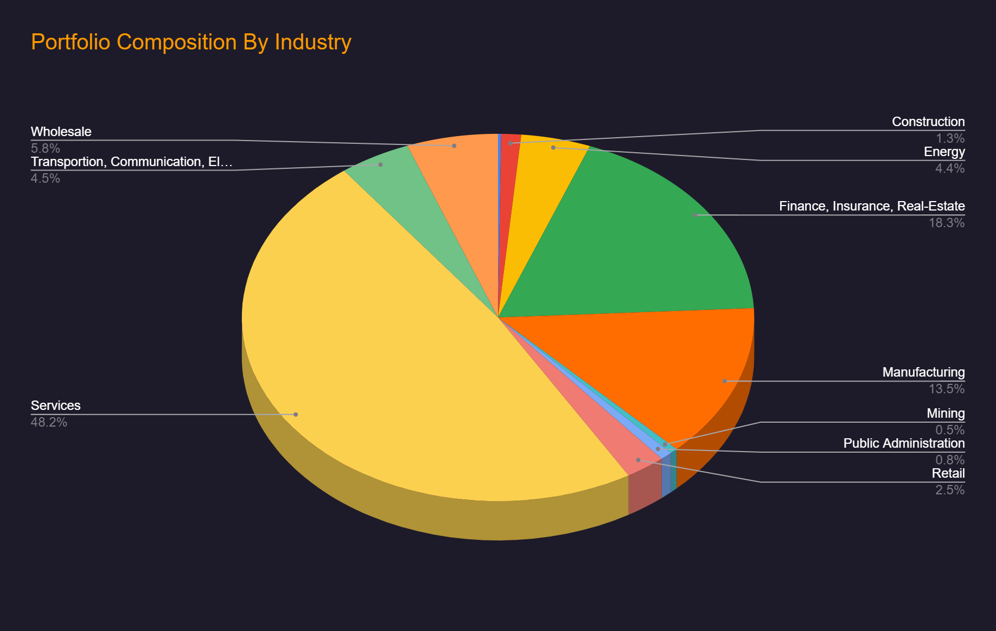
Portfolio Composition By Industry
The chart below is a bird’s-eye view of the BDCs aggregate Industry Diversification.
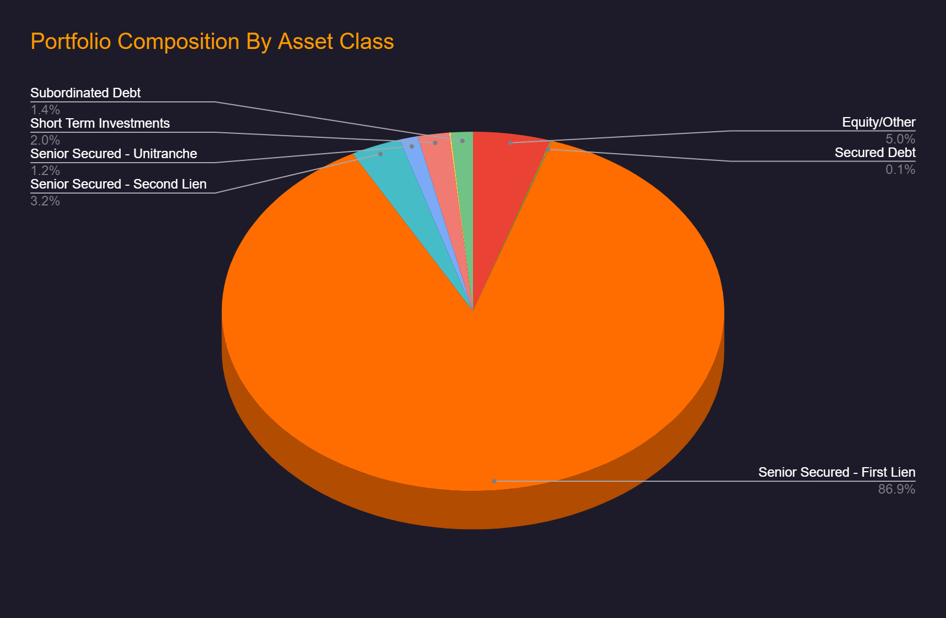
Portfolio Composition By Asset Class
The chart below is an overview of the BDCs aggregate Diversification by Asset Class.
BDC Investments Maturing in the next 12 Months
The table below summarizes aggregate investments of last week’s BDCs that are maturing in the next 12 months, which combined are worth more than 671.05 Million USD at cost.
| BDC | Cost (1000) | FV (1000) |
|---|---|---|
| MSC Income Fund Inc. | 160,309 | 124,847 |
| FS Energy & Power Fund | 122,728 | 127,761 |
| Kayne Anderson BDC, LLC | 113,370 | 114,098 |
| AB Private Credit Investors Corp. | 76,990 | 69,378 |
| Firsthand Technology Value Fund Inc. | 52,040 | 17,910 |
| Redwood Enhanced Income Corp. | 25,009 | 24,310 |
| PIMCO Capital Solutions BDC Corp. | 23,830 | 23,209 |
| Investcorp Credit Management BDC Inc. | 21,338 | 17,813 |
| Morgan Stanley Direct Lending Fund | 13,022 | 13,058 |
| Star Mountain Lower Middle-Market Capital Corp. | 12,078 | 11,843 |
| MSD Investment Corp. | 11,287 | 3,638 |
| Princeton Capital Corp. | 10,383 | 9,286 |
| Guggenheim Credit Income Fund | 6,721 | 4,652 |
| Stone Point Capital Credit LLC | 5,830 | 5,223 |
| Steele Creek Capital Corp | 4,555 | 4,022 |
| SL Investment Corp. | 4,341 | 4,353 |
| Audax Credit BDC Inc. | 3,575 | 3,287 |
| Kayne DL 2021 Inc. | 2,560 | 2,600 |
| NexPoint Capital Inc. | 1,104 | 1,102 |
| Golub Capital Direct Lending Corp | 6 | 6 |
| New Mountain Guardian IV BDC LLC | 0 | -37 |
| NMF SLF I, Inc. | -23 | -1,170 |
| Total | 671,053 | 581,189 |
Top 10 BDC Investments
BDCs portfolio quality can be measured by taking a deeper dive into the BDC’s top 10 investments. While these investments are small in number, they are the primary determinant of a BDC’s portfolio performance. Top 10 Investments of BDCs that filed last week amount to 8.42 Billion USD (Cost) accounting for 29.11% of their aggregate holdings (Cost).
| BDC | Cost (1000) | FV (1000) |
|---|---|---|
| HPS Corporate Lending Fund | 1,367,603 | 1,373,018 |
| FS Energy & Power Fund | 874,435 | 1,011,143 |
| Stone Point Capital Credit LLC | 646,773 | 647,125 |
| Morgan Stanley Direct Lending Fund | 645,674 | 634,017 |
| MSD Investment Corp. | 553,408 | 537,337 |
| North Haven Private Income Fund LLC | 440,493 | 435,152 |
| AG Twin Brook Capital Income Fund | 330,510 | 333,958 |
| T Series Middle Market Loan Fund LLC | 320,264 | 311,703 |
| Kayne Anderson BDC, LLC | 312,758 | 319,991 |
| Brightwood Capital Corp I | 289,663 | 291,325 |
| NMF SLF I, Inc. | 289,554 | 289,642 |
| SL Investment Corp. | 254,495 | 248,002 |
| AB Private Credit Investors Corp. | 233,362 | 233,279 |
| MSC Income Fund Inc. | 195,112 | 257,710 |
| Muzinich BDC Inc. | 171,821 | 172,789 |
| PIMCO Capital Solutions BDC Corp. | 164,107 | 157,657 |
| Redwood Enhanced Income Corp. | 145,717 | 143,114 |
| Star Mountain Lower Middle-Market Capital Corp. | 142,370 | 143,353 |
| Firsthand Technology Value Fund Inc. | 134,709 | 35,362 |
| Carlyle Secured Lending III | 116,034 | 115,827 |
| Investcorp Credit Management BDC Inc. | 101,413 | 99,747 |
| ARES STRATEGIC INCOME FUND | 101,336 | 100,890 |
| New Mountain Guardian IV BDC LLC | 99,792 | 100,068 |
| Golub Capital Direct Lending Corp | 99,499 | 99,731 |
| Fidelity Private Credit Fund | 74,597 | 75,267 |
| Kennedy Lewis Capital Co | 71,386 | 70,943 |
| Audax Credit BDC Inc. | 49,754 | 49,735 |
| Kayne DL 2021 Inc. | 48,048 | 49,099 |
| NexPoint Capital Inc. | 34,035 | 38,371 |
| Guggenheim Credit Income Fund | 33,982 | 31,654 |
| Princeton Capital Corp. | 29,028 | 29,270 |
| Investcorp US Institutional Private Credit Fund | 28,632 | 28,786 |
| Steele Creek Capital Corp | 16,816 | 16,366 |
| Total | 8,417,179 | 8,481,430 |
Source: The BDC Advantage, Advantage Data Inc., Copyright © 2023.Redistribution Strictly Prohibited. Data can not be used in any way to populate a database nor shared with unauthorized users. See ADI Terms. All rights reserved. +1 (617) 261 9700.
BDC Filing Season Recaps are written by Sourav Srimal, Nikhil Thadaney, Andrew Robartes, and Nayan Raj. For more information about our BDC data or our other products please contact marketpluse@solvefixedincome.com.
Sourav Srimal
Senior Vice President
ssrimal@solvefixedincome.com
Nikhil Thadaney
Data Analyst
nthadaney@solvefixedincome.com
Andrew Robartes
Data Analyst
arobartes@solvefixedincome.com
Nayan Raj
Data Analyst
nraj@solvefixedincome.com
Stay up-to-date with weekly summaries.
Related Resources
About SOLVE
SOLVE is the leading market data platform provider for fixed-income securities, trusted by sophisticated buy-side and sell-side firms worldwide. Founded in 2011, SOLVE leverages its AI-driven technology and deep industry expertise to offer unparalleled transparency into markets, reduce risk, and save hundreds of hours across front-office workflows. With the largest real-time datasets for Securitized Products, Municipal Bonds, Corporate Bonds, Syndicated Bank Loans, Convertible Bonds, CDS, and Private Credit, SOLVE empowers clients to transform the way they bring new securities to market, trade on secondary markets, and value highly illiquid securities. Headquartered in Connecticut, with offices across the globe, SOLVE is the definitive source for market pricing in fixed-income markets.
