
Municipals
GET OUR MUNICIPAL BOND MARKET SUMMARIES STRAIGHT TO YOUR INBOX. LEARN MORE
Municipal Bond Market Summary:
Week Ending 8/13/24
Our newsletter presents key trends derived from observable Municipal Bond pricing data over a weekly period.
![]()
Top 10 Performers
Showcases the top 10 Muni Bond performers based on price movements between 9/6/24-9/13/24
| RANK | BOND NAME | COUPON | MATURITY | CHANGE | PRC | PRC-1W | DEALERS |
| 1 | ANNA ISD | 4.000% | 02/15/54 | 4.06% | 99.44 | 95.56 | 6 |
| 2 | CMFA SPL FIN AGY 7-A2 | 4.000% | 08/01/47 | 4.05% | 90.00 | 86.50 | 2 |
| 3 | NJ ECON DEV AUTH | 4.000% | 06/15/35 | 4.03% | 106.92 | 102.78 | 3 |
| 4 | NEWARK HGR EDU FIN-A | 4.375% | 08/15/59 | 3.47% | 100.84 | 97.46 | 5 |
| 5 | SAN FRANCISCO CA BAY | 2.822% | 08/01/32 | 3.45% | 91.20 | 88.16 | 4 |
| 6 | MISSOURI ST HLTH & ED | 3.086% | 09/15/51 | 3.17% | 77.71 | 75.32 | 6 |
| 7 | NY TRANS FIN AUTH-F-3 | 3.000% | 02/01/38 | 3.05% | 95.99 | 93.14 | 6 |
| 8 | MONMOUTH CO NJ IMPT | 3.000% | 12/01/36 | 3.03% | 97.90 | 95.03 | 3 |
| 9 | LOUISVILLE & JEFFERSO | 3.000% | 05/15/46 | 3.01% | 81.74 | 79.35 | 5 |
| 10 | BENTON WASHINGTON WTR | 3.375% | 10/01/47 | 2.98% | 88.85 | 86.27 | 2 |
Bottom 10 Performers
Showcases the bottom 10 Muni Bond performers based on price movements between 9/6/24-9/13/24
| RANK | BOND NAME | COUPON | MATURITY | CHANGE | PRC | PRC-1W | DEALERS |
| 1 | CA CASHGR 2.90 11/01/2051 | 2.897% | 11/01/51 | -3.47% | 74.24 | 76.91 | 7 |
| 2 | KY KYSFAC 5.00 11/01/2037 | 5.000% | 11/01/37 | -2.88% | 109.83 | 113.09 | 2 |
| 3 | ID MADSCD 5.00 09/15/2040 | 5.000% | 09/15/40 | -2.80% | 114.98 | 118.30 | 2 |
| 4 | MN SLP 4.00 02/01/2027 | 4.000% | 02/01/27 | -2.72% | 105.60 | 108.55 | 3 |
| 5 | VA VACHGR 4.00 06/01/2046 | 4.000% | 06/01/46 | -2.50% | 89.70 | 92.00 | 5 |
| 6 | GA GAIMED 3.00 02/15/2051 | 3.000% | 02/15/51 | -2.47% | 78.38 | 80.37 | 3 |
| 7 | OK UNIHSG 3.38 07/01/2041 | 3.375% | 07/01/41 | -2.42% | 90.16 | 92.40 | 2 |
| 8 | NJ MAPSCD 3.00 07/15/2035 | 3.000% | 07/15/35 | -2.24% | 96.42 | 98.63 | 15 |
| 9 | MI MI ISH 2 03/01/2030 2.77 05/01/2035 | 2.770% | 05/01/35 | -2.24% | 85.65 | 87.62 | 6 |
| 10 | VA TOBGEN 5.00 06/01/2047 | 5.000% | 06/01/47 | -2.06% | 96.78 | 98.81 | 3 |
Top 10 State Performers
Showcases the top 10 Muni State performers based on yield movements between 9/6/24-9/13/24
| RANK | STATE | CHANGE | YLD | YLD-1W |
| 1 | ME | -25 bps | 3.34% | 3.59% |
| 2 | AL | -18 bps | 3.38% | 3.56% |
| 3 | ND | -17 bps | 3.18% | 3.36% |
| 4 | NE | -16 bps | 3.30% | 3.46% |
| 5 | SD | -15 bps | 3.73% | 3.88% |
| 6 | SC | -12 bps | 3.36% | 3.48% |
| 7 | TN | -10 bps | 3.30% | 3.40% |
| 8 | DE | -9 bps | 2.90% | 2.99% |
| 9 | VA | -9 bps | 3.20% | 3.30% |
| 10 | UT | -9 bps | 3.09% | 3.18% |
Bottom 10 State Performers
Showcases the bottom 10 Muni State performers based on yield movements between 9/6/24-9/13/24
| RANK | STATE | CHANGE | YLD | YLD-1W |
| 1 | DC | 20 bps | 3.49% | 3.29% |
| 2 | OK | 10 bps | 3.00% | 2.90% |
| 3 | HI | 8 bps | 3.89% | 3.82% |
| 4 | NC | 7 bps | 3.22% | 3.15% |
| 5 | MO | 7 bps | 3.52% | 3.45% |
| 6 | IN | 6 bps | 3.37% | 3.31% |
| 7 | MS | 5 bps | 3.76% | 3.71% |
| 8 | WA | 4 bps | 3.60% | 3.56% |
| 9 | LA | 4 bps | 3.63% | 3.60% |
| 10 | MN | 3 bps | 3.42% | 3.38% |
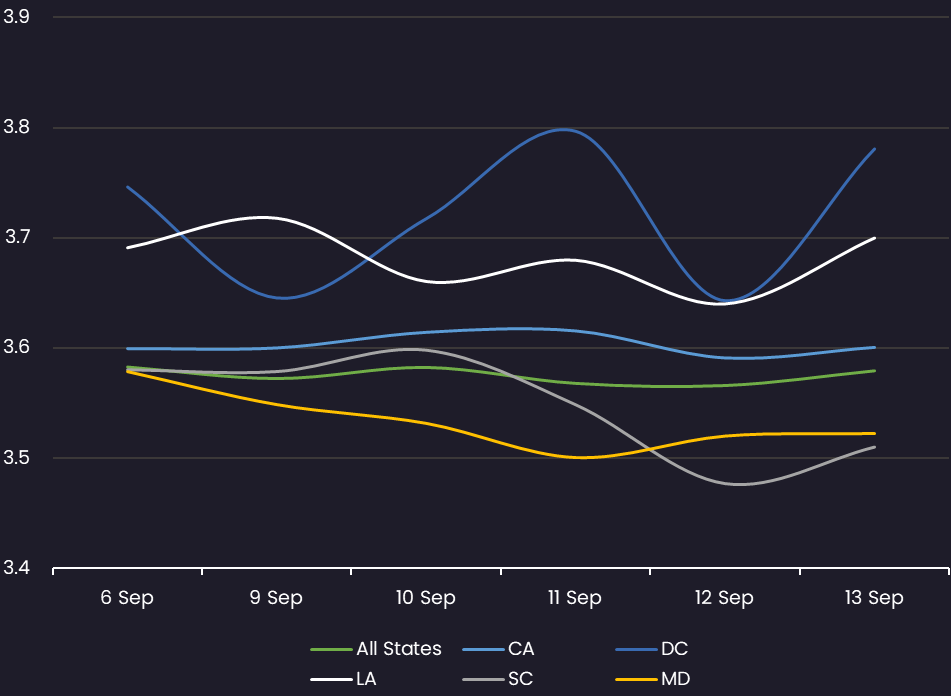
10 Year Yield by State – All
Displays the average Muni 10 year yield by state between 9/6/24-9/13/24 (General Obligation and Revenue Bonds)
Results are based on 5 select states, however, we offer data across all 50 states and U.S. territories
10 Year Yield by State – GO Only
Displays the average Muni 10 year yield by state between 9/6/24-9/13/24 (General Obligation Bonds only)
Results are based on 5 select states, however, we offer data across all 50 states and U.S. territories
")
10 Year Yield by State – Rev Only
Displays the average Muni 10 year yield by state between 9/6/24-9/13/24 (Revenue Bonds only)
Results are based on 5 select states, however, we offer data across all 50 states and U.S. territories
")
Sentiment
Reveals the percent of Muni bonds increasing in price (advancers) vs. decreasing in price (decliners) between 9/6/24-9/13/24
")
Top Quote Volume Movers: This Week vs Last Week
Exhibits the Munis with the largest increase in quote volume for the week ending 9/6/24 vs. the week ending 9/13/24
| RANK | TRANCHE | COUPON | MATURITY | PRIOR WEEK | THIS WEEK | INCREASE | % INCREASE |
| 1 | NYC TRUST CULT RES-A | 4.000% | 07/01/46 | 9 | 128 | 119 | 1322% |
| 2 | DASNY-A | 4.000% | 07/01/48 | 14 | 107 | 93 | 664% |
| 3 | DASNY-A-REV-REF | 4.000% | 07/01/49 | 41 | 133 | 92 | 224% |
| 4 | DASNY -REF | 4.000% | 07/01/52 | 44 | 133 | 89 | 202% |
| 5 | SAN ANTONIO-D-REF-REV | 5.250% | 02/01/54 | 90 | 158 | 68 | 76% |
| 6 | MONROE CO INDL DEV | 5.250% | 06/01/49 | 19 | 85 | 66 | 347% |
| 7 | CO REGL TRANS DT-REF | 5.000% | 06/01/34 | 64 | 128 | 64 | 100% |
| 8 | MONROE CO INDL DEV -A | 4.000% | 07/01/50 | 66 | 130 | 64 | 97% |
| 9 | SOUTHFIELD PUB SCHS | 5.000% | 05/01/49 | 17 | 79 | 62 | 365% |
| 10 | PENNSYLVANIA ST TURNP | 4.000% | 12/01/50 | 7 | 69 | 62 | 886% |
Most Quoted Munis
Ranks the Munis that were quoted by the highest number of dealers between 9/6/24 – 9/13/24
| RANK | TRANCHE | COUPON | MATURITY | DEALERS |
| 1 | CA UNIV REGENTS-BW | 5.000% | 05/15/35 | 45 |
| 2 | NYC TRANSITIONAL-A-1 | 5.000% | 11/01/35 | 44 |
| 3 | NEW YORK C-1 | 4.000% | 09/01/52 | 41 |
| 4 | MINNEAPOLIS ST PAUL-A | 4.000% | 01/01/54 | 40 |
| 5 | ROYSE ISD | 5.000% | 02/15/54 | 40 |
| 6 | NYC TRANSITIONAL-A-1 | 5.000% | 11/01/31 | 40 |
| 7 | NEW BRAUNFELS ISD | 4.000% | 02/01/52 | 38 |
| 8 | CA UNIV REGENTS-BW | 5.000% | 05/15/54 | 37 |
| 9 | PEARLAND-CTFS OBLIG-C | 4.000% | 09/01/49 | 37 |
| 10 | SAN DIEGO UNIF SD-B3 | 4.000% | 07/01/54 | 37 |
Stay up-to-date with weekly summaries.
 Syndicated Bank Loans
  Municipals
  Corporates
  Credit Default Swaps
  BDCs
BDCs  SOLVE Insights
  SOLVE Newsroom


