Syndicated Bank Loan Market Summary – Week Ending 6/30/23
GET OUR BANK LOAN MARKET SUMMARIES STRAIGHT TO YOUR INBOX. LEARN MORE
Syndicated Bank Loan Market Summary: Week Ending 6/30/23
Our newsletter presents key trends derived from observable Syndicated Bank Loan pricing data over a weekly period.
New Issues
Loans issued during the week ending 6/30/23
| ISSUER | AMOUNT (MM) | LOAN TYPE | MATURITY | RATE |
|---|---|---|---|---|
| Univar Inc. | 2400 | Term Loan | 6/7/2030 | S+500 |
| Ineos Hldgs LTD | 650 | Term Loan | 6/12/2030 | S+375 |
| Heritage Grocers | 460 | Term Loan | 8/1/2029 | S+675 |
forward calendar
Forward calendar during the week ending 6/30/23
| Issuer | Deal Information | Banks | Expected Issue Date |
|---|---|---|---|
| Chart Industries Inc. | $250MM TLB | JPM | Q2 2023 |
| Cyanco Intermediate 2 Corp | $420MM TLB | DB,MS,RBC,SG | Q2 2023 |
| Dave & Buster’s Inc. | $844MM TLB | DB | Q2 2023 |
| Helix Gen Funding LLC | $700MM TL | BCLY,GS,RBC,BMO,MUFG | Q2 2023 |
| Idemia | $642MM TLB (B2) | JPM,BNP,CA,HSBC,SG,DB | Q2 2023 |
| Maxlinear Inc. | $3.5B credit facilities: $250MM RC; $512.5MM TLA; $2.7375 TLB | WF,BMO,CTZ,TRS | Q2 2023 |
| Upfield | $883MM TL | KKR,BNP,CITI,CAG,CS,DB,GS | Q2 2023 |
Largest Loans
Highlights the weekly price movements and quote depth for the 20 largest bank loans between 6/23/23 – 6/30/23
| RANK | SIZE (MM) | NAME | CHANGE | PX | PX-1W | DEALERS |
|---|---|---|---|---|---|---|
| 1 | 8,572 | GEO GROUP TL1 | 0.00% | 101.48 | 101.47 | 12 |
| 2 | 5,160 | INTEL TL | 0.29% | 95.48 | 95.21 | 11 |
| 3 | 5,000 | UNITED CONTINENTAL TL B | 0.13% | 99.87 | 99.74 | 13 |
| 4 | 4,750 | ZAYO TL | -0.95% | 78.49 | 79.24 | 16 |
| 5 | 4,750 | HUB INTL LTD TL B5 | 0.26% | 100.15 | 99.89 | 15 |
| 6 | 4,559 | TRANSDIGM INC. TL I | 0.03% | 99.89 | 99.86 | 16 |
| 7 | 3,900 | DIRECTV TL | 0.66% | 97.62 | 96.98 | 15 |
| 8 | 3,600 | CDK GLOBAL TL | 0.29% | 99.71 | 99.42 | 12 |
| 9 | 3,582 | MISYS TL B | -0.74% | 95.95 | 96.67 | 13 |
| 10 | 3,515 | LIFEPOINT HOSPITALS TL B | 1.83% | 92.59 | 90.93 | 10 |
| 11 | 3,500 | AMERICAN AIRLINES TL B | 0.52% | 102.14 | 101.61 | 12 |
| 12 | 3,500 | SEDGWICK TL B | 0.54% | 99.30 | 98.76 | 10 |
| 13 | 3,500 | PILOT TRAVEL TL B | 0.05% | 99.80 | 99.74 | 10 |
| 14 | 3,450 | GOLDEN NUGGET INC TL B | 0.56% | 98.79 | 98.24 | 12 |
| 15 | 3,420 | RCN GRANDE TL | 0.47% | 83.47 | 83.09 | 11 |
| 16 | 3,380 | SOLERA TL B | 0.96% | 91.67 | 90.80 | 12 |
| 17 | 3,300 | NTL CABLE PLC TL N | 0.58% | 99.13 | 98.56 | 12 |
| 18 | 3,190 | INTELSAT EXIT TL B | 0.32% | 99.47 | 99.15 | 13 |
| 19 | 3,100 | HUNTER DOUGLAS TL B | 2.22% | 94.61 | 92.56 | 11 |
| 20 | 3,100 | ASURION TL B8 | 1.30% | 96.14 | 94.90 | 10 |
| AVERAGE | 4,041 | 0.47% | 96.29 | 95.84 | 12.3 |
Top 10 Performers
Showcases the top 10 loan performers based on the largest bid price increases between 6/23/23-6/30/23
| RANK | NAME | CHANGE | PX | PX-1W | DEALERS |
|---|---|---|---|---|---|
| 1 | CITY BREWING TL B | 18.64% | 61.69 | 52.00 | 9 |
| 2 | WHOLE EARTH BRANDS TL | 10.99% | 80.67 | 72.68 | 6 |
| 3 | CBS RADIO INC TL B | 10.22% | 54.73 | 49.66 | 9 |
| 4 | TKC HOLDINGS TL | 5.79% | 92.95 | 87.87 | 9 |
| 5 | TOSCA SERVICES TL | 4.61% | 80.72 | 77.17 | 11 |
| 6 | STRATEGIC PARTNERS TL B | 3.93% | 55.05 | 52.97 | 9 |
| 7 | BRAND ENERGY TL | 3.79% | 98.71 | 95.10 | 11 |
| 8 | PACKERS HOLDINGS TL | 3.69% | 69.18 | 66.72 | 14 |
| 9 | FOREST CITY ENTERPRISES TL B | 3.40% | 77.16 | 74.62 | 8 |
| 10 | POWER STOP TL B | 3.30% | 73.78 | 71.42 | 3 |
Bottom 10 Perfromers
Showcases the bottom 10 loan performers based on the largest bid price decreases between 6/23/23-6/30/23
| RANK | NAME | CHANGE | PX | PX-1W | DEALERS |
|---|---|---|---|---|---|
| 1 | DELL SOFTWARE GROUP 2ND LIEN TL | -6.56% | 65.50 | 70.10 | 6 |
| 2 | DELL SOFTWARE GROUP TL B | -4.66% | 77.25 | 81.03 | 13 |
| 3 | USIC 2ND LIEN TL | -3.63% | 89.95 | 93.34 | 5 |
| 4 | ELECTRONICS FOR IMAGING TL | -3.24% | 67.92 | 70.19 | 10 |
| 5 | UNIFRAX TL B | -2.80% | 88.34 | 90.89 | 10 |
| 6 | USIC TL | -2.58% | 94.52 | 97.02 | 5 |
| 7 | SPRINGS WINDOW TL B | -2.11% | 80.79 | 82.54 | 10 |
| 8 | ICP GROUP TL | -1.97% | 75.65 | 77.17 | 7 |
| 9 | SI GROUP TL | -1.51% | 78.80 | 80.01 | 9 |
| 10 | EAGLEVIEW TL B | -1.00% | 87.48 | 88.37 | 7 |
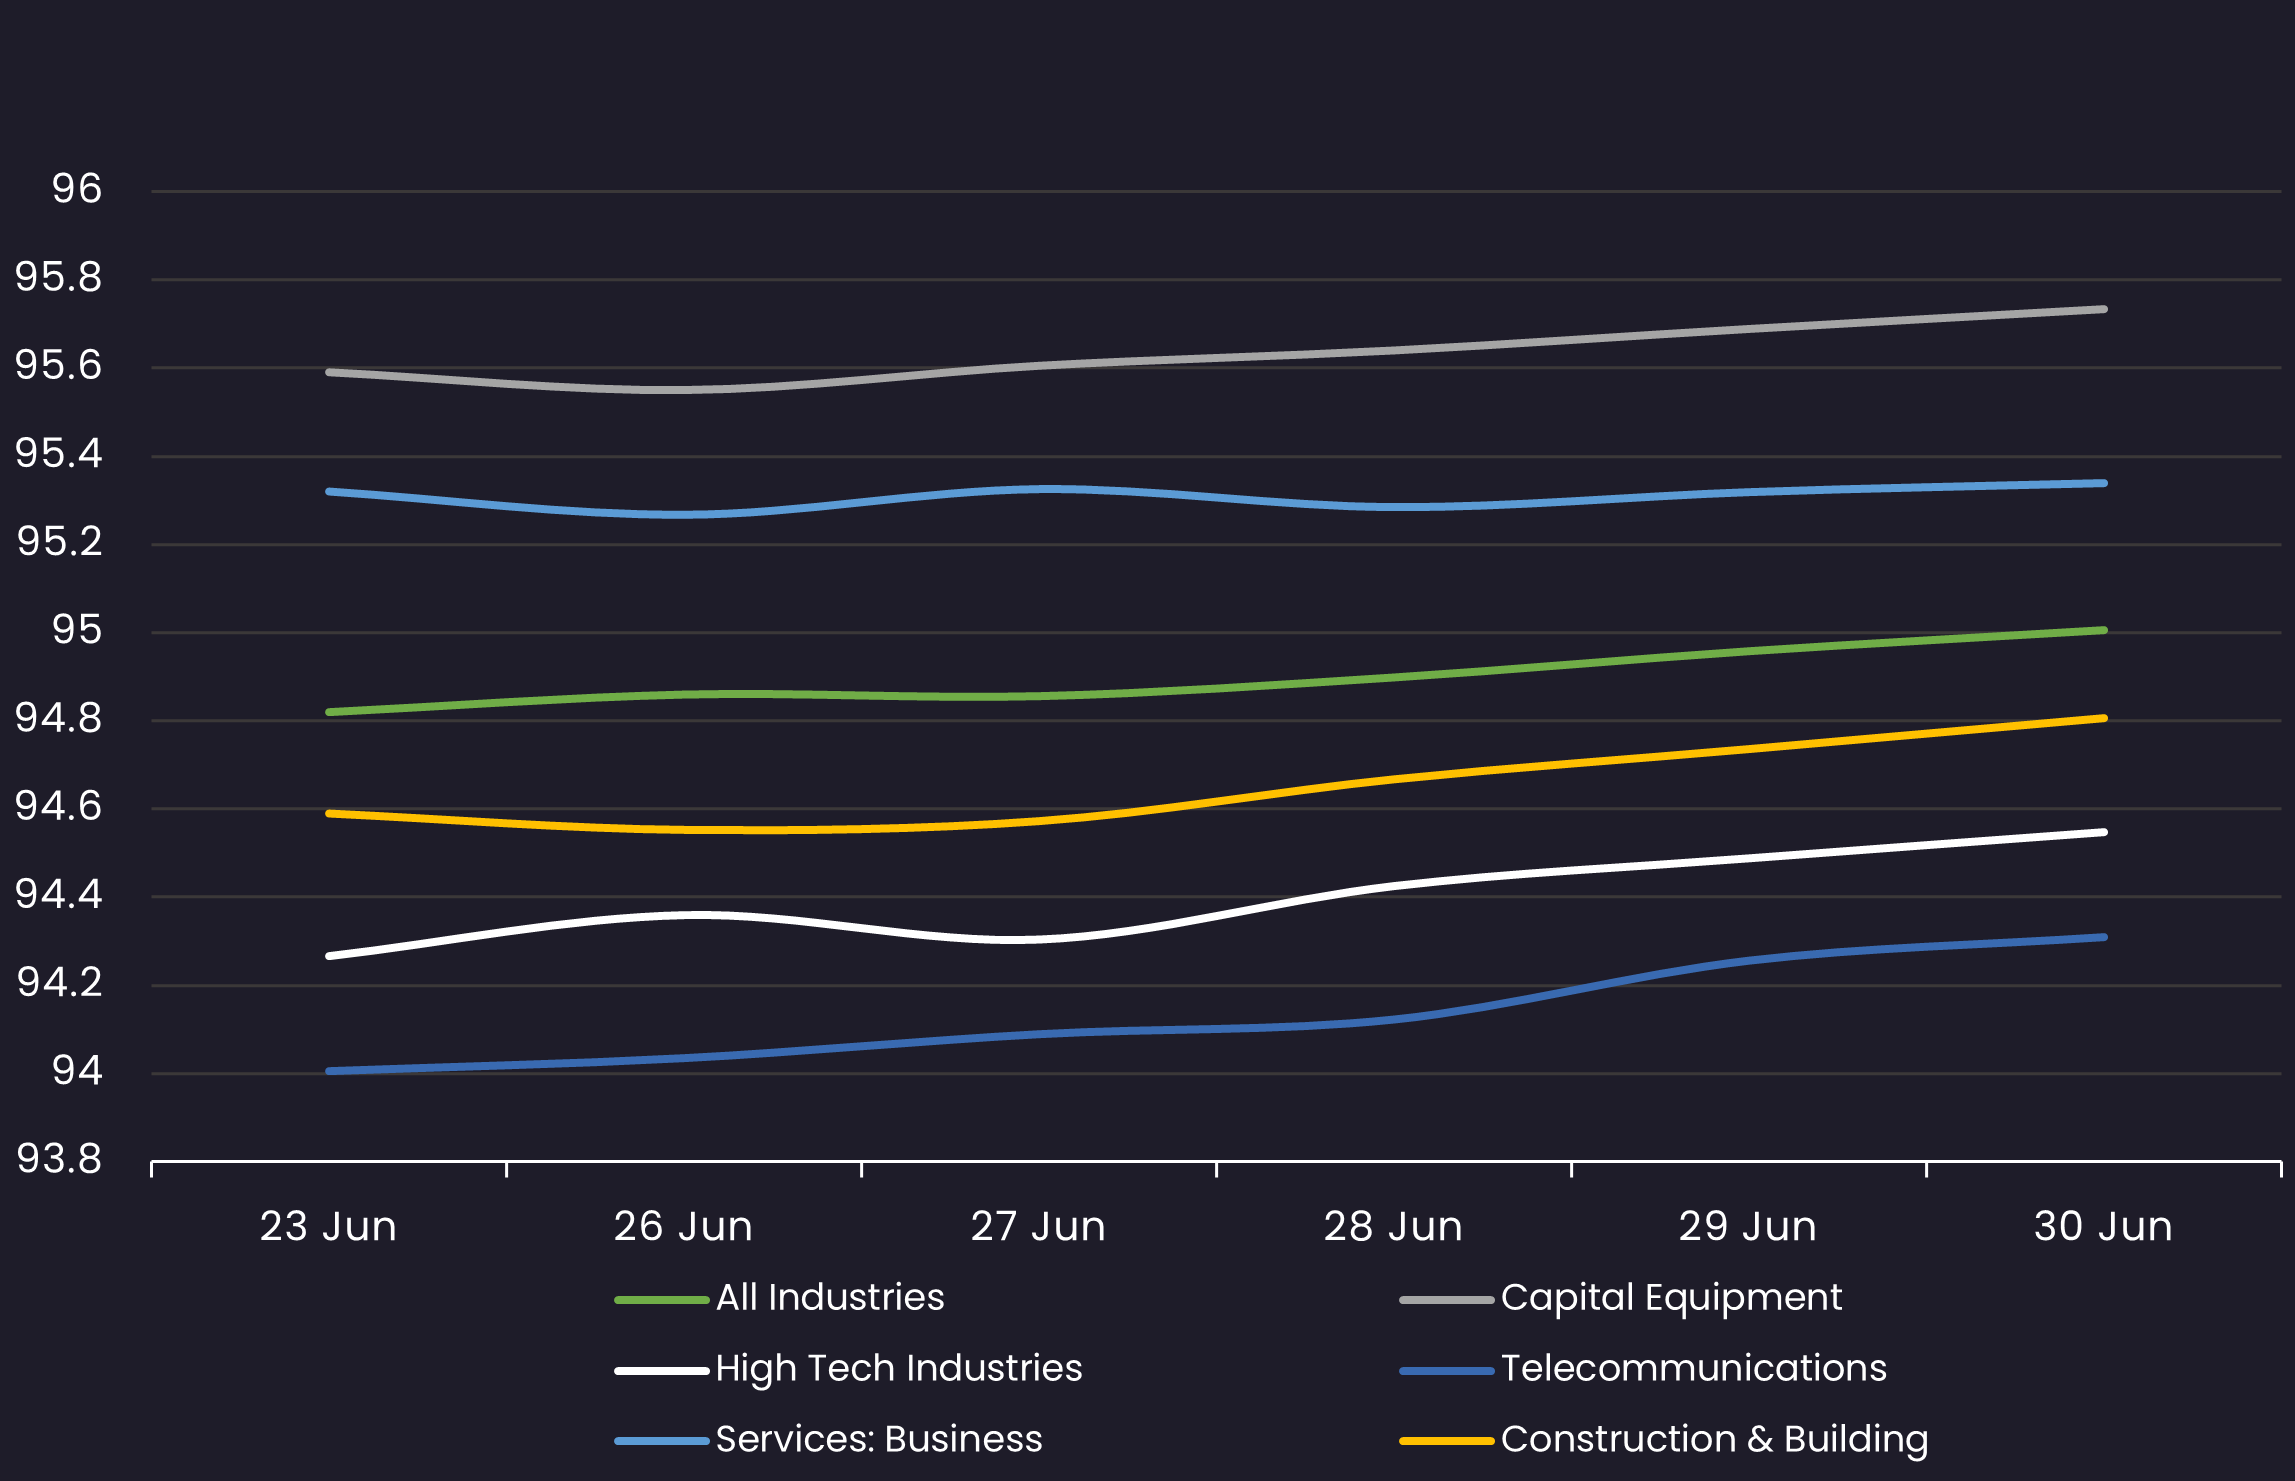
Avg Bid PX by Sector
Displays the average loan bid price by sector between 6/23/23-6/30/23 Results are based on 5 select industry sectors, however, we offer data across 36 sectors
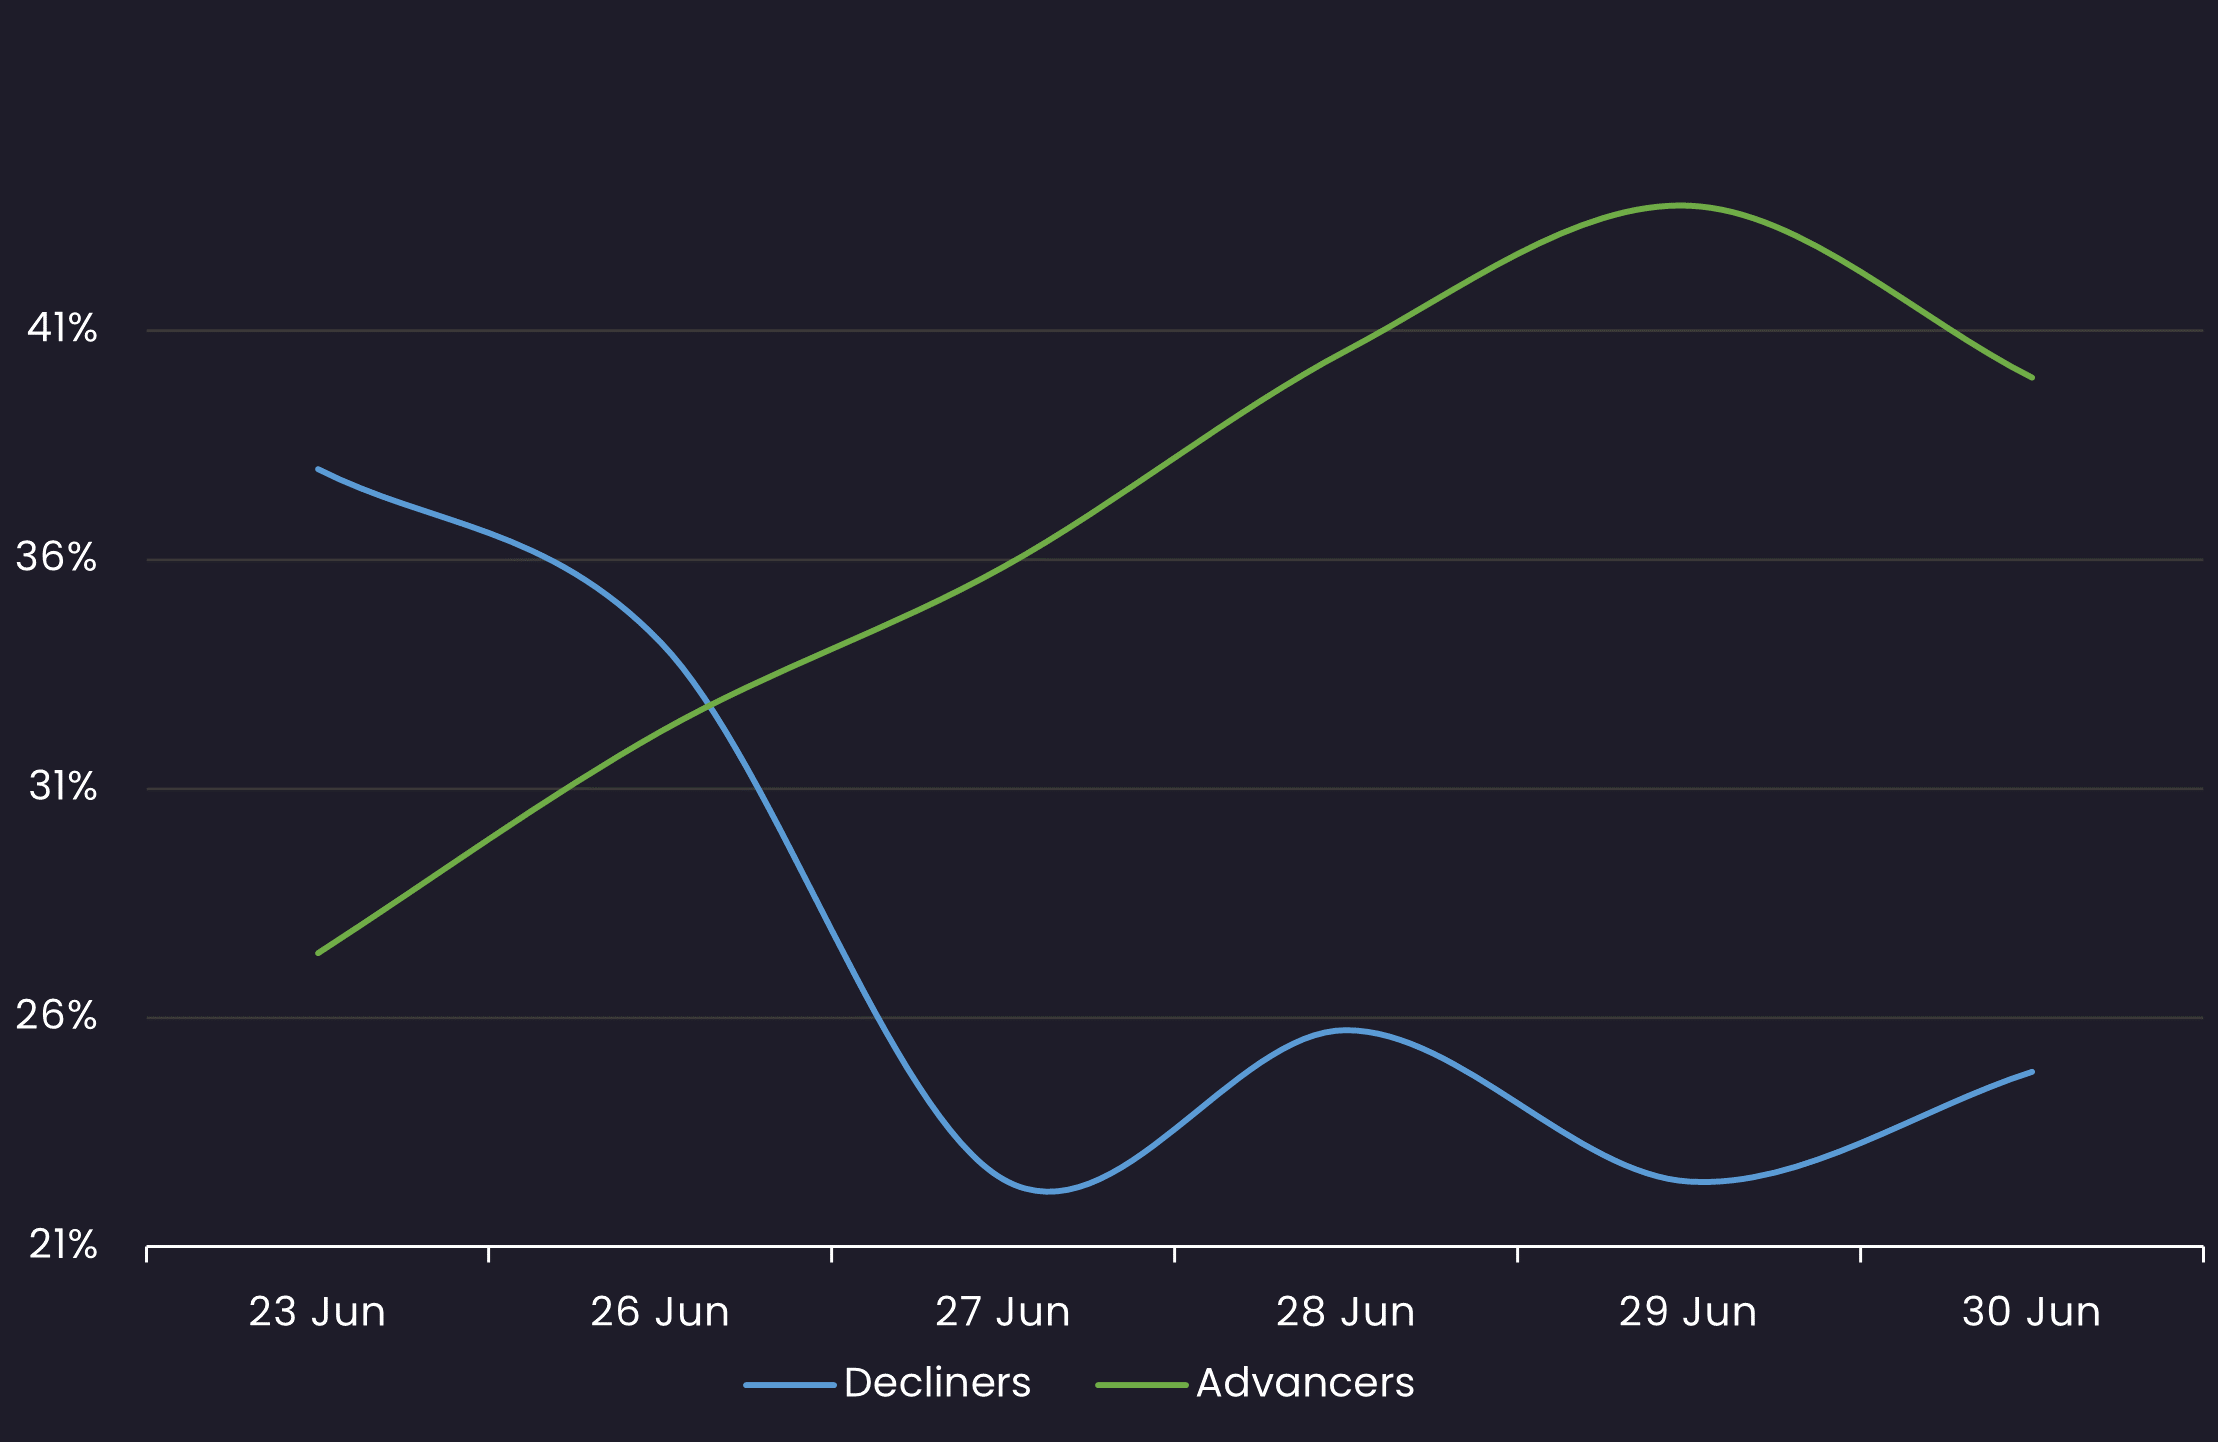
Sentiment
Reveals the percent of loans increasing in price (advancers) vs. loans decreasing in price (decliners) between 6/23/23-6/30/23
Top Quote Volume Movers: This Week vs Last Week
Exhibits the loans with the largest increase in quote volume for the week ending 6/23/23 vs. the week ending 6/30/23
| RANK | TRANCHE | PRIOR WEEK | THIS WEEK | INCREASE | % INCREASE |
|---|---|---|---|---|---|
| 1 | TRANSDIGM INC. TL I | 92 | 126 | 34 | 37% |
| 2 | HUB INTL LTD TL B5 | 84 | 116 | 32 | 38% |
| 3 | LIFEPOINT HOSPITALS TL B | 50 | 81 | 31 | 62% |
| 4 | ASCEND PERFORMANCE MATERIALS TL B | 56 | 86 | 30 | 54% |
| 5 | BMC SOFTWARE TL B | 84 | 114 | 30 | 36% |
| 6 | TRANSDIGM INC. TL H | 84 | 114 | 30 | 36% |
| 7 | CABLE & WIRELESS TL B5 | 42 | 71 | 29 | 69% |
| 8 | OPEN TEXT CORP TL B | 56 | 85 | 29 | 52% |
| 9 | HILEX POLY TL B | 110 | 137 | 27 | 25% |
| 10 | US RADIOLOGY SPECIALISTS TL B | 12 | 38 | 26 | 217% |
Most Quoted Loans
Ranks the loans that were quoted by the highest number of dealers between 6/23/23-6/30/23
| RANK | TRANCHE | DEALERS |
|---|---|---|
| 1 | HEARTHSIDE FOODS TL B | 17 |
| 2 | ZIGGO EUR TL H | 17 |
| 3 | HUB INTL LTD TL B3 | 16 |
| 4 | VERISURE EUR TL B | 16 |
| 5 | BELLIS ACQUISITION CO PLC EUR TL B | 16 |
| 6 | BERRY PLASTICS TL Z | 16 |
| 7 | UPC HOLDING BV EUR TL | 16 |
| 8 | SIGMA BIDCO GBP TL B4 | 16 |
| 9 | TRANSDIGM INC. TL I | 16 |
| 10 | GRIFOLS WORLDWIDE EUR TL B | 16 |
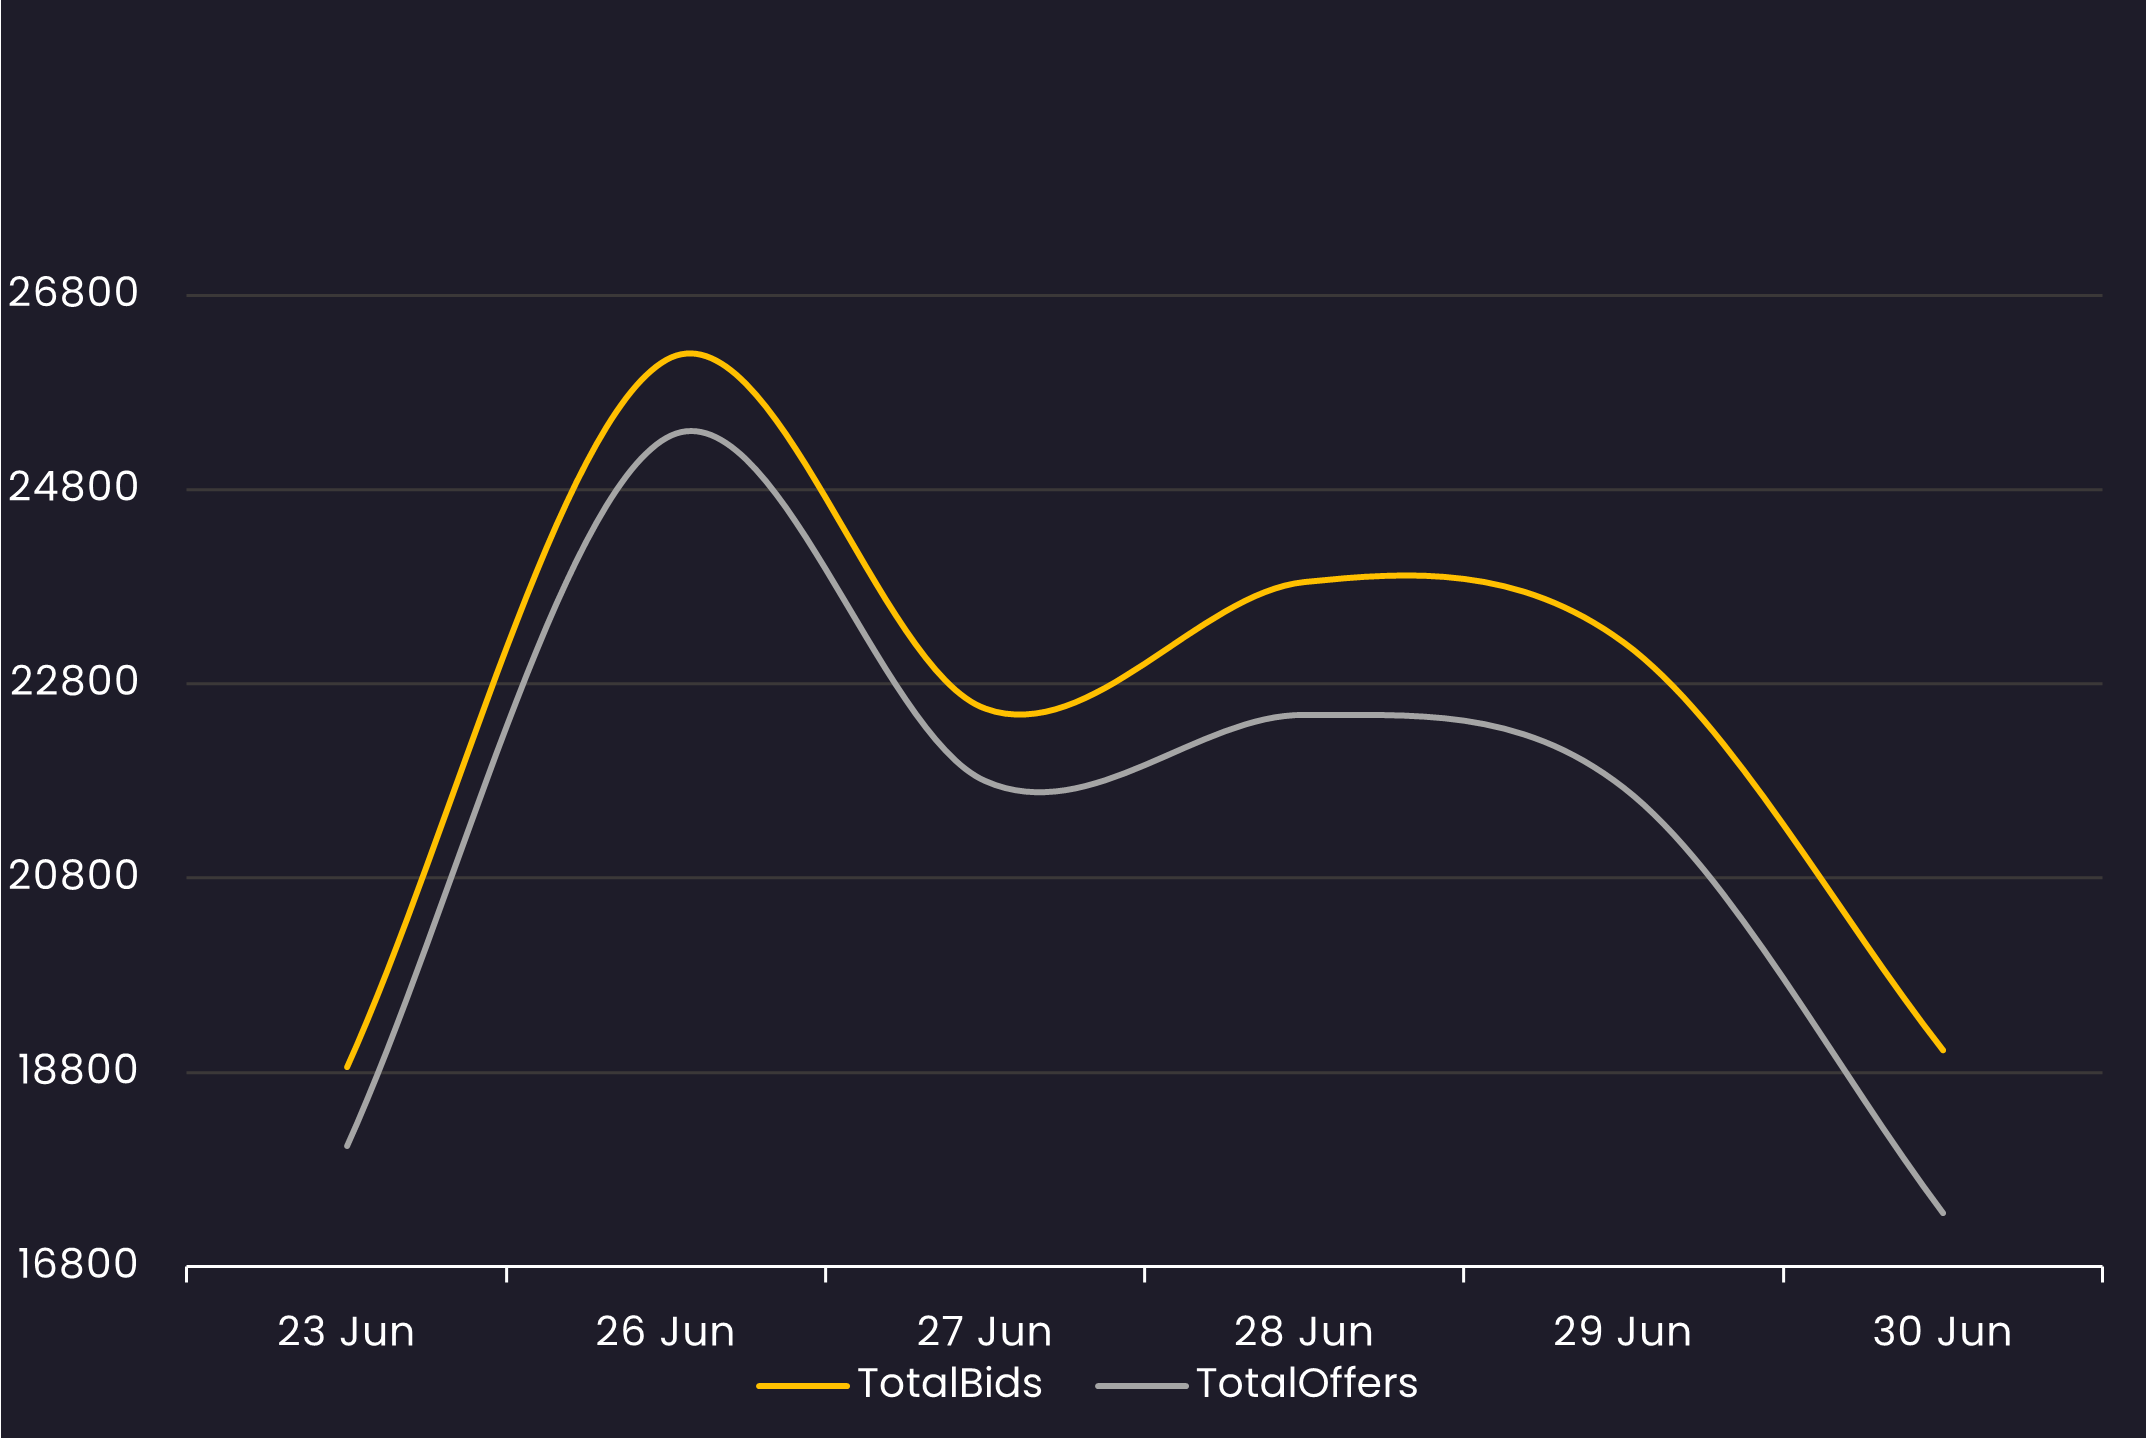
Bid and Offer Volume
Reveals the total number of quotes by bid and offer between 6/23/23-6/30/23
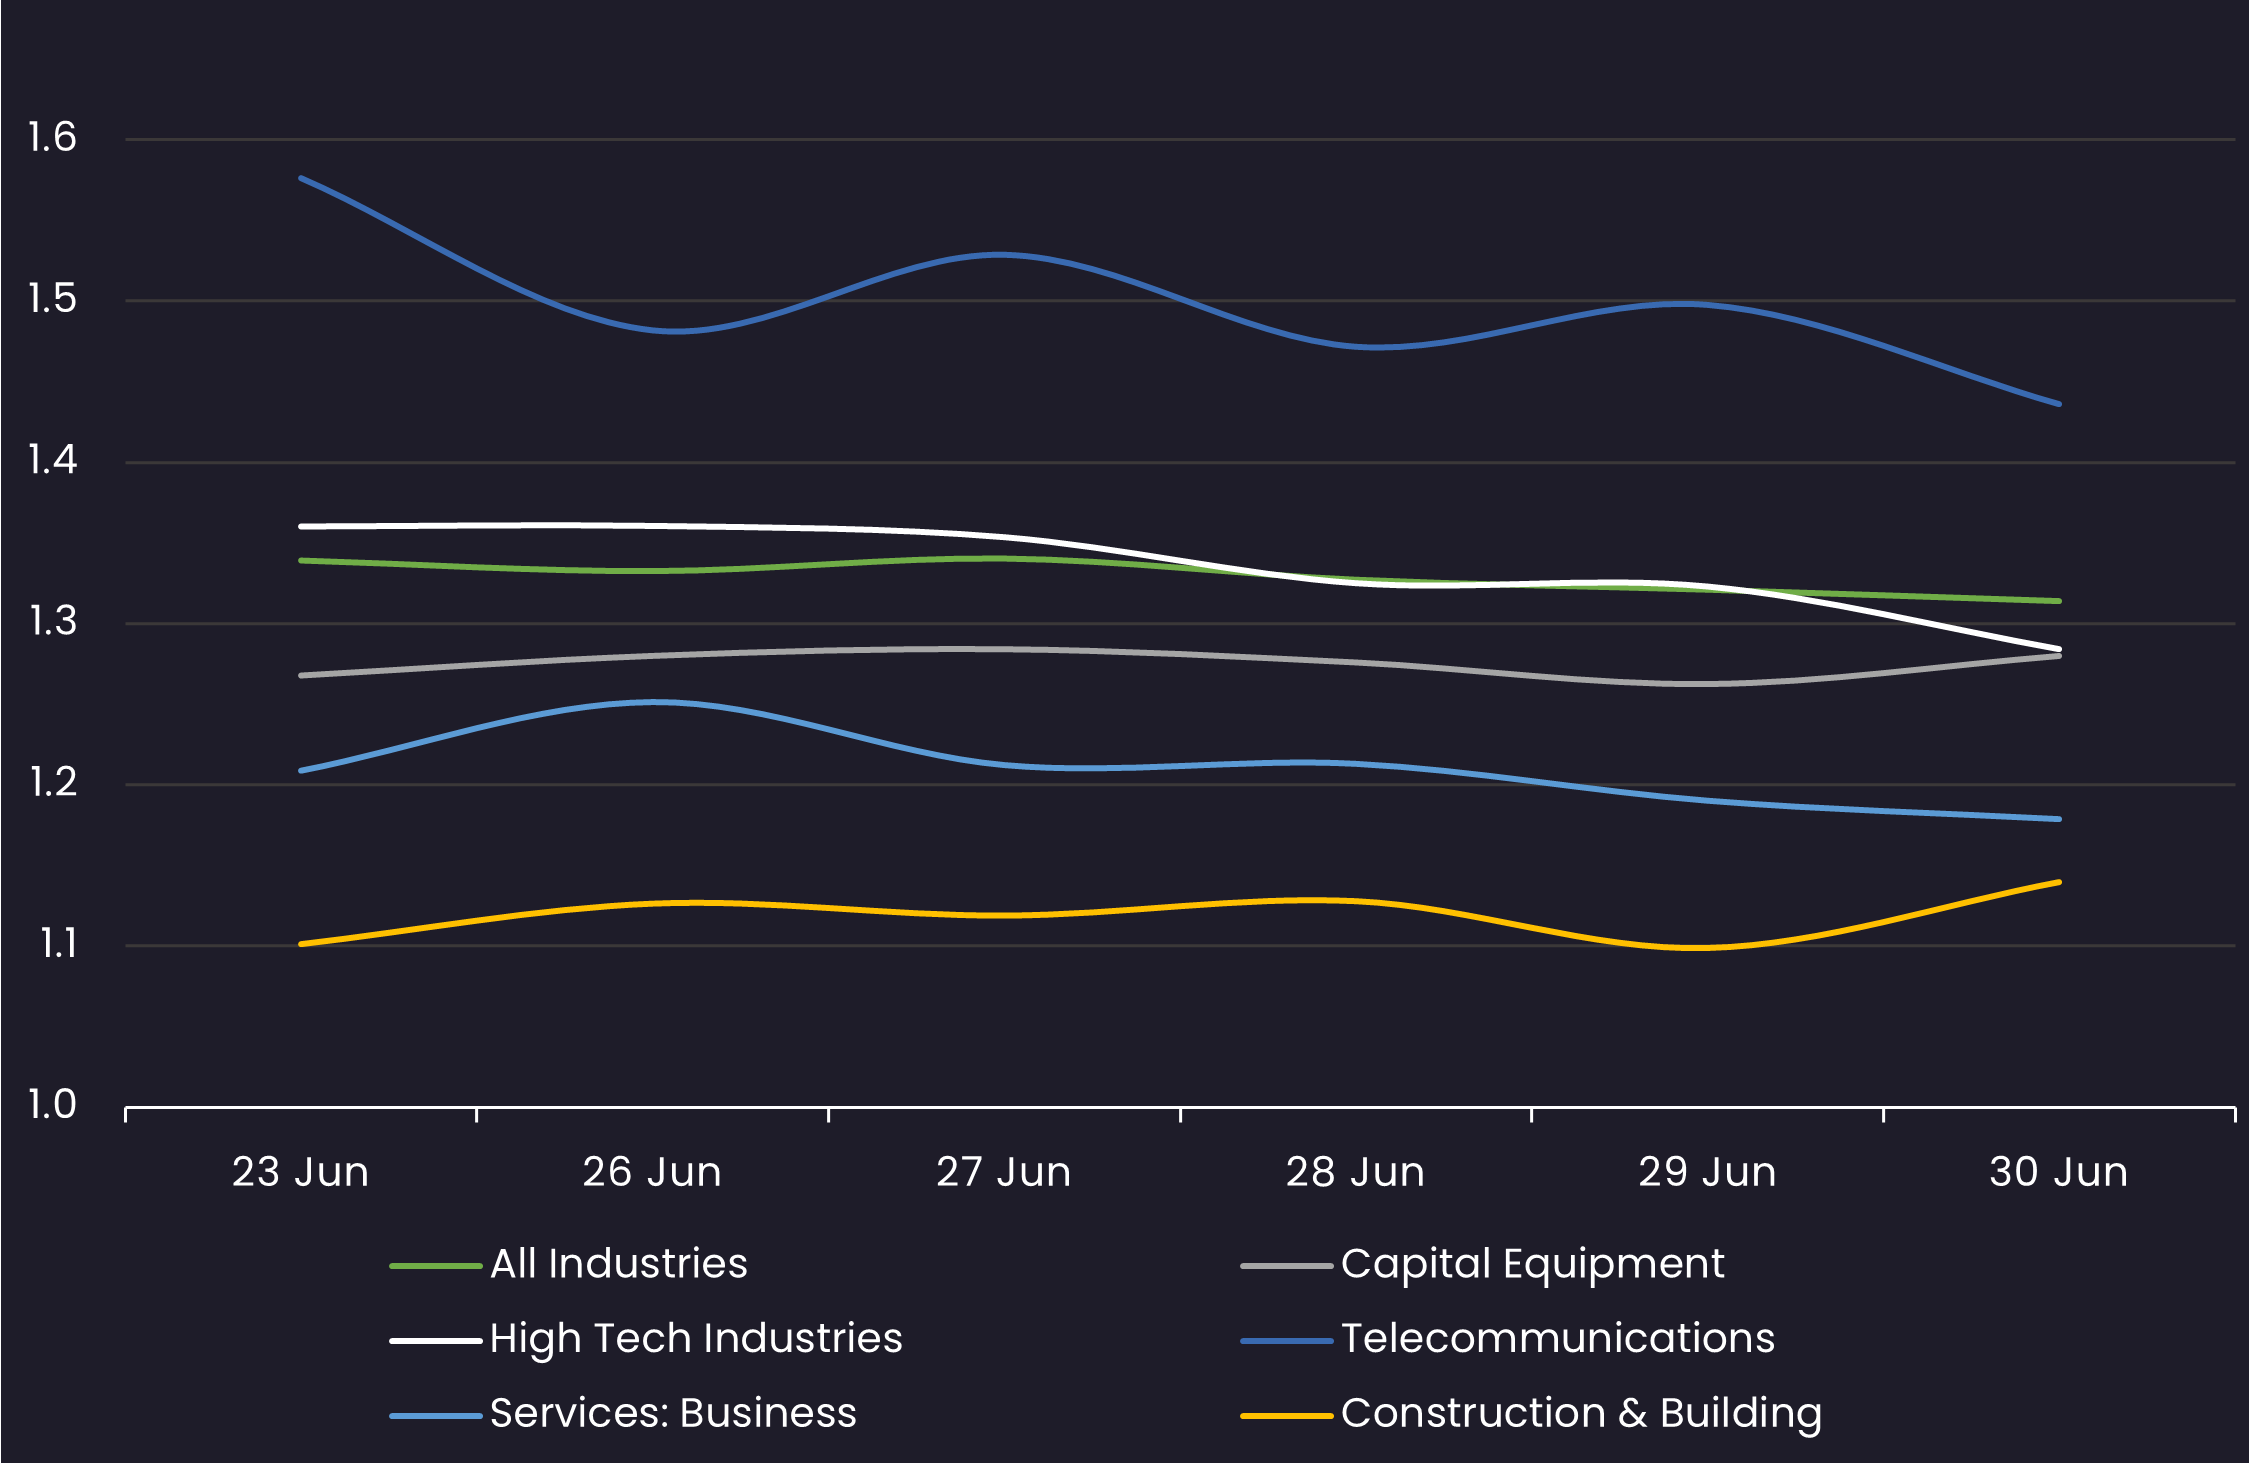
Sector Bid-Offer Spread
Results are based on 5 select industry sectors, however, we offer data across 36 sectors
Stay up-to-date with weekly summaries.
Related Resources
About SOLVE
SOLVE is the leading market data platform provider for fixed-income securities, trusted by sophisticated buy-side and sell-side firms worldwide. Founded in 2011, SOLVE leverages its AI-driven technology and deep industry expertise to offer unparalleled transparency into markets, reduce risk, and save hundreds of hours across front-office workflows. With the largest real-time datasets for Securitized Products, Municipal Bonds, Corporate Bonds, Syndicated Bank Loans, Convertible Bonds, CDS, and Private Credit, SOLVE empowers clients to transform the way they bring new securities to market, trade on secondary markets, and value highly illiquid securities. Headquartered in Connecticut, with offices across the globe, SOLVE is the definitive source for market pricing in fixed-income markets.
