Syndicated Bank Loan Market Summary – December 2025
GET OUR BANK LOAN MARKET SUMMARIES STRAIGHT TO YOUR INBOX. LEARN MORE
Syndicated Bank Loan Market Summary: December 2025
Our newsletter presents key trends derived from observable Syndicated Bank Loan pricing data over a monthly period.
New Issues
Loans issued during the month ending 12/31/25
| ISSUER | AMOUNT (MM) | LOAN TYPE | MATURITY | RATE |
|---|---|---|---|---|
| Africa Finance Corp. | – | Term Loan | 8/12/2028 | S+110 |
| Turk Ekonomi Bankasi AS | – | Term Loan | 11/15/2026 | E+85 |
| Action Nederland BV | – | Term Loan | 10/26/2032 | – |
| Anticimex Intl. | 600 | Term Loan | 11/30/2031 | – |
| Orpea | 2200 | Term Loan | 11/12/2031 | E+274 |
| Radiate Holdco LLC | – | Delayed-draw Term Loan | 6/26/2029 | – |
| Focus Financial Partners LLC | – | Term Loan | 9/15/2031 | – |
| Castle US Holding Corp. | – | Term Loan | 5/31/2030 | – |
| American Bath | 140 | Term Loan | 11/23/2027 | – |
| Covis Pharma BV | 595 | Term Loan | 2/18/2027 | – |
| Gulf Energy Maritime PJSC | 275 | Term Loan | 6/15/2024 | – |
| CPC Acquisition Corp. | 225 | Term Loan | 12/30/2028 | S+775 |
| Eroski Sociedad Cooperativa | 337 | Term Loan | 2/1/2028 | – |
| Highpeak Energy Inc. | – | Term Loan | 9/29/2028 | – |
| ITG Communications | – | Term Loan | 7/1/2031 | S+475 |
| Turkiye Garanti Bankasi AS | 143 | Term Loan | 12/6/2024 | E+325 |
| ISBANK | 331 | Term Loan | 11/19/2023 | E+400 |
| Arab Rep Egypt | 976 | Term Loan | 12/25/2027 | – |
| Denizbank AS | 134 | Term Loan | 11/30/2026 | E+125 |
| Al Rajhi Banking and Investment Corp. | 1430 | Term Loan | 8/25/2026 | – |
| Phenna Group | 890 | Term Loan | 6/19/2031 | E+325 |
Largest Loans
Highlights the monthly price movements and quote depth for the 20 largest bank loans between 12/1/25 – 12/31/25
| RANK | SIZE (MM) | NAME | CHANGE | PRC | PRC-1M | DEALERS |
|---|---|---|---|---|---|---|
| 1 | 6,272 | UKG INC (USD) TL S+250 2/9/2031 | 0.16% | 100.06 | 99.90 | 19 |
| 2 | 6,145 | MAGNOLIA (USD) TL L+375 2/1/2028 | 5.39% | 92.51 | 87.78 | 13 |
| 3 | 5,621 | SOLAREDGE TECHS INC (USD) TL B S+250 7/31/2031 | 0.17% | 100.30 | 100.14 | 12 |
| 4 | 5,500 | DAYFORCE INC (USD) TL B S+300 10/7/2032 | -0.75% | 99.62 | 100.38 | 19 |
| 5 | 5,080 | ALLIED UNIVERSAL HOLDCO LLC (USD) TL B S+325 8/5/2032 | 11.26% | 100.44 | 90.28 | 18 |
| 6 | 4,741 | INTERNET BRANDS (USD) TL B3 S+425 4/20/2028 | -7.61% | 92.74 | 100.38 | 13 |
| 7 | 4,664 | PROOFPOINT (USD) TL B S+300 8/31/2028 | 0.32% | 100.38 | 100.05 | 15 |
| 8 | 4,230 | TK ELEVATOR (US) NEWCO INC TL B | 0.07% | 100.63 | 100.56 | 16 |
| 9 | 4,204 | JANE STREET (USD) TL B S+200 12/10/2031 | 0.47% | 99.47 | 99.00 | 16 |
| 10 | 4,074 | MEDLINE BORROWER LP (USD) TL B S+200 10/23/2028 | 0.26% | 100.25 | 99.99 | 10 |
| 11 | 4,001 | CITADEL (USD) TL B S+200 10/28/2031 | 0.36% | 100.48 | 100.13 | 15 |
| 12 | 3,935 | SS&C TECHS INC (USD) TL B8 S+200 5/2/2031 | 0.18% | 100.53 | 100.35 | 12 |
| 13 | 3,914 | BROADSTREET PARTNERS INC (USD) TL B S+275 6/16/2031 | -0.15% | 100.27 | 100.41 | 17 |
| 14 | 3,830 | ALLIANT HLDGS INTERMEDIATE LLC (USD) TL B S+250 9/19/2031 | -0.01% | 100.24 | 100.25 | 18 |
| 15 | 3,736 | UFC (USD) TL B5 S+200 11/21/2031 | 0.41% | 100.41 | 100.00 | 15 |
| 16 | 3,640 | TRANSDIGM INC (USD) TL J S+250 2/12/2031 | 0.05% | 100.31 | 100.26 | 15 |
| 17 | 3,600 | GLOBAL MEDICAL RESPONSE INC (USD) TL S+350 9/10/2032 | 0.23% | 100.36 | 100.13 | 14 |
| 18 | 3,573 | CDK GLOBAL (USD) TL B S+325 7/6/2029 | -15.88% | 84.54 | 100.50 | 13 |
| 19 | 3,500 | MEDLINE BORROWER LP (USD) TL B S+200 10/21/2030 | 21.19% | 100.29 | 82.75 | 12 |
| 20 | 3,488 | FERTITTA ENTERTAINMENT LLC (USD) TL B S+325 1/27/2029 | -0.10% | 99.96 | 100.06 | 18 |
| AVERAGE | 4,387 | 0.80% | 98.69 | 98.16 | 15.0 |
Top 10 Outperformers
Showcases the top 10 loan “outperformers” based on the largest bid price increases between 12/1/25 – 12/31/25
| RANK | NAME | CHANGE | PRC | PRC-1M | DEALERS |
|---|---|---|---|---|---|
| 1 | MAGNOLIA (USD) 2L TL S+775 2/1/2029 | 49.73% | 78.14 | 52.19 | 8 |
| 2 | PRETIUM PACKAGING (USD) 2ND OUT TL A1 S+460 10/2/2028 | 19.63% | 39.35 | 32.90 | 11 |
| 3 | LESLIE’S POOLMART (USD) TL B L+275 3/9/2028 | 10.45% | 45.39 | 41.10 | 12 |
| 4 | INTERNET BRANDS (USD) 2L TL L+625 2/23/2029 | 10.35% | 83.64 | 75.80 | 11 |
| 5 | INTERIOR LOGIC (USD) TL B L+350 4/3/2028 | 6.43% | 71.16 | 66.87 | 12 |
| 6 | HOUGHTON MIFFLIN (USD) TL B S+525 4/9/2029 | 5.76% | 87.83 | 83.05 | 10 |
| 7 | ASURION (USD) 2L TL B4 L+525 1/20/2029 | 4.93% | 98.02 | 93.41 | 10 |
| 8 | AMEDES GROUP (EUR) TL B E+375 10/12/2028 | 4.78% | 84.68 | 80.81 | 15 |
| 9 | APEX GROUP TRSY LLC (USD) TL B S+350 2/20/2032 | 4.54% | 93.81 | 89.74 | 6 |
| 10 | LABEYRIE (EUR) TL B E+500 7/31/2029 | 3.97% | 92.71 | 89.17 | 14 |
Top 10 Underperformers
Showcases the top 10 loan “underperformers” based on the largest bid price decreases between 12/1/25 – 12/31/25
| RANK | NAME | CHANGE | PRC | PRC-1M | DEALERS |
|---|---|---|---|---|---|
| 1 | TORRID (USD) TL B L+550 6/14/2028 | -51.08% | 39.39 | 80.52 | 10 |
| 2 | SONICWALL (USD) TL B S+500 5/15/2028 | -26.33% | 64.30 | 87.28 | 11 |
| 3 | MHS HOLDINGS (USD) TL B S+550 6/12/2029 | -17.07% | 63.92 | 77.07 | 7 |
| 4 | OXEA (USD) PIK TL B2 4/8/2031 | -15.77% | 74.61 | 88.58 | 5 |
| 5 | EKATERRA (GBP) TL B SN+562.5 7/30/2029 | -14.34% | 72.24 | 84.33 | 11 |
| 6 | CAST & CREW (USD) TL S+375 12/29/2028 | -13.97% | 58.01 | 67.43 | 6 |
| 7 | SKILLSOFT (USD) TL B S+525 7/16/2028 | -13.07% | 70.89 | 81.55 | 8 |
| 8 | RACKSPACE TECH GLOBAL INC (USD) 2ND OUT TL B S+275 5/15/2028 | -11.65% | 36.01 | 40.76 | 13 |
| 9 | MONEYGRAM INTL INC (USD) TL B S+475 6/1/2030 | -9.92% | 65.63 | 72.85 | 8 |
| 10 | ENTERTAINMENT PARTNERS (USD) TL B S+450 11/6/2028 | -9.92% | 71.57 | 79.45 | 10 |
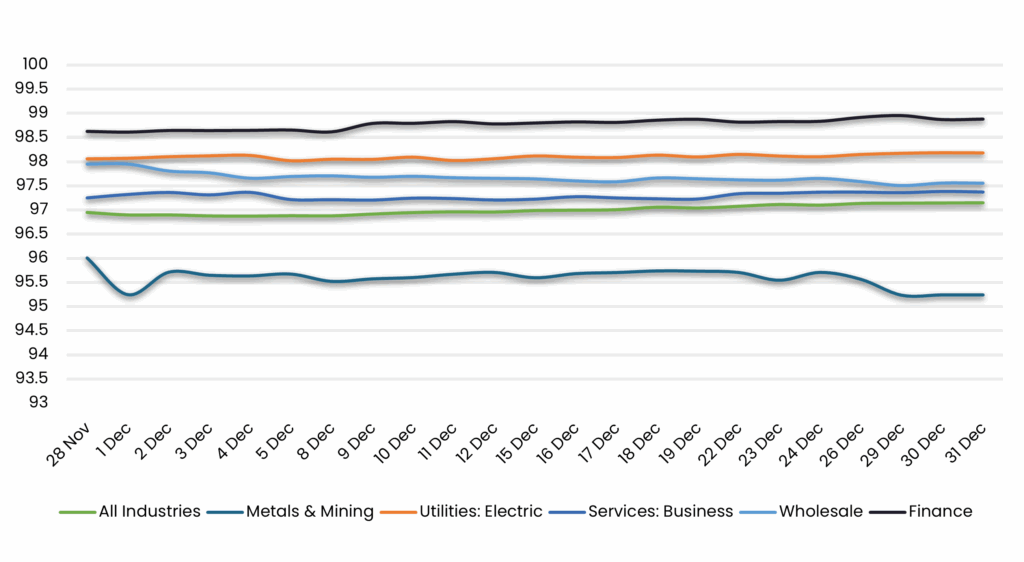
Avg Bid PX by Sector
Displays the average loan bid price by sector between 12/1/25 – 12/31/25 Results are based on 5 select industry sectors, however, we offer data across 36 sectors
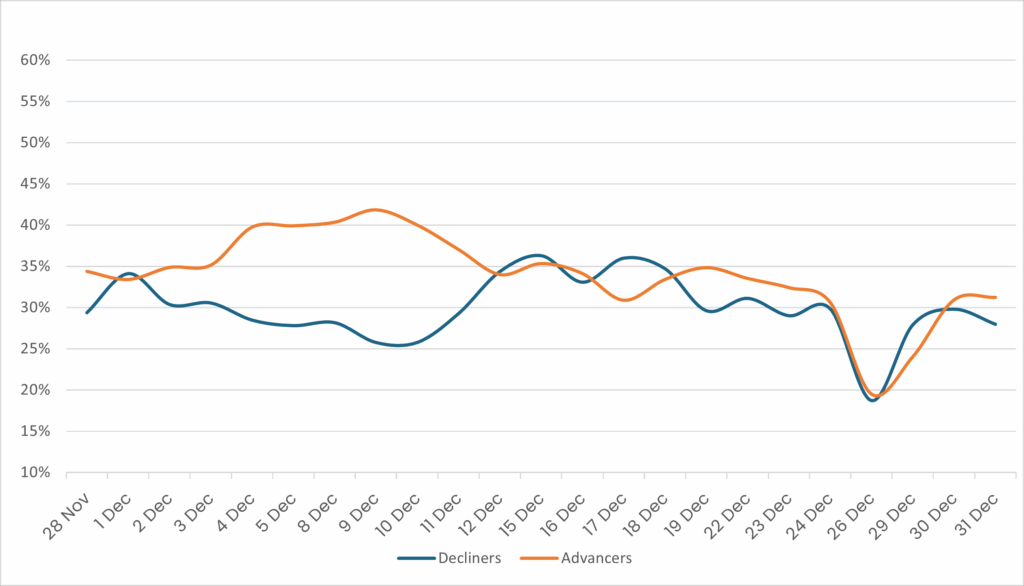
Sentiment
Reveals the percent of loans increasing in price (advancers) vs. loans decreasing in price (decliners) between 12/1/25 – 12/31/25
Top Quote Volume Movers: This Month vs Last Month
Exhibits the loans with the largest increase in quote volume for the month ending 11/30/24 vs. the month ending 12/31/25
| RANK | TRANCHE | PRIOR MONTH | THIS MONTH | INCREASE | % INCREASE |
|---|---|---|---|---|---|
| 1 | DAYFORCE INC (USD) TL B S+300 10/7/2032 | 140 | 474 | 334 | 239% |
| 2 | SPECIALTY BLDG PRODUCTS HLDGS LLC (USD) TL B L+375 10/15/2028 | 178 | 419 | 241 | 135% |
| 3 | MADISON IAQ LLC (USD) TL S+275 11/8/2032 | 194 | 403 | 209 | 108% |
| 4 | UKG INC (USD) TL S+250 2/9/2031 | 328 | 520 | 192 | 59% |
| 5 | MADISON IAQ LLC (USD) TL B S+300 6/21/2028 | 234 | 407 | 173 | 74% |
| 6 | CIENA CORP (USD) TL B S+175 10/24/2030 | 16 | 184 | 168 | 1050% |
| 7 | UFC (USD) TL B5 S+200 11/21/2031 | 269 | 433 | 164 | 61% |
| 8 | QXO INC (USD) TL B S+200 4/30/2032 | 42 | 204 | 162 | 386% |
| 9 | HUB INTL LTD (USD) TL B S+250 6/20/2030 | 356 | 498 | 142 | 40% |
| 10 | REALPAGE INC (USD) TL B S+375 4/24/2028 | 319 | 453 | 134 | 42% |
Most Quoted Loans
Ranks the loans that were quoted by the highest number of dealers between 12/1/25 – 12/31/25
| RANK | TRANCHE | DEALERS |
|---|---|---|
| 1 | WHITE CAP BUYER LLC (USD) TL B S+325 10/19/2029 | 20 |
| 2 | HUB INTL LTD (USD) TL B S+250 6/20/2030 | 20 |
| 3 | UKG INC (USD) TL S+250 2/9/2031 | 19 |
| 4 | EMRLD BORROWER LP (USD) TL B S+225 5/31/2030 | 19 |
| 5 | WHATABURGER (USD) TL B S+250 8/3/2028 | 19 |
| 6 | DAYFORCE INC (USD) TL B S+300 10/7/2032 | 19 |
| 7 | FERTITTA ENTERTAINMENT LLC (USD) TL B S+325 1/27/2029 | 18 |
| 8 | ALLIANT HLDGS INTERMEDIATE LLC (USD) TL B S+250 9/19/2031 | 18 |
| 9 | ALLIED UNIVERSAL HOLDCO LLC (USD) TL B S+325 8/5/2032 | 18 |
| 10 | CULLIGAN (USD) TL B S+325 7/30/2028 | 18 |
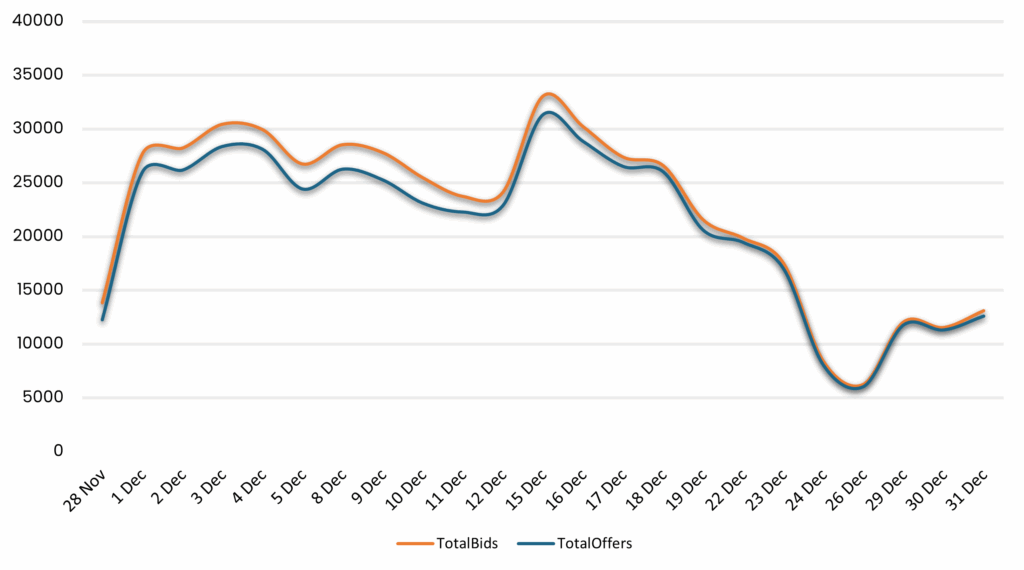
Bid and Offer Volume
Reveals the total number of quotes by bid and offer between 12/1/25 – 12/31/25
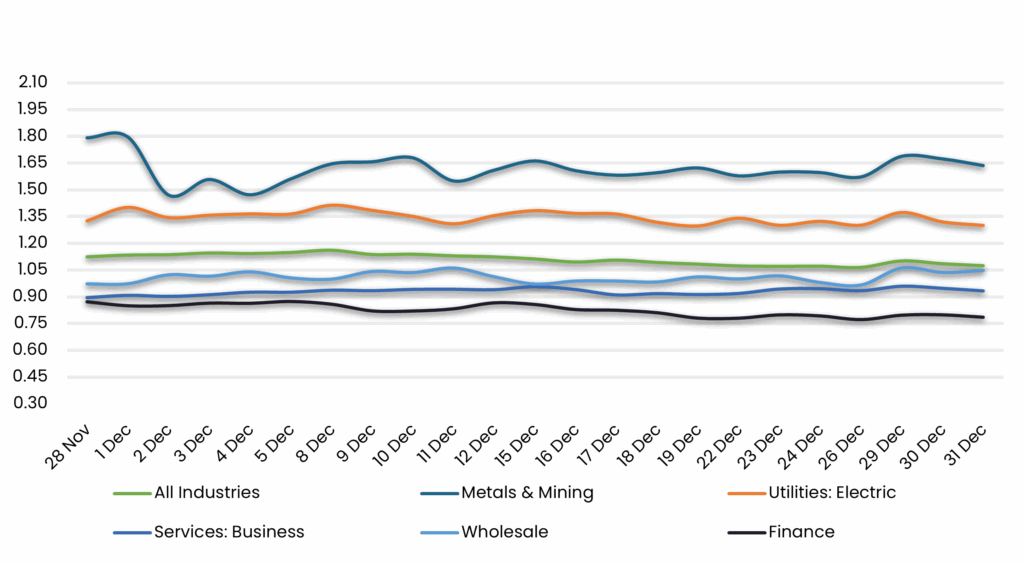
Sector Bid-Offer Spread
Displays the bid-offer spread by sector between 12/1/25 – 12/31/25 Results are based on 5 select industry sectors, however, we offer data across 36 sectors
Stay up-to-date with weekly summaries.
Related Resources
About SOLVE
SOLVE is the leading market data platform provider for fixed-income securities, trusted by sophisticated buy-side and sell-side firms worldwide. Founded in 2011, SOLVE leverages its AI-driven technology and deep industry expertise to offer unparalleled transparency into markets, reduce risk, and save hundreds of hours across front-office workflows. With the largest real-time datasets for Securitized Products, Municipal Bonds, Corporate Bonds, Syndicated Bank Loans, Convertible Bonds, CDS, and Private Credit, SOLVE empowers clients to transform the way they bring new securities to market, trade on secondary markets, and value highly illiquid securities. Headquartered in Connecticut, with offices across the globe, SOLVE is the definitive source for market pricing in fixed-income markets.
