High Yield CDS Market Summary – December 2025
GET OUR CDS MARKET SUMMARIES STRAIGHT TO YOUR INBOX. LEARN MORE
High Yield CDS Market Summary: December 2025
Our newsletter presents key trends derived from observable Credit Default Swaps pricing data over a monthly period.
Top 10 Outperformers
Showcases the top 10 HY CDS “outperformers” based on the largest mid spread decreases between 12/1/25 – 12/31/25
| RANK | BOND NAME | ISSUER | % CHANGE | BPS CHANGE | SPRD | SPRD-1 MONTH | DEALERS |
|---|---|---|---|---|---|---|---|
| 1 | ASH 5Y | ASHLAND GLOBAL HOLDINGS | -18.6% | -21 | 92 | 113 | 3 |
| 2 | MBIA_AA 5Y | MBIA INC | -17.3% | -31 | 149 | 180 | 3 |
| 3 | CECGR 5Y | CECONOMY AG | -17.1% | -19 | 94 | 114 | 3 |
| 4 | MGM 5Y | MGM RESORTS INTERNATIONAL | -11.7% | -22 | 168 | 191 | 3 |
| 5 | IPGIM 5Y | SALINI IMPREGILO | -11.1% | -19 | 149 | 168 | 3 |
| 6 | PBI 5Y | CIBA GEIGY CORP | -10.6% | -22 | 188 | 210 | 3 |
| 7 | GVCLN 5Y | GVC CORP | -9.9% | -16 | 150 | 167 | 3 |
| 8 | DAL 5Y | DELTA AIR LINES INC | -9.6% | -10 | 94 | 104 | 4 |
| 9 | MUR 5Y | MURPHY OIL CORP | -9.4% | -17 | 167 | 184 | 3 |
| 10 | SCFER HOLDCO 5Y | SCHAEFFLER FINANCE BV | -9.1% | -15 | 148 | 163 | 3 |
Top 10 Underperformers
Showcases the top 10 HY CDS “underperformers” based on the largest mid spread increases between 12/1/25 – 12/31/25
| RANK | BOND NAME | ISSUER | % CHANGE | BPS CHANGE | SPREAD | SPREAD-1 MONTH | DEALERS |
|---|---|---|---|---|---|---|---|
| 1 | LW 5Y | LAMB WESTON | 22.9% | 23 | 122 | 99 | 3 |
| 2 | SEE 5Y | SEALED AIR CORP NEW | 12.9% | 32 | 278 | 246 | 4 |
| 3 | SCFER 5Y | SCHAEFFLER FINANCE BV | 12.1% | 14 | 131 | 117 | 3 |
| 4 | KBH 5Y | KB HOME | 7.4% | 10 | 147 | 137 | 4 |
| 5 | ZEGLN 5Y | ZEGONA FINANCE | 6.5% | 7 | 115 | 108 | 3 |
| 6 | PICSUR 5Y | PICARD SURGELES SA | 4.7% | 5 | 119 | 114 | 3 |
| 7 | HOV 5Y | HOVNANIAN K ENTERPRISES INC | 3.5% | 11 | 317 | 307 | 3 |
| 8 | HPLGR 5Y | HAPAG-LLOYD A G | 2.7% | 5 | 187 | 182 | 3 |
| 9 | SAIBV 5Y | SAIPEM FINANCE INTERNATIONAL BV | 2.7% | 3 | 114 | 111 | 3 |
| 10 | BBWI 5Y | BATH & BODY WORKS | 2.4% | 5 | 210 | 205 | 3 |
Normalized HY Spread by Region
Displays the HY CDS spread by region between 12/1/25 – 12/31/25 Results are based on select regions, however, we offer data across 12 regions
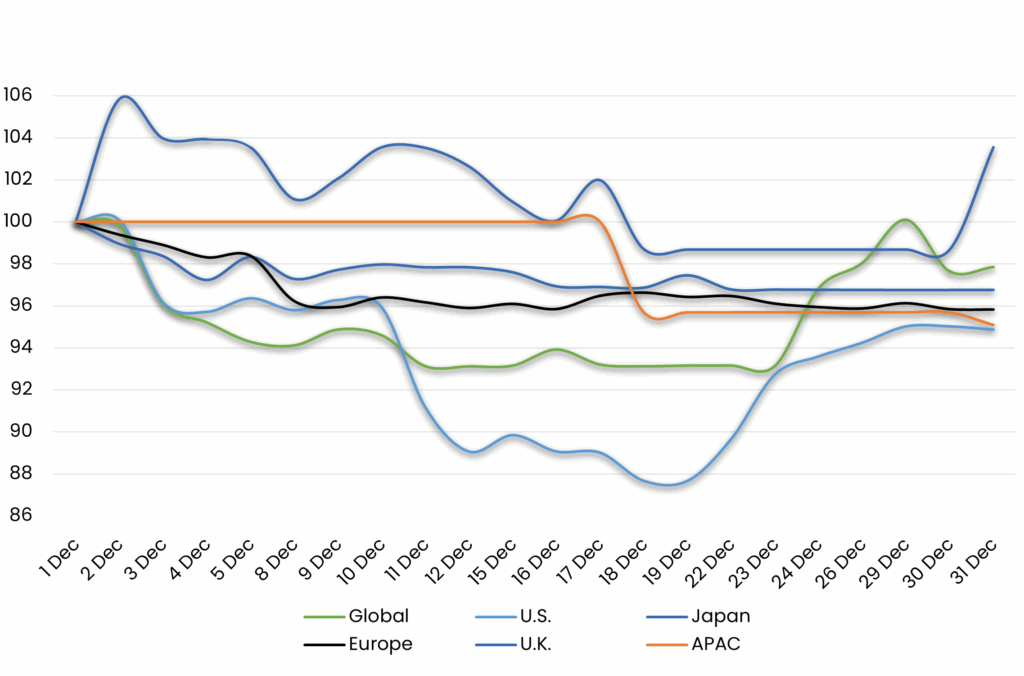
HY Spread by Region – Monthly Comparison
Exhibits the HY mid spread by region for the month ending 11/30/25 vs. the month ending 12/31/25
| REGION | PREVIOUS SPREAD | CURRENT SPREAD | BPS CHANGE | MONTHLY PERFORMANCE | CDS COUNT |
|---|---|---|---|---|---|
| Global | 134 | 131 | -3 | Tighter | 0 |
| U.S. | 129 | 122 | -7 | Tighter | 0 |
| Japan | 66 | 64 | -2 | Tighter | 0 |
| Europe | 151 | 145 | -6 | Tighter | 0 |
| U.K. | 99 | 102 | 4 | Wider | 0 |
| APAC | 250 | 238 | -12 | Tighter | 0 |
Normalized HY Spread by Industry
Displays the HY CDS spread by industry between 12/1/25 – 12/31/25 Results are based on select industry sectors, however, we offer data across 36 sectors
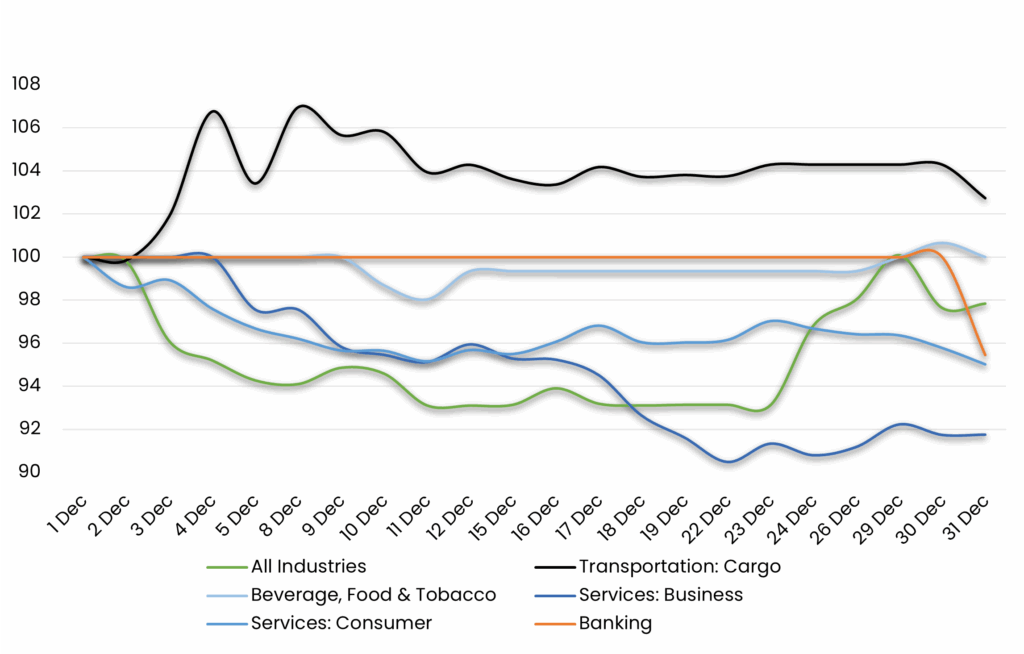
HY Spread by Industries – Monthly Comparison
Exhibits the HY spread by industry for the month ending 11/30/25 vs. the month ending 12/31/25
| INDUSTRIES | PREVIOUS SPREAD | CURRENT SPREAD | BPS CHANGE | MONTHLY PERFORMANCE | CDS COUNT |
|---|---|---|---|---|---|
| All Industries | 134 | 131 | -3 | Tighter | 190.00 |
| Transportation: Cargo | 182 | 187 | 5 | Wider | 3.00 |
| Beverage, Food & Tobacco | 152 | 152 | 0 | Unchanged | 7.00 |
| Services: Business | 205 | 188 | -17 | Tighter | 3.00 |
| Services: Consumer | 148 | 141 | -7 | Tighter | 4.00 |
| Banking | 55 | 53 | -3 | Tighter | 1.00 |
Stay up-to-date with monthly summaries.
Related Resources
About SOLVE
SOLVE is the leading market data platform provider for fixed-income securities, trusted by sophisticated buy-side and sell-side firms worldwide. Founded in 2011, SOLVE leverages its AI-driven technology and deep industry expertise to offer unparalleled transparency into markets, reduce risk, and save hundreds of hours across front-office workflows. With the largest real-time datasets for Securitized Products, Municipal Bonds, Corporate Bonds, Syndicated Bank Loans, Convertible Bonds, CDS, and Private Credit, SOLVE empowers clients to transform the way they bring new securities to market, trade on secondary markets, and value highly illiquid securities. Headquartered in Connecticut, with offices across the globe, SOLVE is the definitive source for market pricing in fixed-income markets.
