Municipal Bond Market Summary – Week Ending 12/26/25
Our newsletter presents key trends derived from observable Municipal Bond pricing data over a weekly period.
Top 10 Performers
Showcases the top 10 Muni Bond performers based on price movements between 12/19/25-12/26/25
| Rank | Bond Name | Coupon | Maturity | Change | PRC | PRC-1W | Dealers |
| 1 | VA CLG BLDG AUTH-REV- | 3.000% | 01/01/40 | ▲ 2.49% | 84.70 | 82.64 | 5 |
| 2 | IL ST FIN AUTH | 3.250% | 05/15/39 | ▲ 2.40% | 88.26 | 86.19 | 2 |
| 3 | PASSAIC VLY SEWAGE-J | 3.000% | 12/01/39 | ▲ 2.18% | 90.25 | 88.32 | 2 |
| 4 | WEST SHORE SCH DT | 4.375% | 11/15/52 | ▲ 2.16% | 97.16 | 95.11 | 2 |
| 5 | NEW YORK CITY NY HSG | 3.950% | 11/15/44 | ▲ 2.15% | 93.87 | 91.90 | 3 |
| 6 | LEBANON CNTY | 3.000% | 10/15/36 | ▲ 1.84% | 93.78 | 92.08 | 2 |
| 7 | AUTH IMPT MUNIS PA UN | 5.000% | 11/01/53 | ▲ 1.81% | 61.77 | 60.67 | 3 |
| 8 | LA VERNIA ISD | 4.125% | 02/15/48 | ▲ 1.81% | 97.70 | 95.96 | 2 |
| 9 | LOS ANGELES CA MUNI I | 2.863% | 11/01/41 | ▲ 1.71% | 72.94 | 71.71 | 2 |
| 10 | QUINCY-MUNI PURP | 3.125% | 06/15/43 | ▲ 1.65% | 82.98 | 81.64 | 2 |
Bottom 10 Performers
Showcases the bottom 10 Muni Bond performers based on price movements between 12/19/25-12/26/25
| Rank | Bond Name | Coupon | Maturity | Change | PRC | PRC-1W | Dealers |
| 1 | MONTGOMERY CNTY AGM | 4.000% | 09/01/44 | ▼ -2.74% | 91.82 | 94.41 | 3 |
| 2 | MO ST HLTH & EDU FACS | 4.000% | 10/01/48 | ▼ -2.72% | 91.92 | 94.49 | 2 |
| 3 | MINNESOTA FIN AGY-B | 4.250% | 08/01/47 | ▼ -2.53% | 95.70 | 98.18 | 3 |
| 4 | MANILA-REF | 4.000% | 09/01/35 | ▼ -1.76% | 102.49 | 104.33 | 2 |
| 5 | NORTH CAROLINA ST MED | 3.125% | 11/01/49 | ▼ -1.76% | 75.87 | 77.23 | 7 |
| 6 | CA STWD CMNTY-BAM | 4.000% | 08/01/45 | ▼ -1.72% | 95.41 | 97.08 | 6 |
| 7 | MA DEV FIN AGY-B-1 | 5.000% | 10/01/33 | ▼ -1.69% | 116.33 | 118.32 | 2 |
| 8 | FARGO-D-REF | 4.250% | 05/01/51 | ▼ -1.67% | 96.97 | 98.62 | 24 |
| 9 | ASHLAND | 3.500% | 12/01/48 | ▼ -1.65% | 81.04 | 82.40 | 2 |
| 10 | NEW HAMPSHIRE-2-REV | 2.450% | 07/01/50 | ▼ -1.62% | 63.71 | 64.76 | 2 |
Top 10 State Performers
Showcases the top 10 Muni State performers based on yield movements between 12/19/25-12/26/25
| Rank | State | Change | YLD | YLD-1W |
| 1 | HI | -15 bps | 3.15% | 3.30% |
| 2 | UT | -10 bps | 3.33% | 3.43% |
| 3 | NV | -10 bps | 3.39% | 3.49% |
| 4 | SC | -9 bps | 3.45% | 3.54% |
| 5 | ND | -8 bps | 3.34% | 3.43% |
| 6 | SD | -7 bps | 3.56% | 3.64% |
| 7 | CT | -7 bps | 3.39% | 3.46% |
| 8 | NJ | -6 bps | 3.46% | 3.52% |
| 9 | AL | -6 bps | 3.69% | 3.75% |
| 10 | AZ | -6 bps | 3.48% | 3.54% |
Bottom 10 State Performers
Showcases the bottom 10 Muni State performers based on yield movements between 12/19/25-12/26/25
| Rank | State | Change | YLD | YLD-1W |
| 1 | IN | 11 bps | 3.45% | 3.34% |
| 2 | DC | 9 bps | 3.57% | 3.48% |
| 3 | MT | 8 bps | 3.55% | 3.47% |
| 4 | CO | 5 bps | 3.45% | 3.39% |
| 5 | AK | 5 bps | 3.39% | 3.34% |
| 6 | GA | 5 bps | 3.26% | 3.21% |
| 7 | MN | 4 bps | 3.45% | 3.41% |
| 8 | KY | 4 bps | 3.51% | 3.48% |
| 9 | AR | 3 bps | 3.77% | 3.73% |
| 10 | VT | 3 bps | 3.28% | 3.25% |
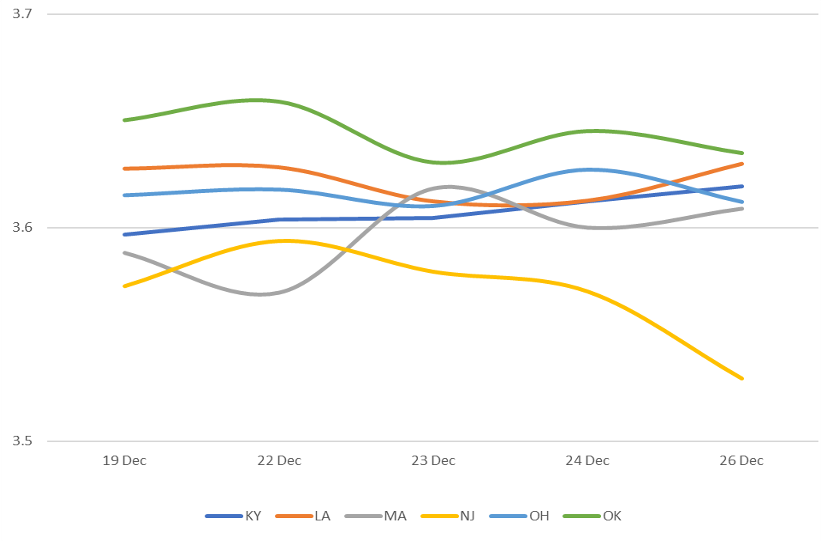
10 Year Yield by State – All
Displays the average Muni 10 year yield by state between 12/19/25-12/26/25 (General Obligation and Revenue Bonds) Results are based on 6 select states, however, we offer data across all 50 states and U.S. territories
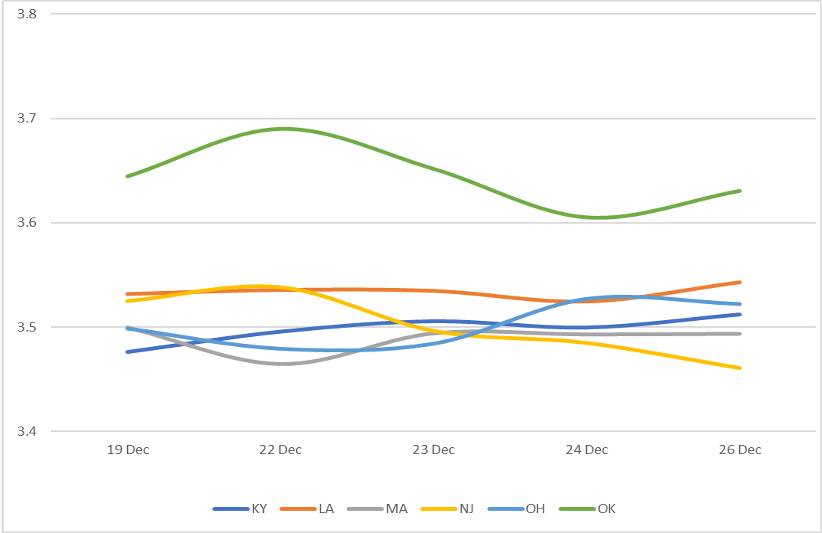
10 Year Yield by State – GO Only
Displays the average Muni 10 year yield by state between 12/19/25-12/26/25 (General Obligation Bonds only) Results are based on 6 select states, however, we offer data across all 50 states and U.S. territories
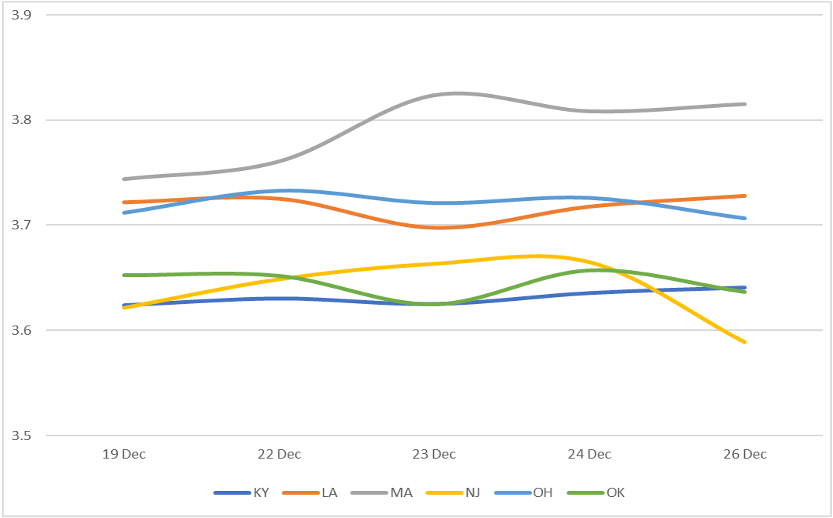
10 Year Yield by State – Rev Only
Displays the average Muni 10 year yield by state between 12/19/25-12/26/25 (Revenue Bonds only) Results are based on 6 select states, however, we offer data across all 50 states and U.S. territories
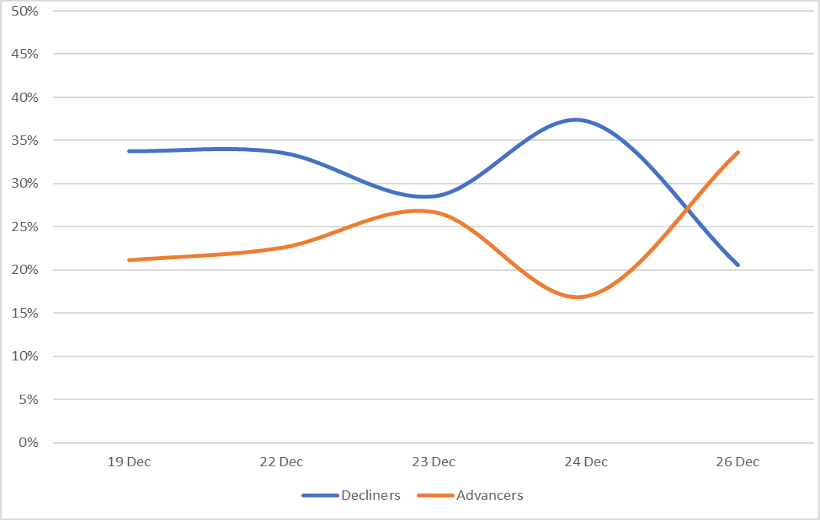
Sentiment
Reveals the percent of Muni bonds increasing in price (advancers) vs. decreasing in price (decliners) between 12/19/25-12/26/25
Top Quote Volume Movers: This Week vs Last Week
Exhibits the Munis with the largest increase in quote volume for the week ending 12/19/25 vs. the week ending 12/26/25
| Rank | Tranche | Coupon | Maturity | Prior Week | This Week | Increase | % Increase |
| 1 | PROSPER ISD-REF | 4.500% | 02/15/55 | 44 | 172 | 128 | 291% |
| 2 | PROSPER ISD-REF | 5.250% | 02/15/55 | 26 | 131 | 105 | 404% |
| 3 | PROSPER ISD-REF | 5.000% | 02/15/50 | 24 | 114 | 90 | 375% |
| 4 | PROSPER ISD-REF | 5.000% | 02/15/42 | 18 | 100 | 82 | 456% |
| 5 | PROSPER ISD-REF | 5.000% | 02/15/43 | 18 | 100 | 82 | 456% |
| 6 | MICHIGAN FIN AUTH-REF | 5.000% | 09/01/40 | 36 | 110 | 74 | 206% |
| 7 | CO HLTH CARE-A-REF | 5.000% | 09/01/32 | 24 | 97 | 73 | 304% |
| 8 | NEW HAVEN UNIF SD-A | 5.000% | 08/01/50 | 5 | 74 | 69 | 1380% |
| 9 | NY HSG DEV CORP-C-1 | 5.125% | 11/01/55 | 18 | 85 | 67 | 372% |
| 10 | WEEMS NEIGHBORHOOD MET DIST | 5.875% | 12/01/55 | 26 | 90 | 64 | 246% |
Most Quoted Munis
Ranks the Munis that were quoted by the highest number of dealers between 12/19/25-12/26/25
| Rank | Tranche | Coupon | Maturity | Dealers |
| 1 | MIAMI-DADE CO-A | 4.500% | 10/01/51 | 55 |
| 2 | MIAMI-DADE CO-A | 5.000% | 10/01/55 | 51 |
| 3 | NY TRANSITIONAL FIN-B | 5.000% | 05/01/51 | 51 |
| 4 | SAN DIEGO UNIF SD-C-3 | 5.000% | 07/01/50 | 50 |
| 5 | CHICAGO-E-REV-AMT | 5.000% | 01/01/60 | 50 |
| 6 | SER C-REF | 5.000% | 06/01/34 | 49 |
| 7 | TX WTR DEV BRD | 4.750% | 10/15/55 | 47 |
| 8 | BATTERY PARK-REF | 5.250% | 11/01/55 | 44 |
| 9 | AUSTIN ELEC UTIL-REF | 5.000% | 11/15/55 | 44 |
| 10 | LOS ANGELES MUN-A | 5.250% | 05/01/50 | 43 |
Related Resources
About SOLVE
SOLVE is the leading market data platform provider for fixed-income securities, trusted by sophisticated buy-side and sell-side firms worldwide. Founded in 2011, SOLVE leverages its AI-driven technology and deep industry expertise to offer unparalleled transparency into markets, reduce risk, and save hundreds of hours across front-office workflows. With the largest real-time datasets for Securitized Products, Municipal Bonds, Corporate Bonds, Syndicated Bank Loans, Convertible Bonds, CDS, and Private Credit, SOLVE empowers clients to transform the way they bring new securities to market, trade on secondary markets, and value highly illiquid securities. Headquartered in Connecticut, with offices across the globe, SOLVE is the definitive source for market pricing in fixed-income markets.
