Investment Grade CDS Market Summary – May 2024
GET OUR CDS MARKET SUMMARIES STRAIGHT TO YOUR INBOX. LEARN MORE
Investment Grade CDS Market may 2024
Our newsletter presents key trends derived from observable Credit Default Swaps pricing data over a monthly period.
Top 10 Outperformers
Showcases the top 10 IG CDS “outperformers” based on the largest mid spread decreases between 5/1/24 – 5/31/24
| RANK | BOND NAME | ISSUER | % CHANGE | BPS CHANGE | SPRD | SPRD-1 MONTH | DEALERS |
|---|---|---|---|---|---|---|---|
| 1 | MRO 5Y | MARATHON GLOBAL FDG CORP | -51.9% | -62 | 58 | 120 | 3 |
| 2 | USB 5Y | FBS CAP I | -26.6% | -19 | 51 | 70 | 3 |
| 3 | AVT 5Y | AVNET INC | -22.8% | -19 | 66 | 86 | 4 |
| 4 | TRPCN 5Y | ANR PIPELINE CO | -17.2% | -11 | 52 | 63 | 5 |
| 5 | FREGR 5Y | FRESENIUS SE & CO KGAA | -17.2% | -14 | 66 | 80 | 3 |
| 6 | ARNC 5Y | ALCOA INC | -16.2% | -11 | 58 | 69 | 4 |
| 7 | BWA 5Y | BORGWARNER INC | -16.1% | -12 | 62 | 74 | 4 |
| 8 | HAOHUA 5Y | CNAC CENTURY HK CO LTD | -16.1% | -16 | 82 | 98 | 3 |
| 9 | ARW 5Y | ARROW ELECTRONICS INC | -15.4% | -12 | 65 | 77 | 5 |
| 10 | MS 5Y | MORGAN STANLEY | -15.1% | -9 | 51 | 60 | 4 |
Top 10 Underperformers
Showcases the top 10 IG CDS “underperformers” based on the largest mid spread increases between 5/1/24 – 5/31/24
| RANK | BOND NAME | ISSUER | % CHANGE | BPS CHANGE | SPRD | SPRD-1 MONTH | DEALERS |
|---|---|---|---|---|---|---|---|
| 1 | GOOG 5Y | GOOGLE LLC | 32.0% | 9 | 38 | 29 | 2 |
| 2 | OPTUS 5Y | SINGAPORE TELECOMMUNICATIONS | 23.0% | 10 | 51 | 42 | 3 |
| 3 | CVS 5Y | CVS CAREMARK CORP | 21.5% | 10 | 58 | 48 | 5 |
| 4 | TGT 5Y | DAYTON HUDSON CORP MEDIUM TERM | 20.1% | 6 | 37 | 31 | 5 |
| 5 | EXPE 5Y | EXPEDIA INC | 19.3% | 14 | 89 | 75 | 6 |
| 6 | SO 5Y | ALABAMA PWR CAP TR IV | 13.8% | 4 | 36 | 32 | 6 |
| 7 | DIS 5Y | CAPITAL CITIES ABC FIN INC | 11.7% | 4 | 38 | 34 | 5 |
| 8 | BAX 5Y | BAXTER INTL INC | 11.0% | 7 | 71 | 64 | 6 |
| 9 | MPC 5Y | MPC LLC | 8.3% | 4 | 52 | 48 | 5 |
| 10 | FDX 5Y | FEDERAL EXPRESS CORP | 7.5% | 3.3 | 48 | 44 | 6 |
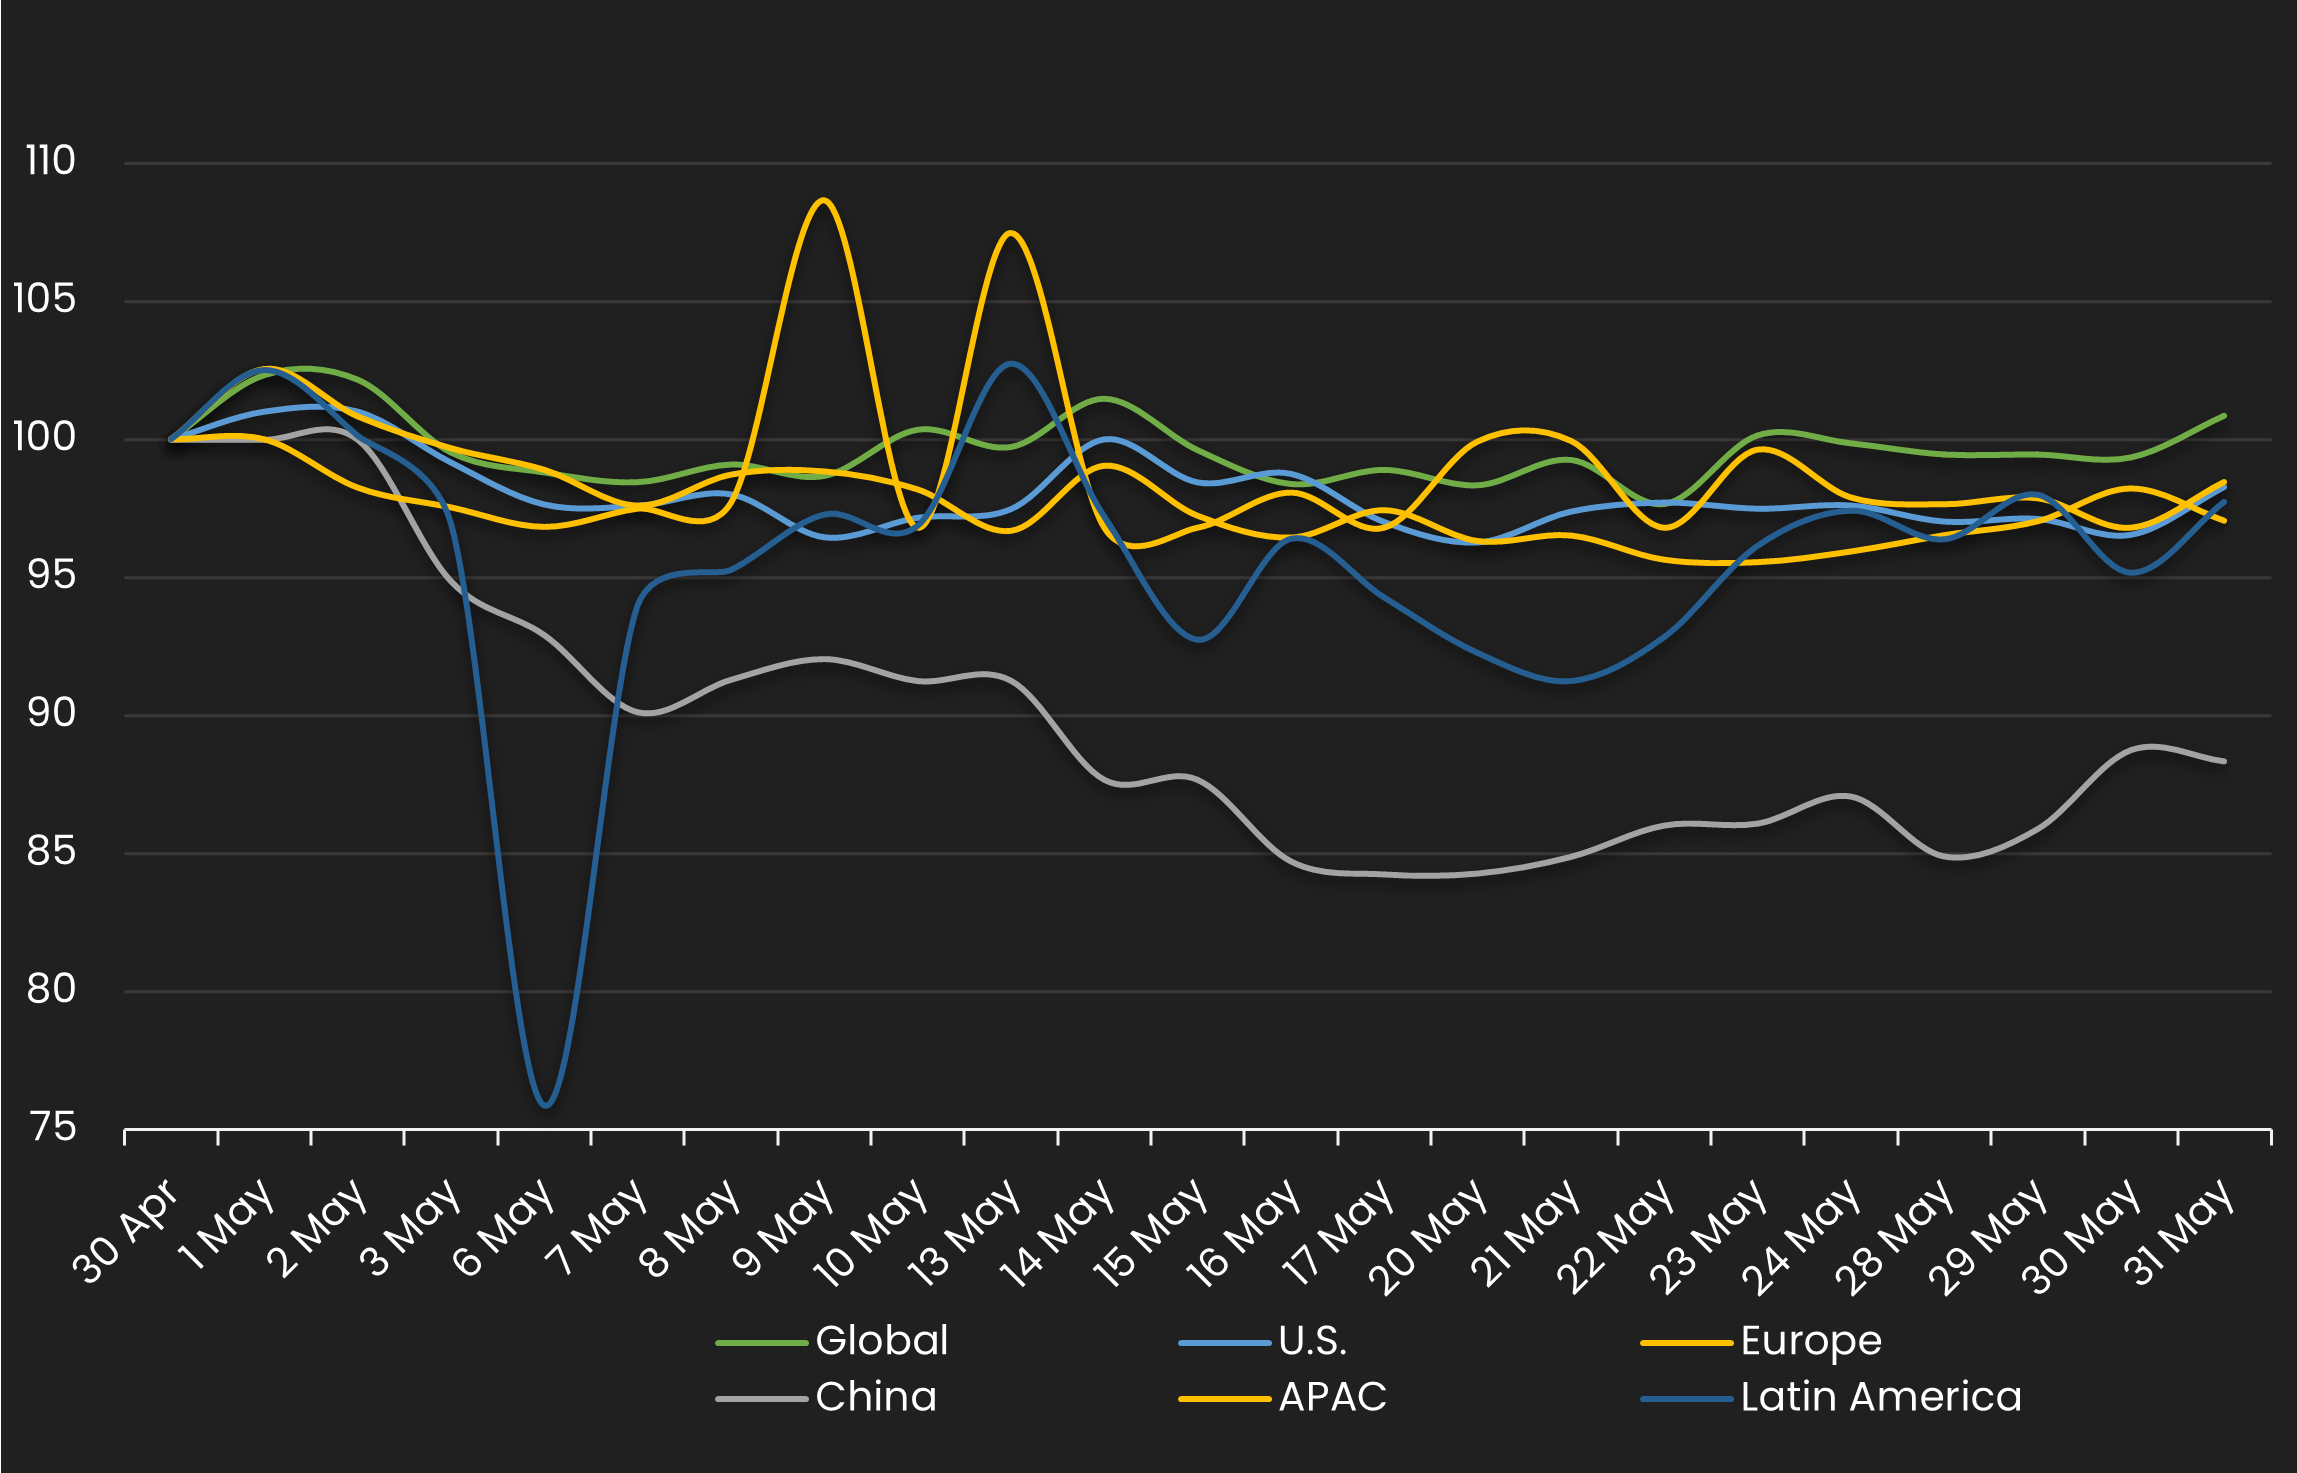
Normalized IG Spread by Region
Displays the IG CDS spread by region between 5/1/24 – 5/31/24 Results are based on 5 select regions, however, we offer data across 12 regions
IG Spread by Region – Monthly Comparison
Exhibits the IG mid spread by region for the month ending 4/30/23 vs. the month ending 5/31/24
| REGION | PREVIOUS SPREAD | CURRENT SPREAD | BPS CHANGE | MONTHLY PERFORMANCE | CDS COUNT |
|---|---|---|---|---|---|
| Global | 48 | 49 | 0 | Wider | 608 |
| U.S. | 50 | 49 | -1 | Tighter | 248 |
| Europe | 47 | 45 | -1 | Tighter | 158 |
| China | 74 | 66 | -9 | Tighter | 9 |
| APAC | 47 | 46 | -1 | Tighter | 45 |
| Latin America | 96 | 94 | -2 | Tighter | 9 |
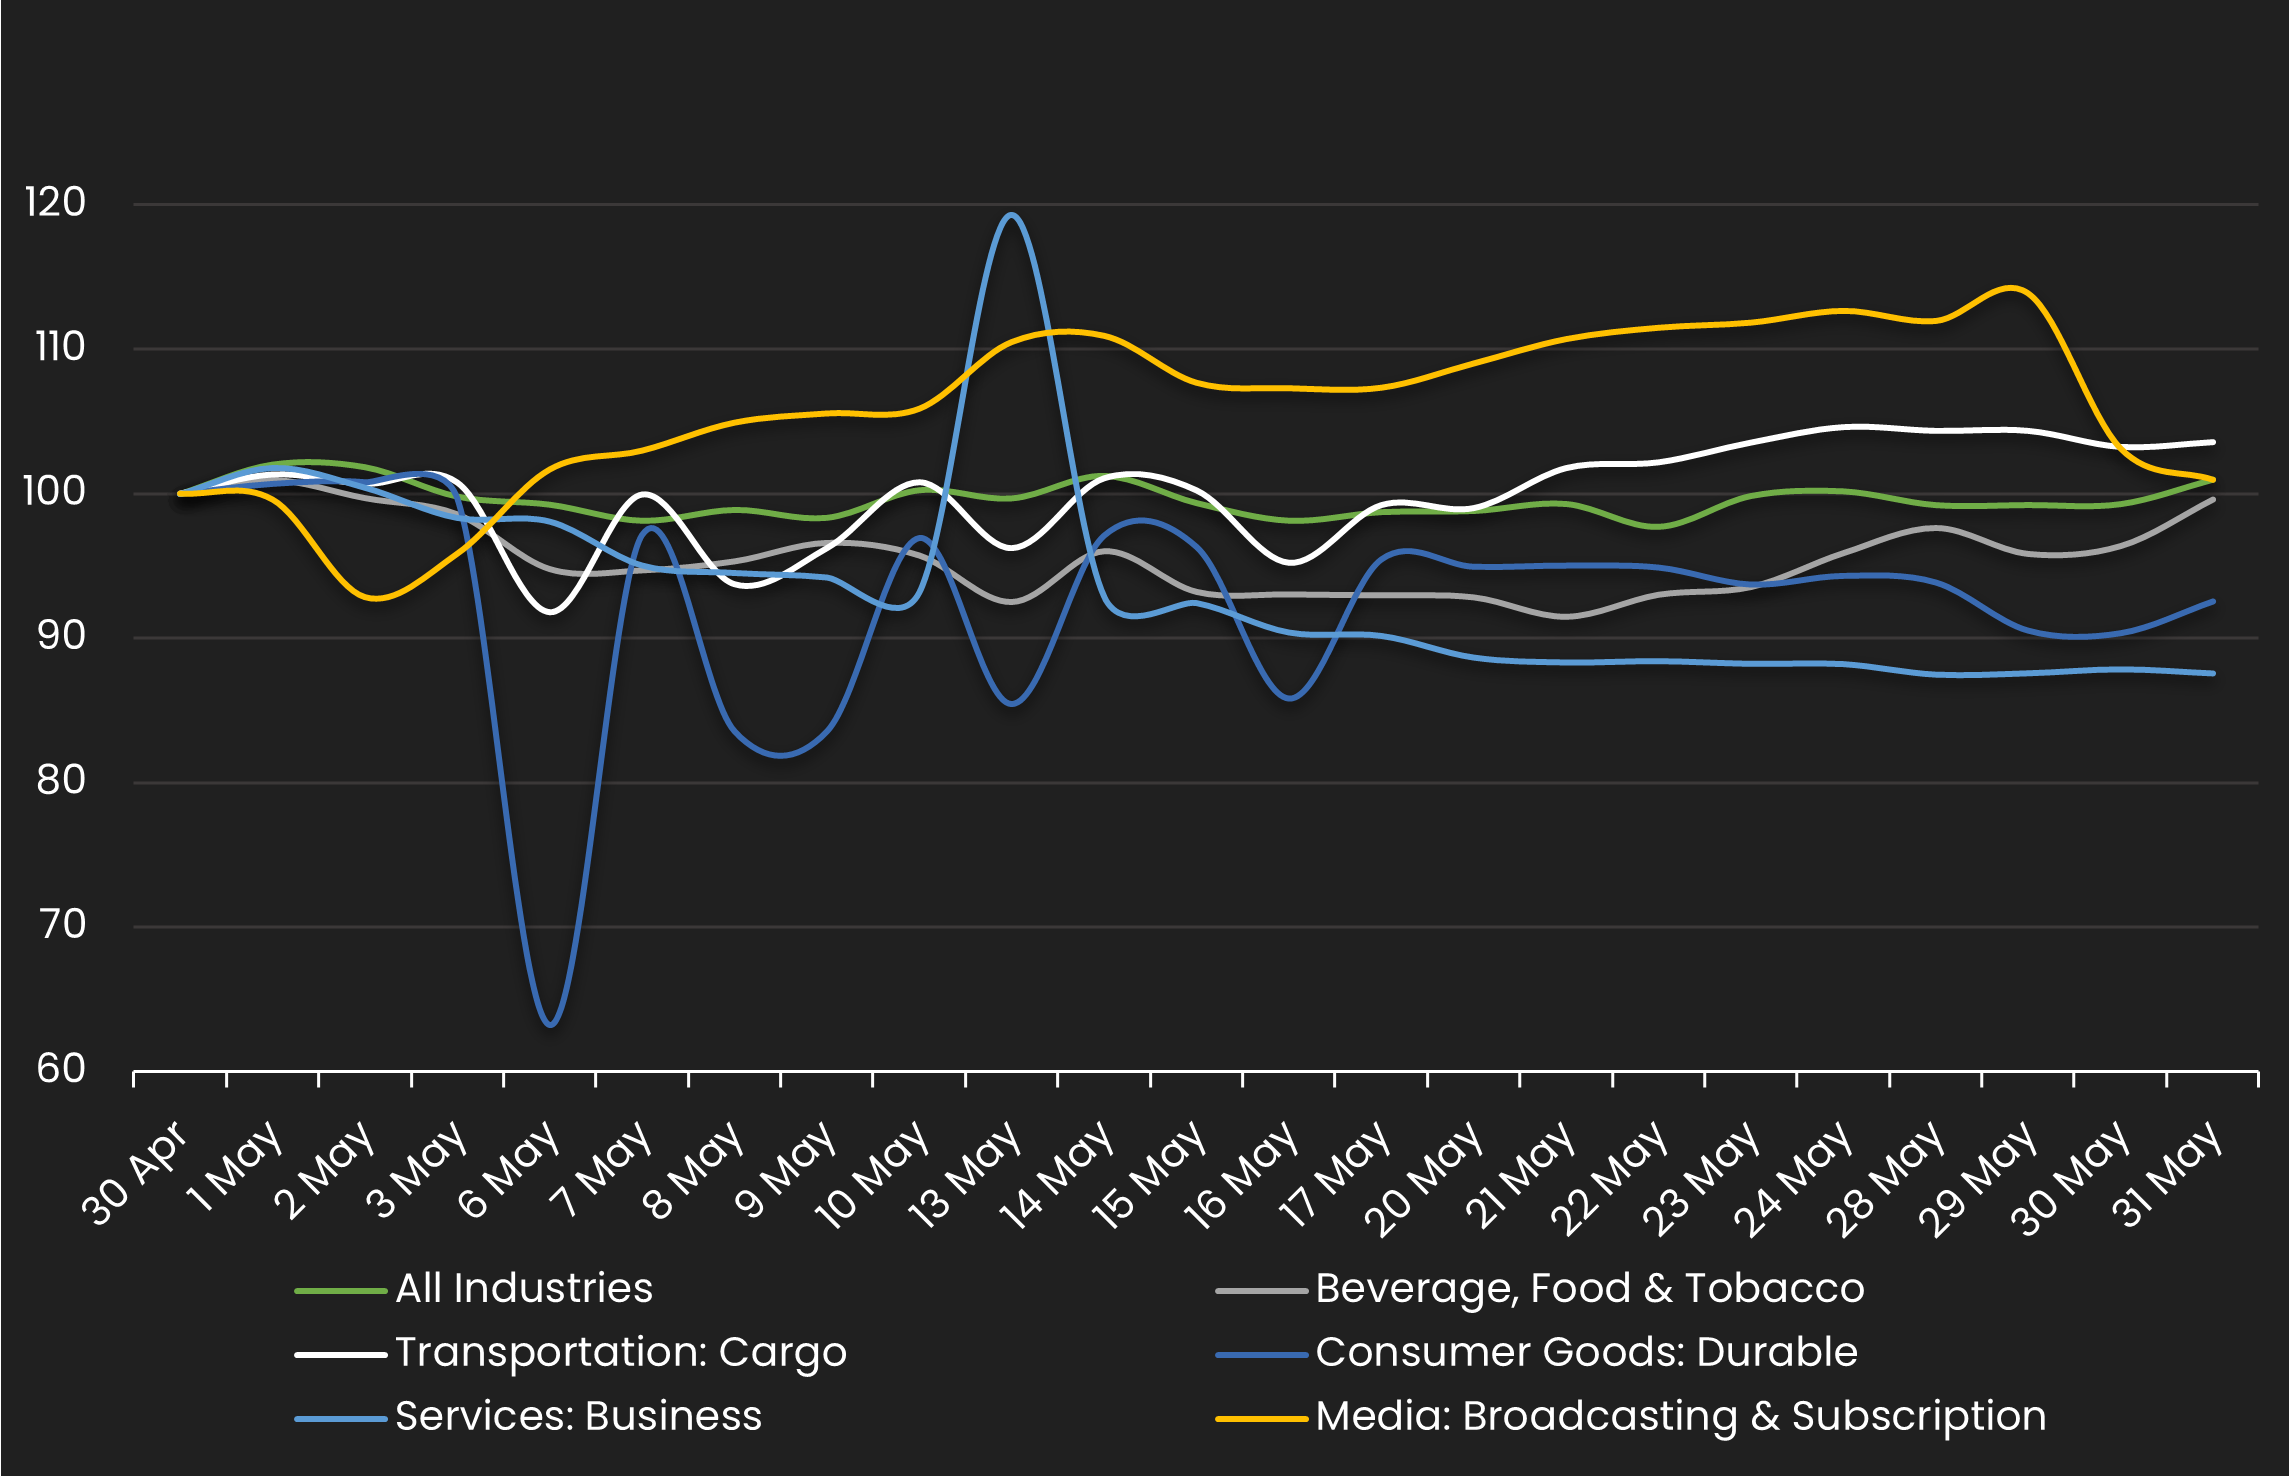
Normalized IG Spread by Industry
Displays the IG CDS spread by industry between 5/1/24 – 4/31/24 Results are based on 5 select industry sectors, however, we offer data across 36 sectors
IG Spread by Industries – Monthly Comparison
Exhibits the IG spread by industry for the month ending 4/30/23 vs. the month ending 5/31/24
| INDUSTRIES | PREVIOUS SPREAD | CURRENT SPREAD | BPS CHANGE | MONTHLY PERFORMANCE | CDS COUNT |
|---|---|---|---|---|---|
| All Industries | 49 | 49 | 0 | Wider | 610 |
| Beverage, Food & Tobacco | 40 | 40 | 0 | Tighter | 34 |
| Transportation: Cargo | 23 | 24 | 1 | Wider | 14 |
| Consumer Goods: Durable | 78 | 72 | -6 | Tighter | 6 |
| Services: Business | 56 | 49 | -7 | Tighter | 3 |
| Media: Broadcasting & Subscription | 121 | 122 | 1 | Wider | 2 |
Stay up-to-date with monthly summaries.
Related Resources
About SOLVE
SOLVE is the leading market data platform provider for fixed-income securities, trusted by sophisticated buy-side and sell-side firms worldwide. Founded in 2011, SOLVE leverages its AI-driven technology and deep industry expertise to offer unparalleled transparency into markets, reduce risk, and save hundreds of hours across front-office workflows. With the largest real-time datasets for Securitized Products, Municipal Bonds, Corporate Bonds, Syndicated Bank Loans, Convertible Bonds, CDS, and Private Credit, SOLVE empowers clients to transform the way they bring new securities to market, trade on secondary markets, and value highly illiquid securities. Headquartered in Connecticut, with offices across the globe, SOLVE is the definitive source for market pricing in fixed-income markets.
