High Yield CDS Market Summary – January 2025
GET OUR CDS MARKET SUMMARIES STRAIGHT TO YOUR INBOX. LEARN MORE
High Yield CDS Market Summary: January 2025
Our newsletter presents key trends derived from observable Credit Default Swaps pricing data over a monthly period.
Top 10 Outperformers
Showcases the top 10 HY CDS “outperformers” based on the largest mid spread decreases between 1/1/25 – 1/31/25
| RANK | BOND NAME | ISSUER | % CHANGE | BPS CHANGE | SPRD | SPRD-1 MONTH | DEALERS |
|---|---|---|---|---|---|---|---|
| 1 | CALPINE 5Y | CALPINE CORP | -52.0% | -76 | 70 | 145 | 4 |
| 2 | X 5Y | TRANSTAR HLDGS INC | -32.4% | -68 | 142 | 210 | 5 |
| 3 | MONTE 5Y | BANCA ANTONVENETA SPA/OLD | -30.3% | -38 | 87 | 125 | 3 |
| 4 | UAL 5Y | UNITED CONTINENTAL HOLDINGS INC | -19.0% | -35 | 150 | 185 | 4 |
| 5 | BANBRA 5Y | BANCO DO BRASIL S A MEDIUM | -17.4% | -38 | 179 | 216 | 2 |
| 6 | CCLLN 5Y | CARNIVAL PLC | -16.1% | -24 | 126 | 150 | 4 |
| 7 | SIRI 5Y | SCS HOLDINGS INC | -16.1% | -34 | 176 | 210 | 3 |
| 8 | PETBRA 5Y | PF EXPT RECEIVABLES MASTER TR | -15.8% | -35 | 186 | 221 | 3 |
| 9 | SWY 5Y | SAFEWAY INC | -14.1% | -14 | 87 | 101 | 3 |
| 10 | KBH 5Y | KB HOME | -13.8% | -22 | 138 | 160 | 4 |
Top 10 Underperformers
Showcases the top 10 HY CDS “underperformers” based on the largest mid spread increases between 1/1/25 – 1/31/25
| RANK | BOND NAME | ISSUER | % CHANGE | BPS CHANGE | SPREAD | SPREAD-1 MONTH | DEALERS |
|---|---|---|---|---|---|---|---|
| 1 | TGNA 5Y | TEGNA INC | 30.6% | 54 | 229 | 175 | 3 |
| 2 | NMAC 5Y | NISSAN MTR ACCEP CORP | 21.3% | 26 | 147 | 121 | 3 |
| 3 | SOFTBK 5Y | SOFTBANK GROUP CORP | 15.0% | 30 | 230 | 200 | 6 |
| 4 | CSTM 5Y | CONSTELLIUM NV | 10.6% | 28 | 295 | 267 | 3 |
| 5 | IGT 5Y | INTERNATIONAL GAME TECHNOLOGY | 8.9% | 10 | 123 | 113 | 2 |
| 6 | SAIBV 5Y | SAIPEM FINANCE INTERNATIONAL BV | 8.9% | 13 | 155 | 143 | 3 |
| 7 | IPGIM 5Y | SALINI IMPREGILO | 8.8% | 16 | 198 | 182 | 3 |
| 8 | MBIA_AA 5Y | MBIA INC | 8.0% | 28 | 378 | 350 | 2 |
| 9 | CMACG 5Y | CMA CGM S A | 7.5% | 17 | 242 | 225 | 3 |
| 10 | ASSDLN 5Y | ASDA | 7.4% | 36 | 525 | 489 | 3 |
Normalized HY Spread by Region
Displays the HY CDS spread by region between 1/1/25 – 1/31/25 Results are based on 5 select regions, however, we offer data across 12 regions
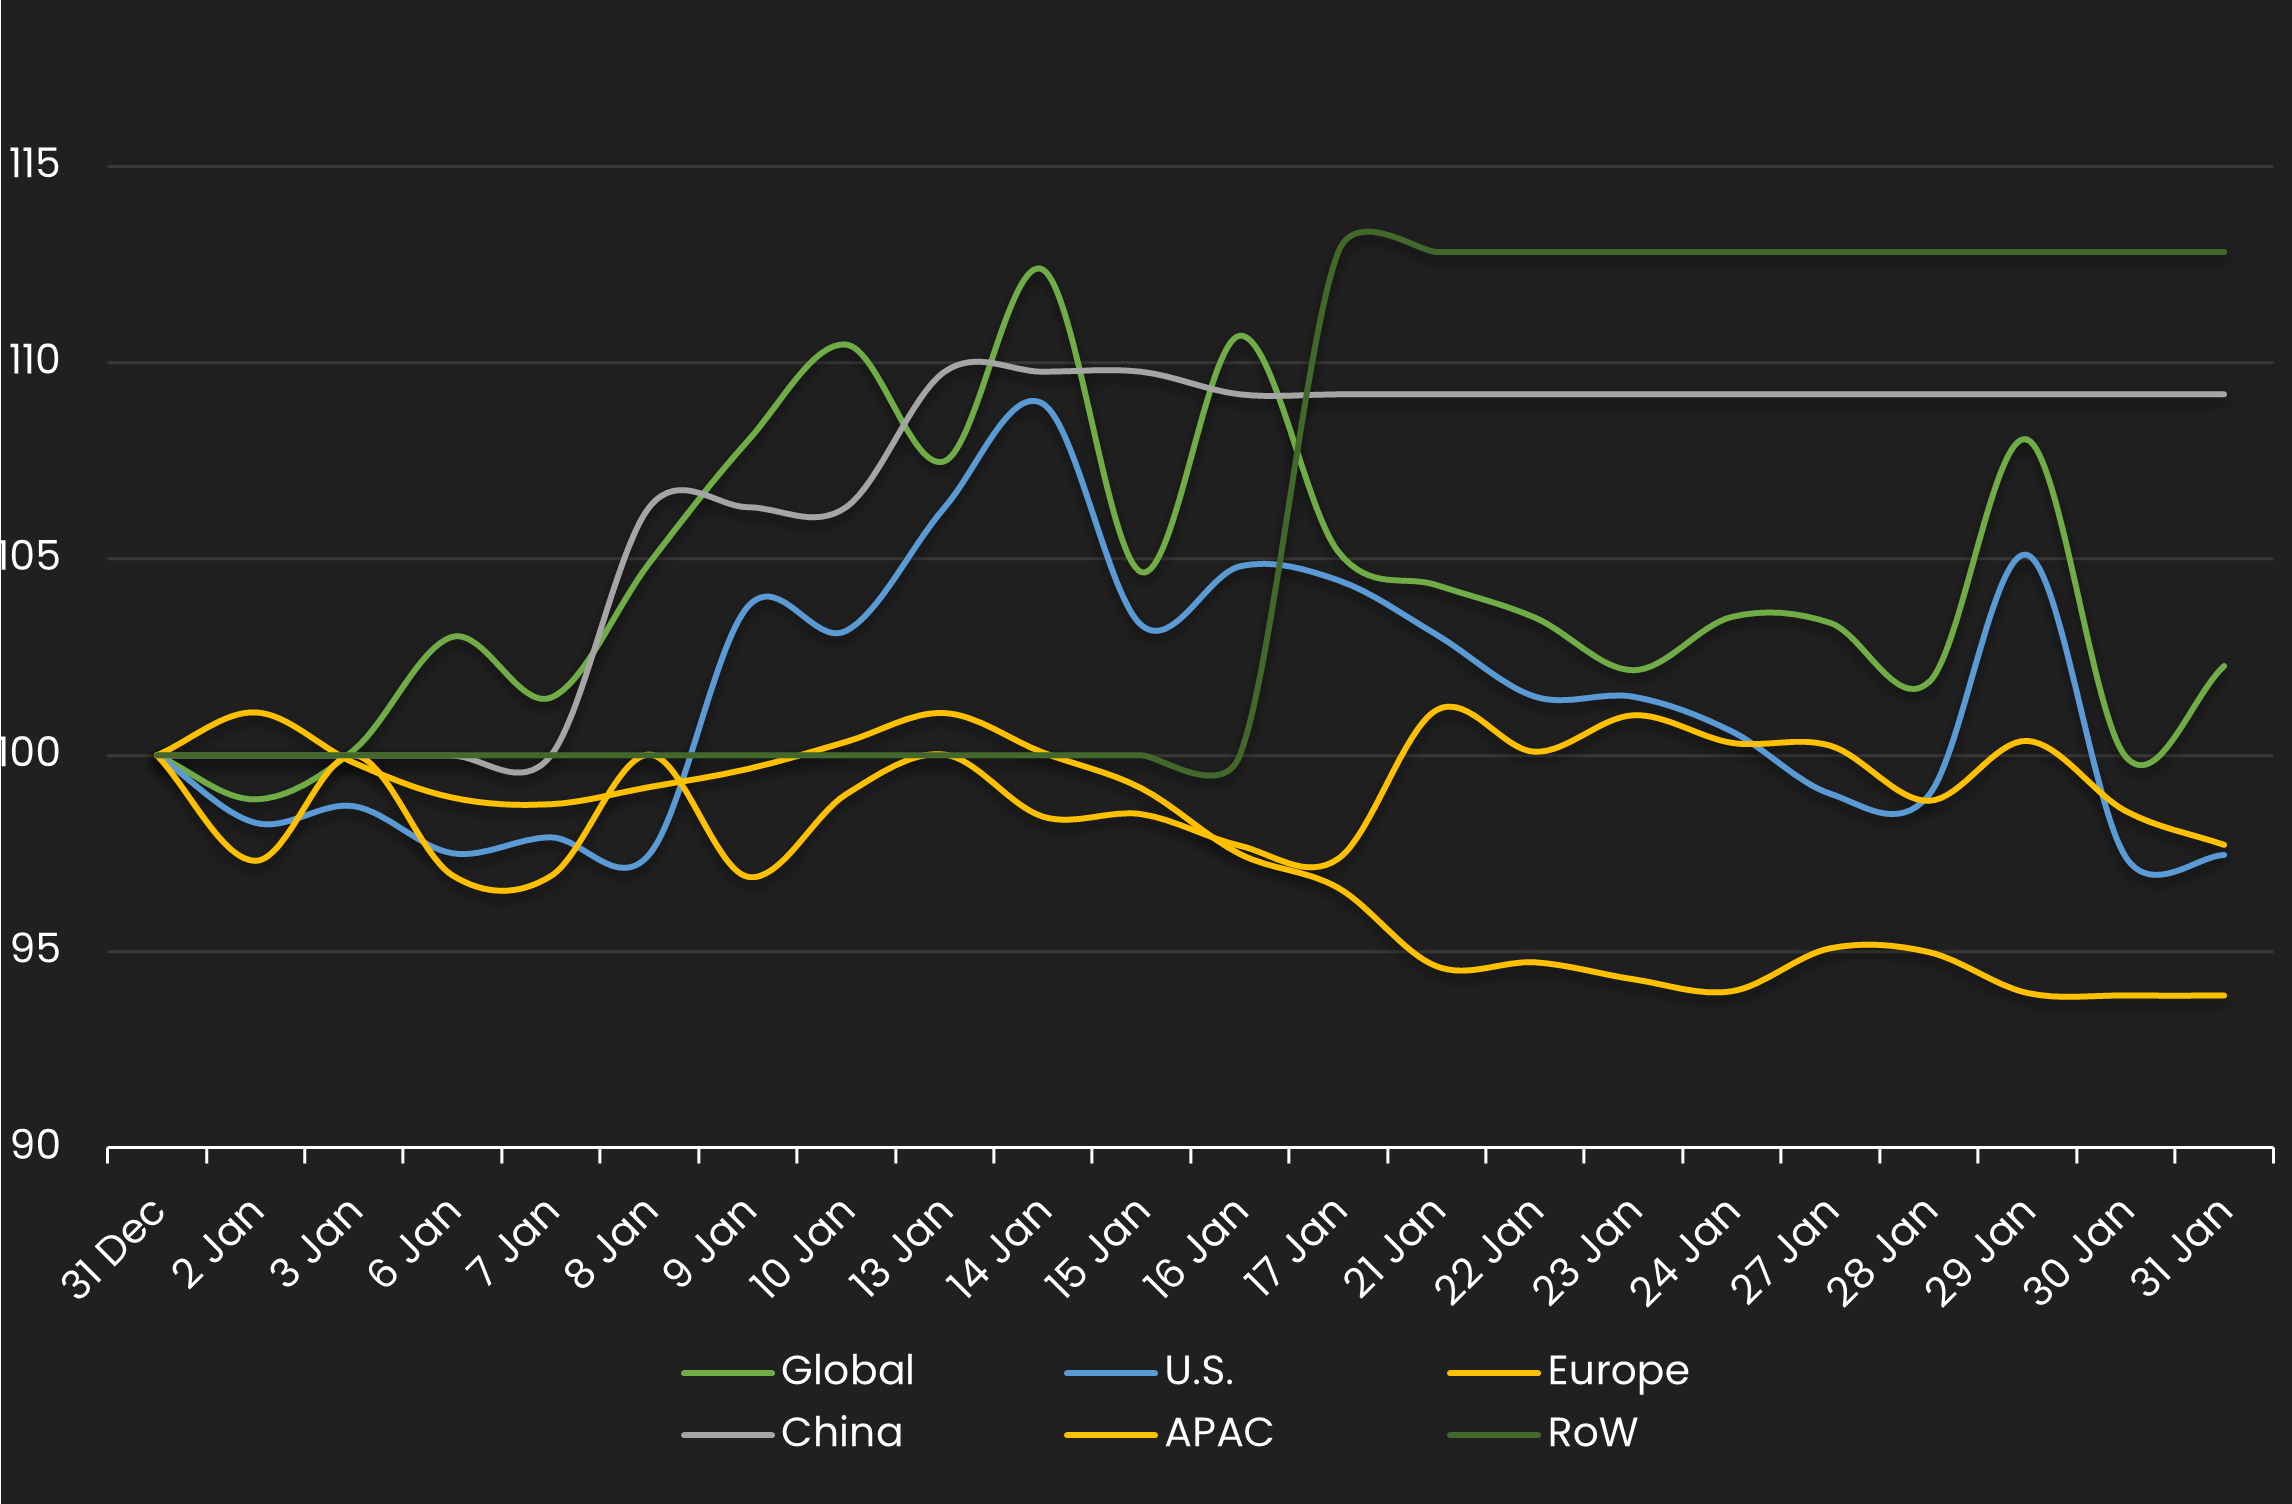
HY Spread by Region – Monthly Comparison
Exhibits the HY mid spread by region for the month ending 12/31/24 vs. the month ending 1/31/25
| REGION | PREVIOUS SPREAD | CURRENT SPREAD | BPS CHANGE | MONTHLY PERFORMANCE | CDS COUNT |
|---|---|---|---|---|---|
| Global | 134 | 137 | 3 | Wider | 190 |
| U.S. | 131 | 128 | -3 | Tighter | 99 |
| Europe | 160 | 156 | -4 | Tighter | 50 |
| China | 87 | 95 | 8 | Wider | 1 |
| APAC | 107 | 100 | -7 | Tighter | 1 |
| RoW | 98 | 110 | 13 | Wider | 1 |
Normalized HY Spread by Industry
Displays the HY CDS spread by industry between 1/1/25 – 1/31/25 Results are based on 5 select industry sectors, however, we offer data across 36 sectors
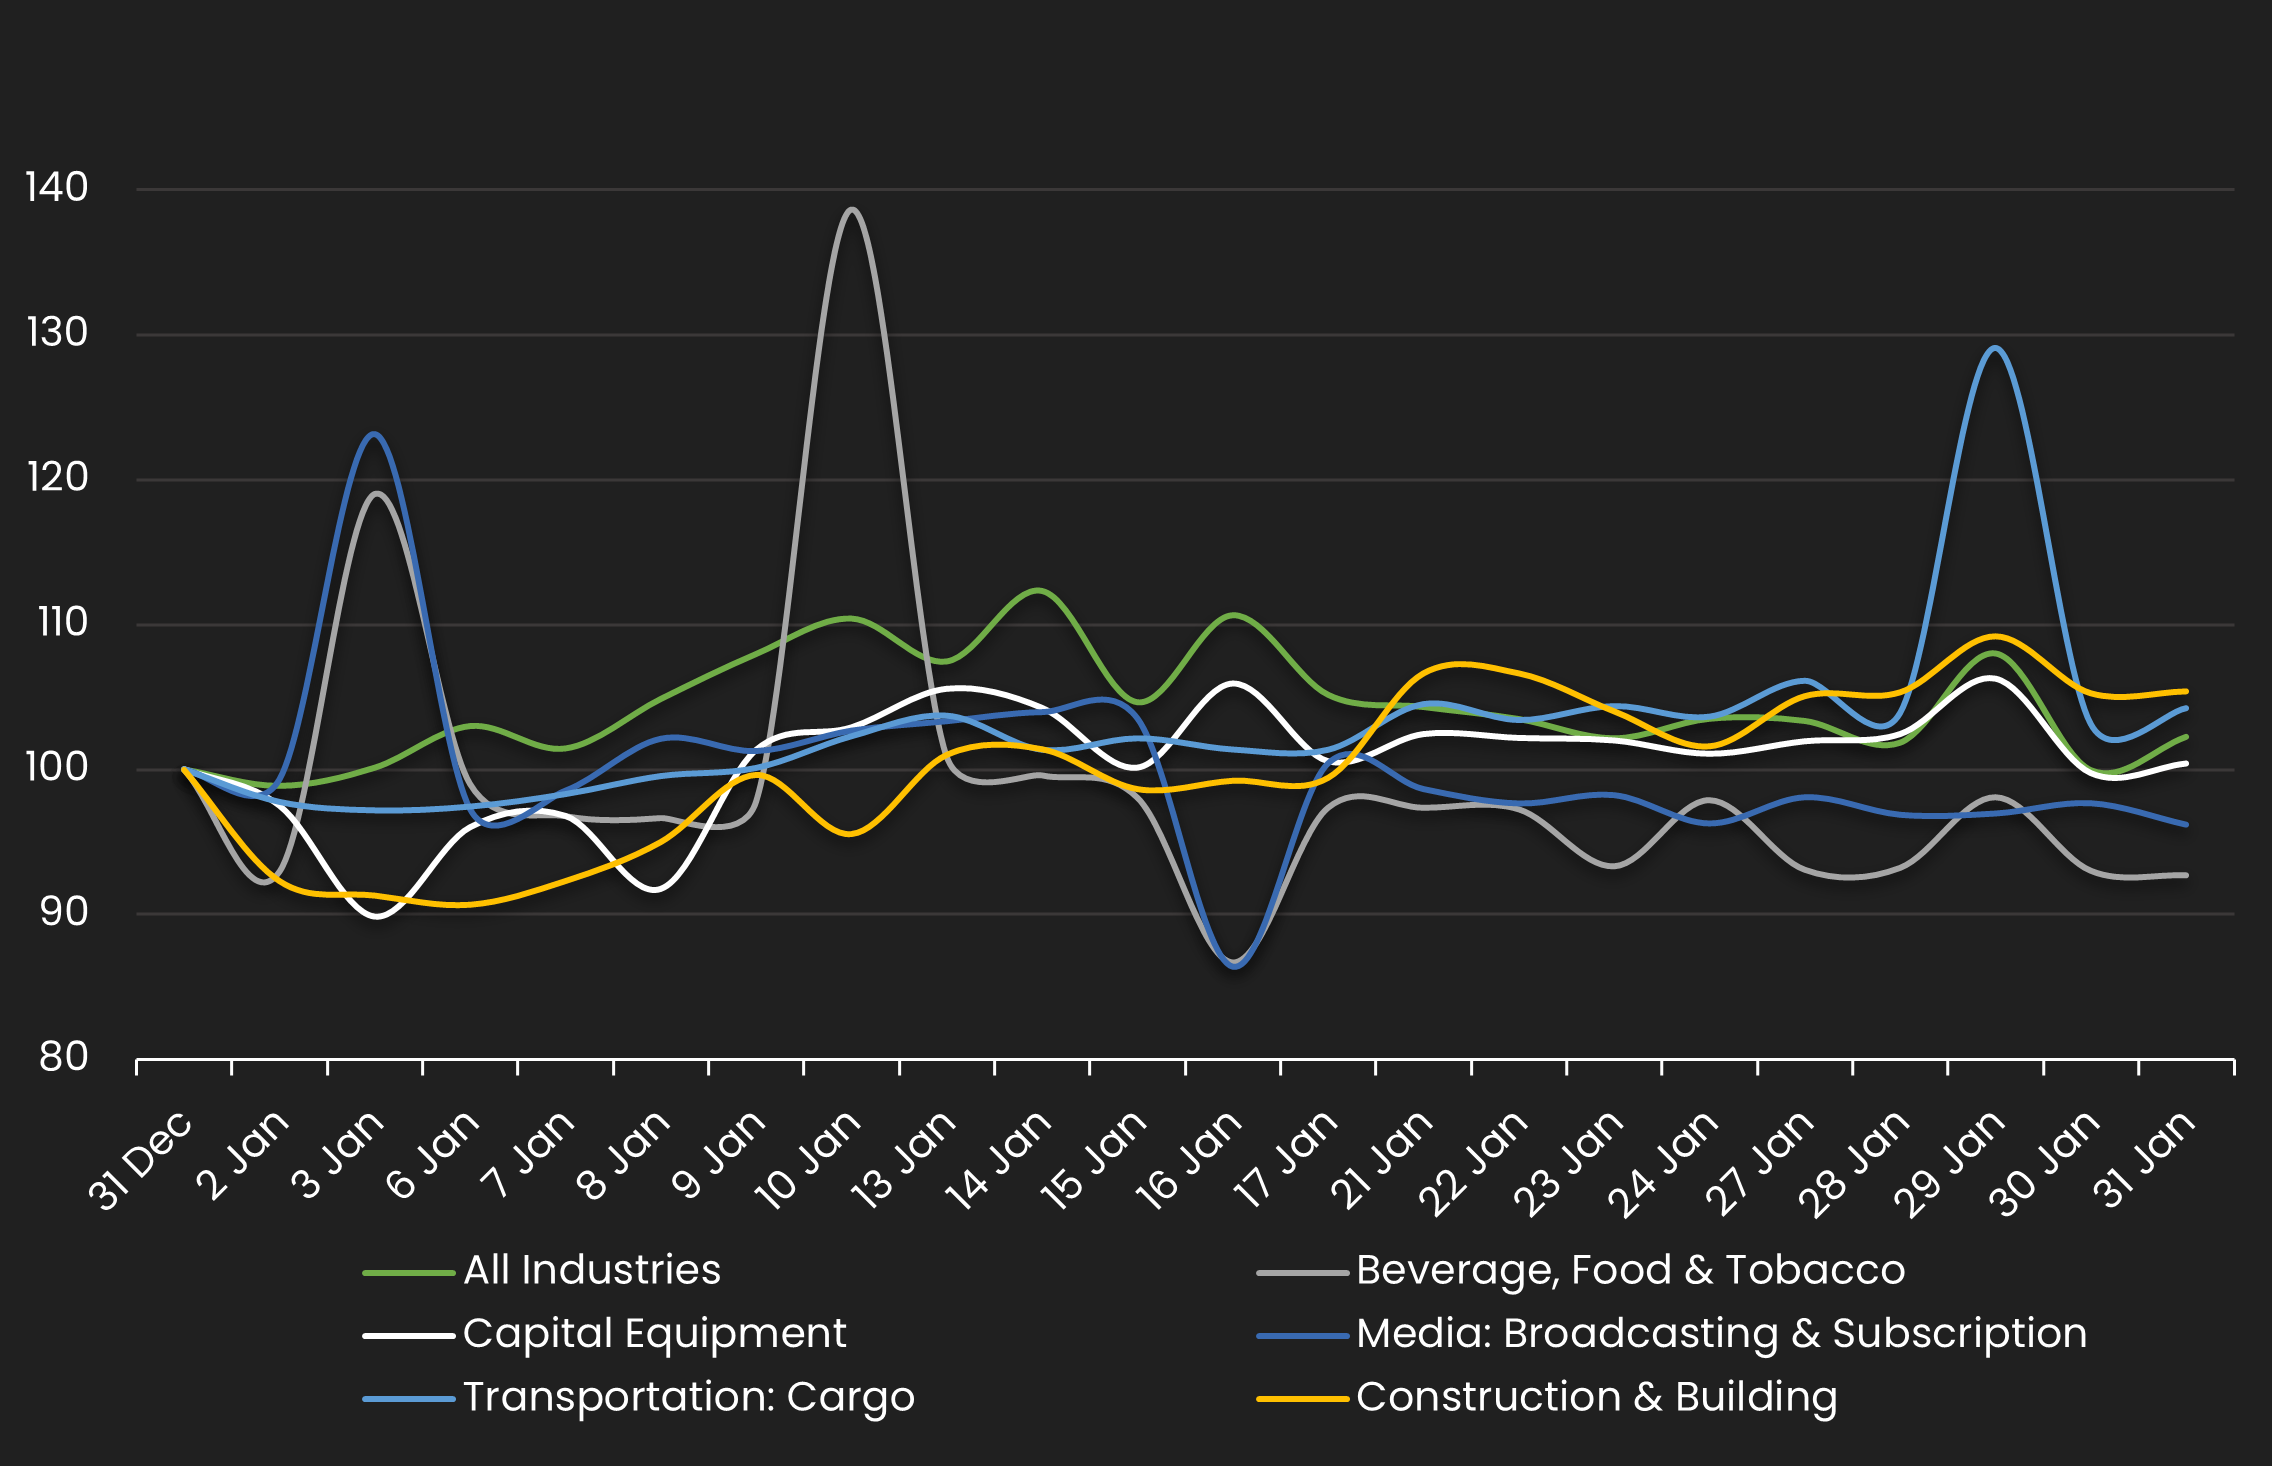
HY Spread by Industries – Monthly Comparison
Exhibits the HY spread by industry for the month ending 12/31/24 vs. the month ending 1/31/25
| INDUSTRIES | PREVIOUS SPREAD | CURRENT SPREAD | BPS CHANGE | MONTHLY PERFORMANCE | CDS COUNT |
|---|---|---|---|---|---|
| All Industries | 134 | 137 | 3 | Wider | 190 |
| Beverage, Food & Tobacco | 177 | 164 | -13 | Tighter | 8 |
| Capital Equipment | 181 | 182 | 1 | Wider | 5 |
| Media: Broadcasting & Subscription | 275 | 265 | -10 | Tighter | 5 |
| Transportation: Cargo | 155 | 161 | 7 | Wider | 3 |
| Construction & Building | 195 | 206 | 11 | Wider | 4 |
Stay up-to-date with monthly summaries.
Related Resources
About SOLVE
SOLVE is the leading market data platform provider for fixed-income securities, trusted by sophisticated buy-side and sell-side firms worldwide. Founded in 2011, SOLVE leverages its AI-driven technology and deep industry expertise to offer unparalleled transparency into markets, reduce risk, and save hundreds of hours across front-office workflows. With the largest real-time datasets for Securitized Products, Municipal Bonds, Corporate Bonds, Syndicated Bank Loans, Convertible Bonds, CDS, and Private Credit, SOLVE empowers clients to transform the way they bring new securities to market, trade on secondary markets, and value highly illiquid securities. Headquartered in Connecticut, with offices across the globe, SOLVE is the definitive source for market pricing in fixed-income markets.
