High Yield CDS Market Summary – December 2023
GET OUR CDS MARKET SUMMARIES STRAIGHT TO YOUR INBOX. LEARN MORE
High Yield CDS Market Summary:December 2023
Our newsletter presents key trends derived from observable Credit Default Swaps pricing data over a monthly period.
Top 10 Outperformers
Showcases the top 10 HY CDS “outperformers” based on the largest mid spread decreases between 12/1/23 – 12/31/23
| RANK | BOND NAME | ISSUER | % CHANGE | BPS CHANGE | SPRD | SPRD-1 MONTH | DEALERS |
|---|---|---|---|---|---|---|---|
| 1 | GNW 5Y | AQGEN LIBERTY MGMT I INC | -18.3% | -27 | 123 | 150 | 3 |
| 2 | NMAC 5Y | NISSAN MTR ACCEP CORP | -17.7% | -22 | 102 | 124 | 3 |
| 3 | NRG 5Y | NRG ENERGY INC | -16.8% | -37 | 183 | 220 | 3 |
| 4 | CSTM 5Y | CONSTELLIUM NV | -14.7% | -39 | 224 | 263 | 3 |
| 5 | CZR 5Y | CAESARS ENTERTAINMENT OP | -14.2% | -38 | 229 | 267 | 3 |
| 6 | LHAGR 5Y | DEUTSCHE LUFTHANSA AG | -12.9% | -24 | 160 | 184 | 3 |
| 7 | PFDLN 5Y | PREMIER FOODS FINANCE PLC | -11.8% | -23 | 174 | 197 | 3 |
| 8 | MGM 5Y | MGM RESORTS INTERNATIONAL | -9.4% | -20 | 194 | 214 | 3 |
| 9 | PPFTEL 5Y | PPF TELECOM GROUP BV | -7.8% | -9 | 101 | 109 | 2 |
| 10 | SOFTBK 5Y | SOFTBANK GROUP CORP | -6.3% | -13 | 189 | 202 | 3 |
Top 10 Underperformers
Showcases the top 10 HY CDS “underperformers” based on the largest mid spread increases between 12/1/23 – 12/31/23
| RANK | BOND NAME | ISSUER | % CHANGE | BPS CHANGE | SPREAD | SPREAD-1 MONTH | DEALERS |
|---|---|---|---|---|---|---|---|
| 1 | AR 5Y | ANTERO RESOURCES CORP | 11.7% | 15 | 142 | 127 | 4 |
| 2 | CHK 5Y | CHESAPEAKE ENERGY CORP | 6.0% | 8 | 143 | 135 | 3 |
| 3 | TGNA 5Y | TEGNA INC | 5.7% | 12 | 219 | 208 | 3 |
| 4 | ECACN 5Y | ALBERTA ENERGY CO LTD MEDIUM | 3.1% | 3 | 105 | 102 | 3 |
| 5 | RMK 5Y | ARAMARK CORP | 3.0% | 4 | 143 | 139 | 3 |
| 6 | SFI 5Y | ISTAR FINL INC | 2.6% | 4 | 161 | 157 | 3 |
| 7 | IPGIM 5Y | SALINI IMPREGILO | 1.0% | 4 | 401 | 397 | 3 |
| 8 | MATTER 5Y | ORANGE COMMUNICATIONS | 0.8% | 2 | 270 | 268 | 2 |
| 9 | SVU 5Y | SUPERVALU INC | 0.1% | 0 | 259 | 259 | 3 |
| 10 | MAT 5Y | MATTEL INC | 0.1% | 0 | 205 | 205 | 2 |
Normalized HY Spread by Region
Displays the HY CDS spread by region between 12/1/23 – 12/31/23 Results are based on 5 select regions, however, we offer data across 12 regions
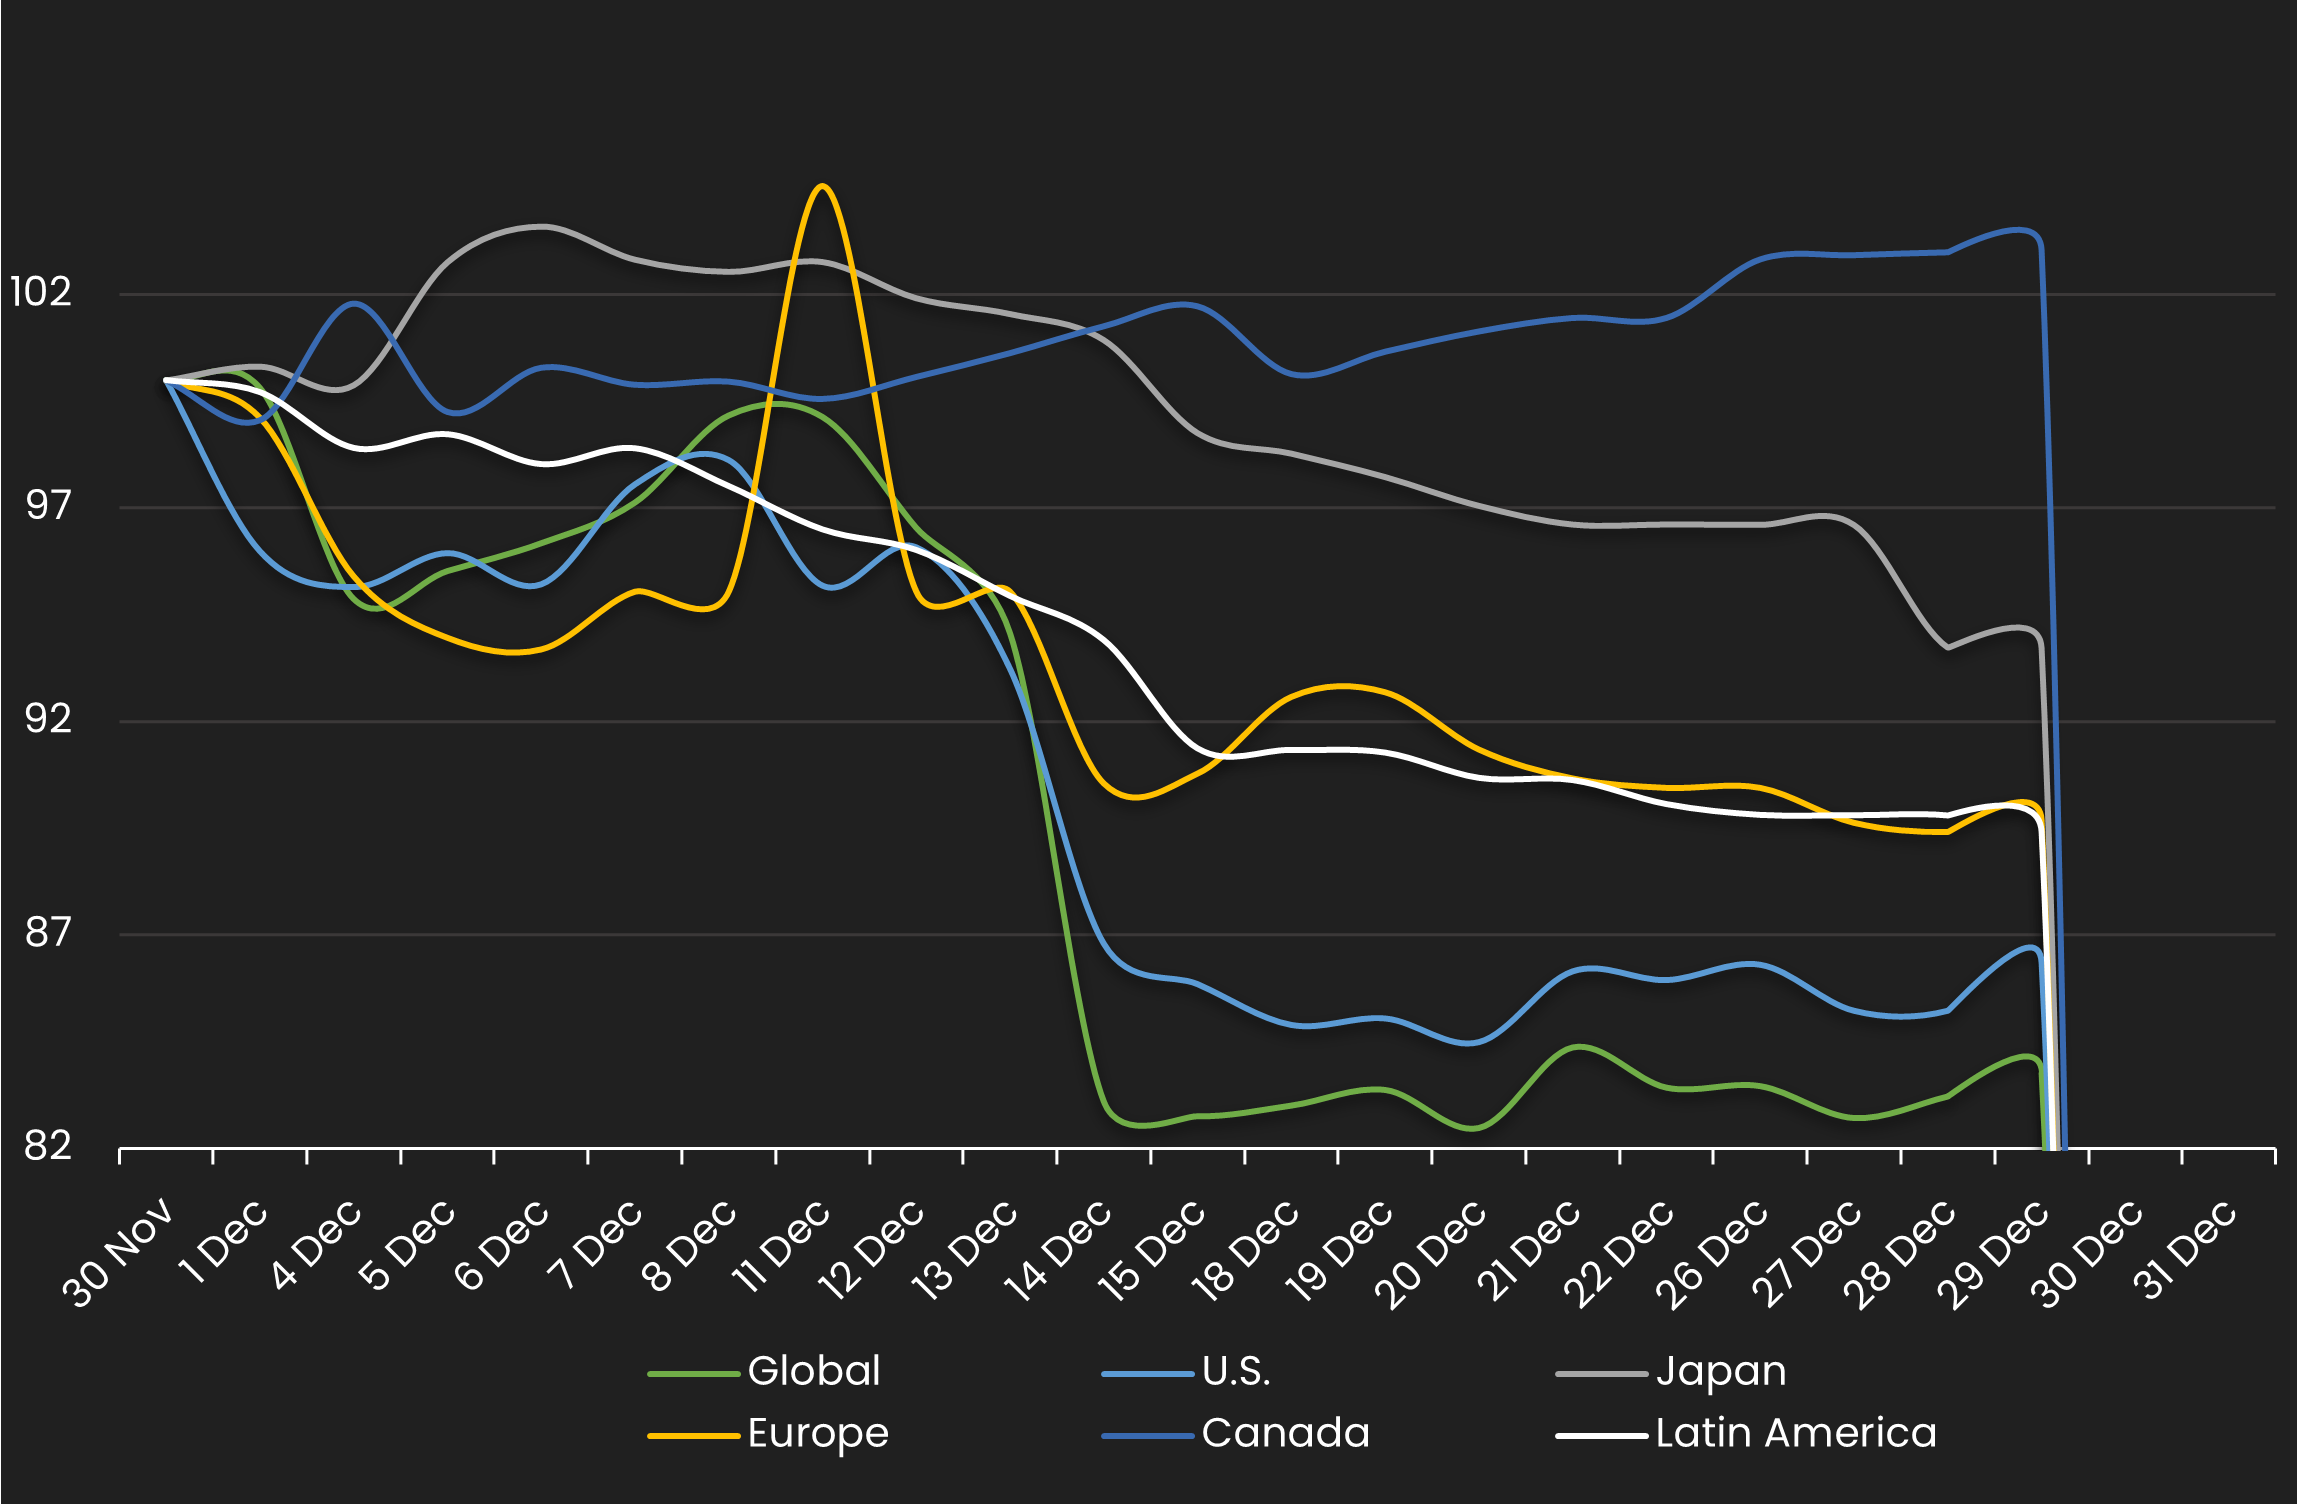
HY Spread by Region – Monthly Comparison
Exhibits the HY mid spread by region for the month ending 11/30/23 vs. the month ending 12/31/23
| REGION | PREVIOUS SPREAD | CURRENT SPREAD | BPS CHANGE | MONTHLY PERFORMANCE | CDS COUNT |
|---|---|---|---|---|---|
| Global | 191 | 160 | -31 | Tighter | 178 |
| U.S. | 186 | 160 | -25 | Tighter | 95 |
| Japan | 202 | 189 | -13 | Tighter | 5 |
| Europe | 189 | 170 | -20 | Tighter | 49 |
| Canada | 102 | 105 | 3 | Wider | 3 |
| Latin America | 241 | 215 | -25 | Tighter | 4 |
Normalized HY Spread by Industry
Displays the HY CDS spread by industry between 12/1/23 – 12/31/23 Results are based on 5 select industry sectors, however, we offer data across 36 sectors
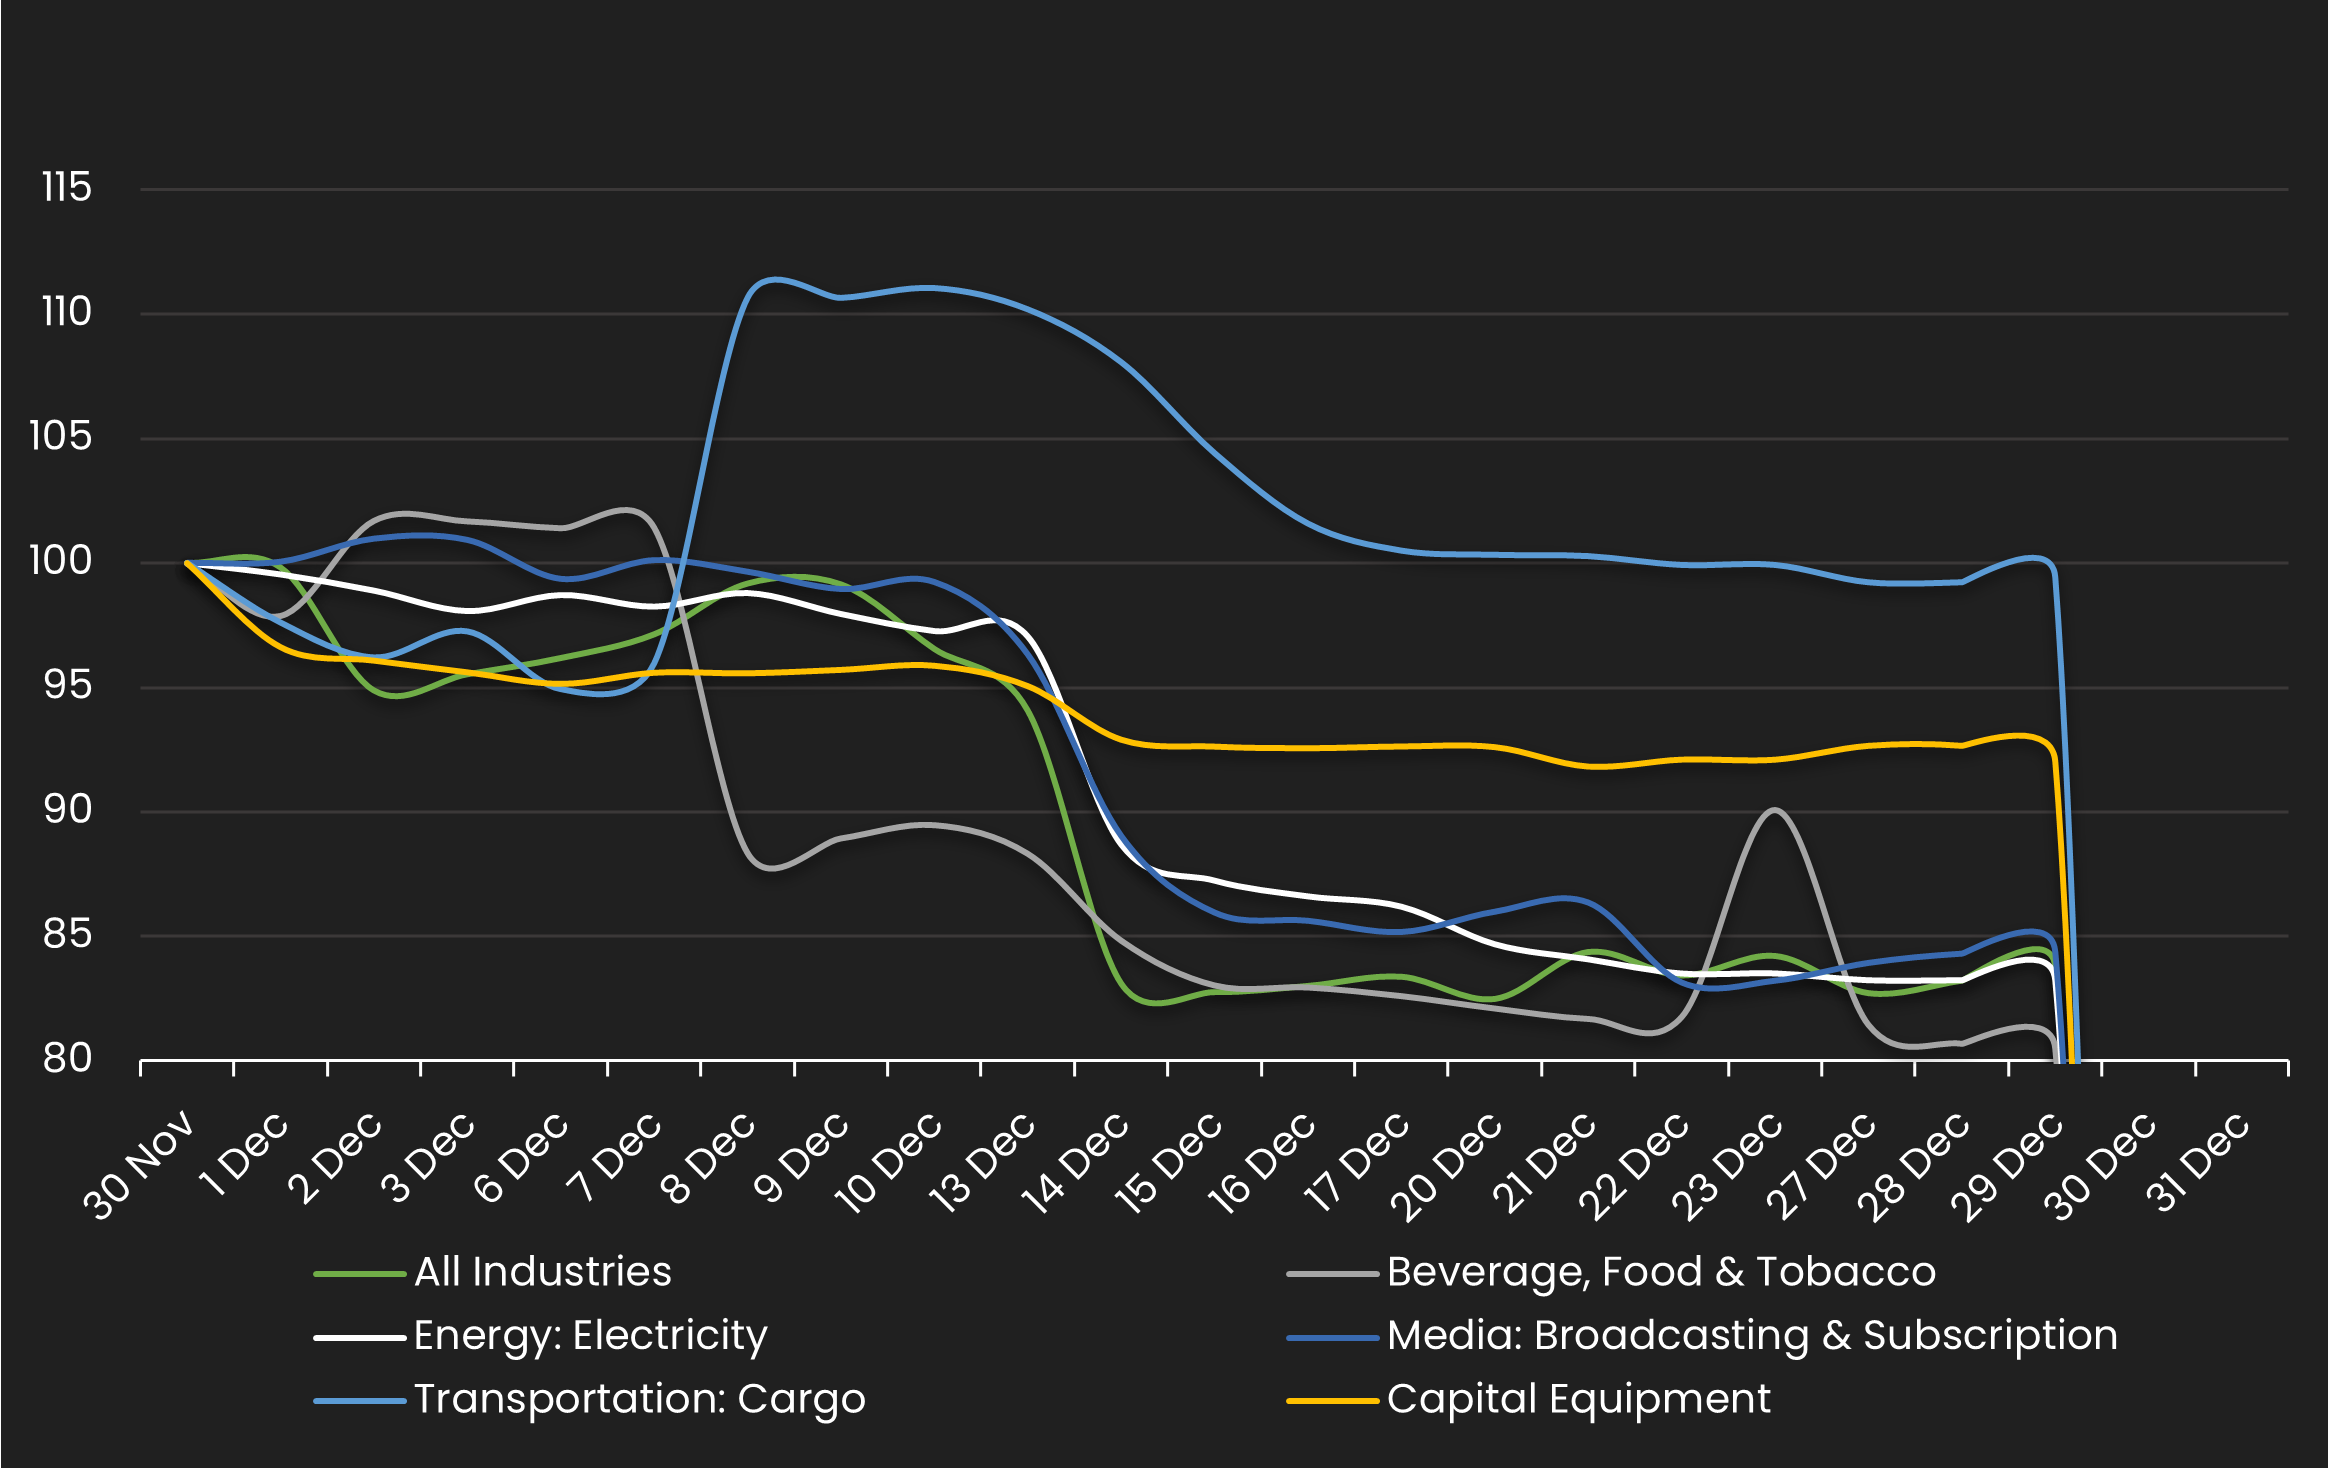
HY Spread by Industries – Monthly Comparison
Exhibits the HY spread by industry for the month ending 11/30/23 vs. the month ending 12/31/23
| INDUSTRIES | PREVIOUS SPREAD | CURRENT SPREAD | BPS CHANGE | MONTHLY PERFORMANCE | CDS COUNT |
|---|---|---|---|---|---|
| All Industries | 191 | 160 | -31 | Tighter | 178.00 |
| Beverage, Food & Tobacco | 197 | 158 | -38 | Tighter | 6.00 |
| Energy: Electricity | 220 | 183 | -37 | Tighter | 1.00 |
| Media: Broadcasting & Subscription | 323 | 273 | -51 | Tighter | 5.00 |
| Transportation: Cargo | 239 | 238 | -1 | Tighter | 4.00 |
| Capital Equipment | 266 | 245 | -21 | Tighter | 6.00 |
Stay up-to-date with monthly summaries.
Related Resources
About SOLVE
SOLVE is the leading market data platform provider for fixed-income securities, trusted by sophisticated buy-side and sell-side firms worldwide. Founded in 2011, SOLVE leverages its AI-driven technology and deep industry expertise to offer unparalleled transparency into markets, reduce risk, and save hundreds of hours across front-office workflows. With the largest real-time datasets for Securitized Products, Municipal Bonds, Corporate Bonds, Syndicated Bank Loans, Convertible Bonds, CDS, and Private Credit, SOLVE empowers clients to transform the way they bring new securities to market, trade on secondary markets, and value highly illiquid securities. Headquartered in Connecticut, with offices across the globe, SOLVE is the definitive source for market pricing in fixed-income markets.
