Municipal Bond Market Summary – Week Ending 6/12/26
Our newsletter presents key trends derived from observable Municipal Bond pricing data over a weekly period.
Top 10 Performers
Showcases the top 10 Muni Bond performers based on price movements between 6/5/26-6/12/26
| Rank | Bond Name | Coupon | Maturity | Change | PRC | PRC-1W | Dealers |
| 1 | IOWA ST FIN AUTH REVE | 5.000% | 05/15/48 | ▲ 3.34% | 100.00 | 96.76 | 4 |
| 2 | DALLAS-FORT WORTH TX | 3.089% | 11/01/40 | ▲ 2.23% | 81.27 | 79.49 | 8 |
| 3 | CA CMNTY CHOICE-E | 5.000% | 07/01/34 | ▲ 2.07% | 111.22 | 108.96 | 3 |
| 4 | UNIV MASS-2 | 4.306% | 11/01/45 | ▲ 1.90% | 89.33 | 87.66 | 4 |
| 5 | ILLINOIS ST-C-BAM | 4.000% | 10/01/48 | ▲ 1.77% | 92.49 | 90.88 | 13 |
| 6 | PORT AUTH NYS & NJ C | 3.250% | 12/01/42 | ▲ 1.48% | 89.17 | 87.87 | 2 |
| 7 | SAN JUAN UNIF SD | 5.000% | 08/01/40 | ▲ 1.47% | 116.65 | 114.96 | 4 |
| 8 | BROCKTON-TXBL | 5.153% | 02/01/38 | ▲ 1.34% | 101.34 | 100.00 | 3 |
| 9 | NAUSET REGL SD | 4.000% | 05/15/49 | ▲ 1.29% | 95.61 | 94.40 | 2 |
| 10 | ARVIN EDISON WTR-COPS | 4.000% | 05/01/51 | ▲ 1.22% | 96.72 | 95.55 | 2 |
Bottom 10 Performers
Showcases the bottom 10 Muni Bond performers based on price movements between 6/5/26-6/12/26
| Rank | Bond Name | Coupon | Maturity | Change | PRC | PRC-1W | Dealers |
| 1 | GREECE-PUBLIC IMPT | 3.125% | 08/15/43 | ▼ -3.73% | 85.02 | 88.32 | 2 |
| 2 | DU PAGE CNTY IL REVEN | 3.000% | 05/15/47 | ▼ -2.56% | 74.95 | 76.91 | 8 |
| 3 | IDAHO HLTH FACS AUTH | 2.500% | 09/01/50 | ▼ -2.49% | 64.14 | 65.78 | 2 |
| 4 | FL ST HSG FIN CORP | 1.750% | 07/01/33 | ▼ -2.16% | 85.40 | 87.28 | 2 |
| 5 | TEXAS DEPT HSG-A | 3.750% | 09/01/49 | ▼ -2.02% | 87.15 | 88.95 | 2 |
| 6 | CALIFORNIA ST-CQ | 3.250% | 12/01/45 | ▼ -1.95% | 86.59 | 88.31 | 3 |
| 7 | MA HSG FIN-D | 4.250% | 12/01/54 | ▼ -1.93% | 92.74 | 94.56 | 2 |
| 8 | MAYPEARL ISD-REF | 3.000% | 02/15/33 | ▼ -1.84% | 96.51 | 98.32 | 2 |
| 9 | MASON PUB SCHS-I | 4.375% | 05/01/49 | ▼ -1.67% | 97.77 | 99.44 | 2 |
| 10 | HUTCHINSON ISD #423-A | 3.250% | 02/01/40 | ▼ -1.66% | 93.13 | 94.69 | 2 |
Top 10 State Performers
Showcases the top 10 Muni State performers based on yield movements between 6/5/26-6/12/26
| Rank | State | Change | YLD | YLD-1W |
| 1 | KS | ▼ -14 bps | 3.53% | 3.67% |
| 2 | HI | ▼ -14 bps | 4.29% | 4.43% |
| 3 | NC | ▼ -12 bps | 3.41% | 3.53% |
| 4 | AK | ▼ -11 bps | 3.35% | 3.46% |
| 5 | NV | ▼ -11 bps | 3.55% | 3.65% |
| 6 | OR | ▼ -9 bps | 3.70% | 3.79% |
| 7 | DE | ▼ -7 bps | 3.19% | 3.26% |
| 8 | OK | ▼ -6 bps | 3.67% | 3.73% |
| 9 | CO | ▼ -6 bps | 3.46% | 3.52% |
| 10 | MI | ▼ -5 bps | 3.68% | 3.73% |
Bottom 10 State Performers
Showcases the bottom 10 Muni State performers based on yield movements between 6/5/26-6/12/26
| Rank | State | Change | YLD | YLD-1W |
| 1 | FL | ▲ 28 bps | 3.66% | 3.38% |
| 2 | AL | ▲ 24 bps | 3.81% | 3.57% |
| 3 | WI | ▲ 23 bps | 3.62% | 3.39% |
| 4 | UT | ▲ 21 bps | 3.56% | 3.34% |
| 5 | MO | ▲ 13 bps | 3.71% | 3.59% |
| 6 | CT | ▲ 12 bps | 3.51% | 3.39% |
| 7 | IA | ▲ 12 bps | 3.88% | 3.75% |
| 8 | TN | ▲ 11 bps | 3.54% | 3.43% |
| 9 | NH | ▲ 10 bps | 3.63% | 3.53% |
| 10 | MD | ▲ 10 bps | 3.41% | 3.31% |
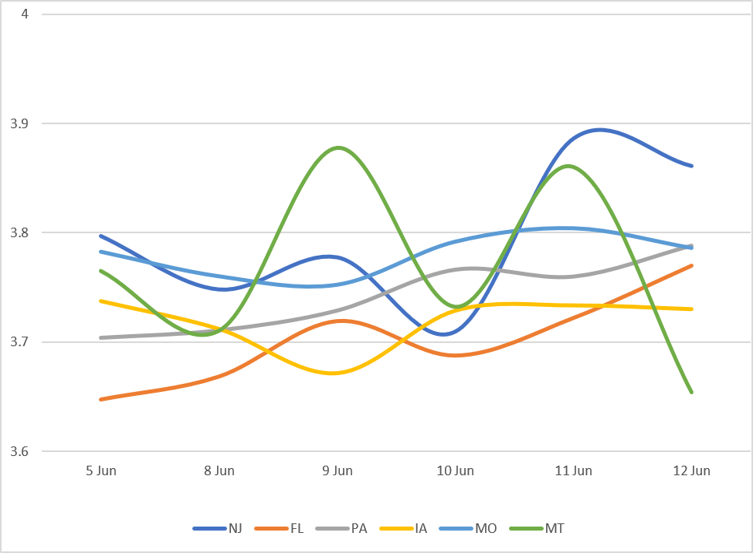
10 Year Yield by State – All
Displays the average Muni 10 year yield by state between 6/5/26-6/12/26 (General Obligation and Revenue Bonds). Results are based on 6 select states, however, we offer data across all 50 states and U.S. territories
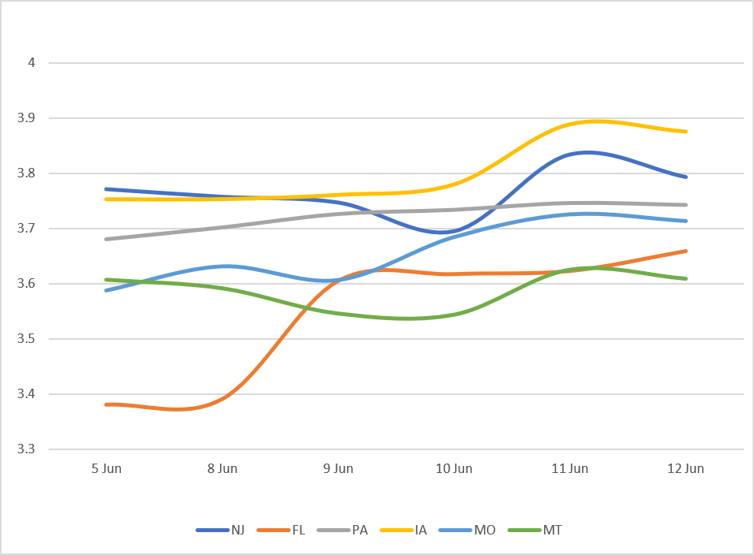
10 Year Yield by State – GO Only
Displays the average Muni 10 year yield by state between 6/5/26-6/12/26 (General Obligation Bonds only). Results are based on 6 select states, however, we offer data across all 50 states and U.S. territories
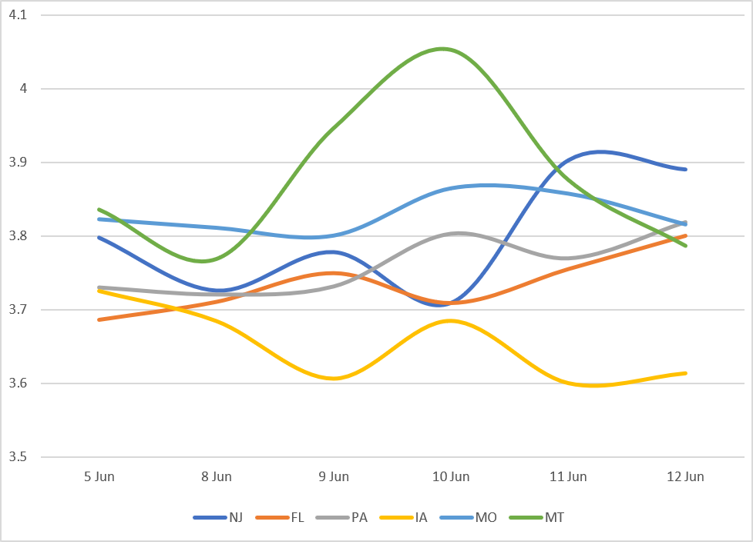
10 Year Yield by State – Rev Only
Displays the average Muni 10 year yield by state between 6/5/26-6/12/26 (Revenue Bonds only). Results are based on 6 select states, however, we offer data across all 50 states and U.S. territories
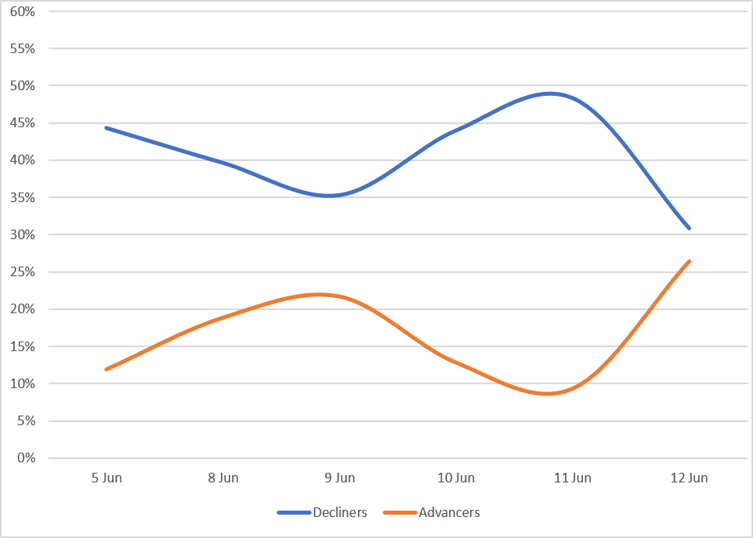
Sentiment
Reveals the percent of Muni bonds increasing in price (advancers) vs. decreasing in price (decliners) between 6/5/26-6/12/26
Top Quote Volume Movers: This Week vs Last Week
Exhibits the Munis with the largest increase in quote volume for the week ending 6/5/26 vs. the week ending 6/12/26
| Rank | Tranche | Coupon | Maturity | Prior Week | This Week | Increase | % Increase |
| 1 | NASHVILLE & DAVIDSON | 5.000% | 01/01/39 | 7 | 93 | ▲ 86 | 1229% |
| 2 | CALIFORNIA ST-REF | 5.000% | 10/01/35 | 15 | 76 | ▲ 61 | 407% |
| 3 | WASHINGTON ST-A-GRP-1 | 5.000% | 08/01/37 | 5 | 55 | ▲ 50 | 1000% |
| 4 | TRIBOROUGH BRIDGE-A-2 | 5.000% | 11/15/35 | 37 | 85 | ▲ 48 | 130% |
| 5 | NORTHSIDE ISD-REF | 4.375% | 08/15/56 | 7 | 55 | ▲ 48 | 686% |
| 6 | VA PUB BLDG AUTH-A | 5.000% | 08/01/41 | 119 | 165 | ▲ 46 | 39% |
| 7 | OH ST WATER DEV AUTH | 5.000% | 12/01/35 | 66 | 110 | ▲ 44 | 67% |
| 8 | MET TRANSPRTN-B-1 | 5.000% | 11/15/52 | 22 | 65 | ▲ 43 | 195% |
| 9 | NYC TRANS FIN AUTH | 5.000% | 07/15/34 | 20 | 60 | ▲ 40 | 200% |
| 10 | TX TRANSPRTN COMM-C-R | 5.000% | 08/15/34 | 8 | 47 | ▲ 39 | 488% |
Most Quoted Munis
Ranks the Munis that were quoted by the highest number of dealers between 6/5/26-6/12/26
| Rank | Tranche | Coupon | Maturity | Dealers |
| 1 | NEW BRAUNFELS-REF-REV | 4.500% | 07/01/56 | 39 |
| 2 | NASHVILLE & DAVIDSON | 5.000% | 01/01/35 | 38 |
| 3 | AUSTIN-B-REV-AMT | 5.000% | 11/15/56 | 37 |
| 4 | N TEXAS MUNI WTR DT | 5.000% | 09/01/55 | 37 |
| 5 | CHICAGO-A-REV | 5.000% | 11/01/64 | 36 |
| 6 | VA PUB BLDG AUTH-A | 5.000% | 08/01/41 | 33 |
| 7 | BLACK BELT ENERGY-E | 5.000% | 07/01/33 | 33 |
| 8 | CONNECTICUT ST-A | 5.000% | 09/15/33 | 32 |
| 9 | NY ST TWY AUTH-A | 5.000% | 03/15/53 | 31 |
| 10 | PA ECO DEV FING-A | 5.000% | 12/15/56 | 31 |
Related Resources
About SOLVE
SOLVE is the leading market data platform provider for fixed-income securities, trusted by sophisticated buy-side and sell-side firms worldwide. Founded in 2011, SOLVE leverages its AI-driven technology and deep industry expertise to offer unparalleled transparency into markets, reduce risk, and save hundreds of hours across front-office workflows. With the largest real-time datasets for Securitized Products, Municipal Bonds, Corporate Bonds, Syndicated Bank Loans, Convertible Bonds, CDS, and Private Credit, SOLVE empowers clients to transform the way they bring new securities to market, trade on secondary markets, and value highly illiquid securities. Headquartered in Connecticut, with offices across the globe, SOLVE is the definitive source for market pricing in fixed-income markets.
