Municipal Bond Market Summary – Week Ending 2/13/26
Our newsletter presents key trends derived from observable Municipal Bond pricing data over a weekly period.
Top 10 Performers
Showcases the top 10 Muni Bond performers based on price movements between 2/6/26-2/13/26
| Rank | Bond Name | Coupon | Maturity | Dealers |
| 1 | SACRAMENTO USD-C | 5.50% | 08/01/2054 | 17 |
| 2 | KINGS CANYON JT USD-B | 0.00% | 08/01/2039 | 16 |
| 3 | NEW YORK CITY NY TRAN | 3.58% | 08/01/2032 | 3 |
| 4 | PENNSYLVANIA ST UNIV | 2.79% | 09/01/2043 | 6 |
| 5 | MO ST HSG DEV COMM-A | 3.13% | 11/01/2042 | 2 |
| 6 | MIDLAND CO-REF | 3.00% | 09/01/2048 | 2 |
| 7 | MA HSG FIN AGY-222-RE | 2.38% | 12/01/2043 | 2 |
| 8 | UNIV CA TAXABLE-GEN- | 4.86% | 05/15/2012 | 10 |
| 9 | ALBANY CAP RES CORP-D | 4.00% | 11/01/2051 | 2 |
| 10 | SAN ANTONIO-B-WTR | 4.00% | 05/15/2045 | 6 |
Bottom 10 Performers
Showcases the bottom 10 Muni Bond performers based on price movements between 2/6/26-2/13/26
| Rank | Bond Name | Coupon | Maturity | Change | PRC | PRC-1W | Dealers |
| 1 | CALIFORNIA ST MUNI FI | 5.25% | 11/01/2052 | ▼ -2.44% | 101.49 | 104.02 | 2 |
| 2 | WSTRN CAROLINA UNIV | 3.63% | 10/01/2047 | ▼ -2.31% | 86.16 | 88.19 | 2 |
| 3 | WHITE OAK BORO PA | 3.00% | 11/15/2033 | ▼ -2.09% | 98.00 | 100.09 | 2 |
| 4 | SAN MATEO CA UN HIGH | 0.00% | 09/01/2041 | ▼ -2.01% | 107.08 | 109.28 | 3 |
| 5 | UNIV OF NC BRD GOVERN | 3.00% | 02/01/2039 | ▼ -1.65% | 91.78 | 93.32 | 2 |
| 6 | CA MUNI FIN AUTH-A | 3.60% | 11/01/2034 | ▼ -1.63% | 103.76 | 105.48 | 4 |
| 7 | NY ST HSG FIN AGY-C-1 | 4.75% | 11/01/2059 | ▼ -1.53% | 98.84 | 100.37 | 22 |
| 8 | CAPITAL TRUST AUTH-A | 5.00% | 06/01/2064 | ▼ -1.51% | 90.53 | 91.93 | 17 |
| 9 | CO HLTH FACS AUTH-BAM | 4.00% | 08/01/2049 | ▼ -1.51% | 89.40 | 90.77 | 11 |
| 10 | WASHINGTON SUBN SAN | 4.00% | 06/15/2047 | ▼ -1.37% | 98.09 | 99.45 | 2 |
Top 10 State Performers
Showcases the top 10 Muni State performers based on yield movements between 2/6/26-2/13/26
| Rank | State | Change | YLD | YLD-1W |
| 1 | SC | ▼ 19 bps | 3.22% | 3.41% |
| 2 | DE | ▼ 13 bps | 2.86% | 2.99% |
| 3 | NJ | ▼ 12 bps | 3.18% | 3.31% |
| 4 | IN | ▼ 12 bps | 3.21% | 3.33% |
| 5 | AL | ▼ 11 bps | 3.46% | 3.56% |
| 6 | ME | ▼ 10 bps | 3.20% | 3.30% |
| 7 | MS | ▼ 10 bps | 3.45% | 3.55% |
| 8 | SD | ▼ 7 bps | 3.21% | 3.28% |
| 9 | OH | ▼ 7 bps | 3.27% | 3.34% |
| 10 | AZ | ▼ 6 bps | 3.25% | 3.31% |
Bottom 10 State Performers
Showcases the bottom 10 Muni State performers based on yield movements between 2/6/26-2/13/26
| Rank | State | Change | YLD | YLD-1W |
| 1 | KY | ▲ 11 bps | 3.53% | 3.43% |
| 2 | DC | ▲ 9 bps | 3.24% | 3.15% |
| 3 | WV | ▲ 9 bps | 3.64% | 3.55% |
| 4 | VT | ▲ 7 bps | 3.25% | 3.18% |
| 5 | NC | ▲ 5 bps | 3.03% | 2.98% |
| 6 | CT | ▲ 4 bps | 3.27% | 3.22% |
| 7 | RI | ▲ 4 bps | 3.11% | 3.07% |
| 8 | KS | ▲ 4 bps | 3.33% | 3.29% |
| 9 | NH | ▲ 3 bps | 3.15% | 3.12% |
| 10 | HI | ▲ 2 bps | 3.32% | 3.30% |
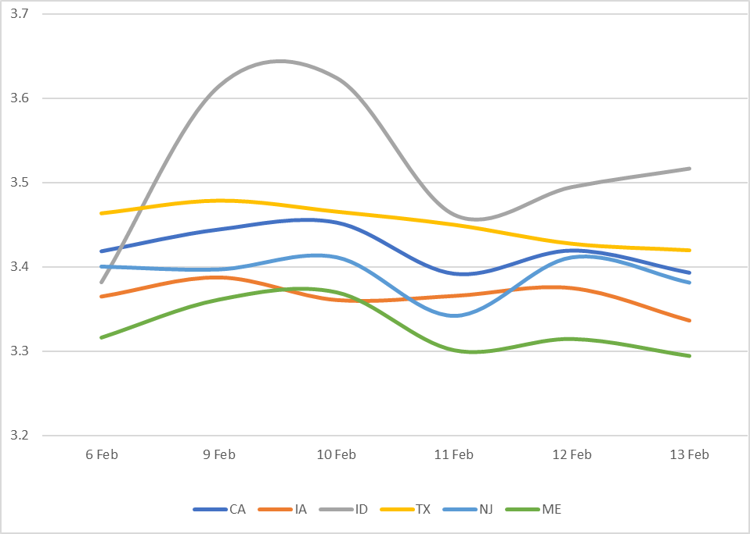
10 Year Yield by State – All
Displays the average Muni 10 year yield by state between 2/6/26-2/13/26 (General Obligation and Revenue Bonds). Results are based on 6 select states, however, we offer data across all 50 states and U.S. territories
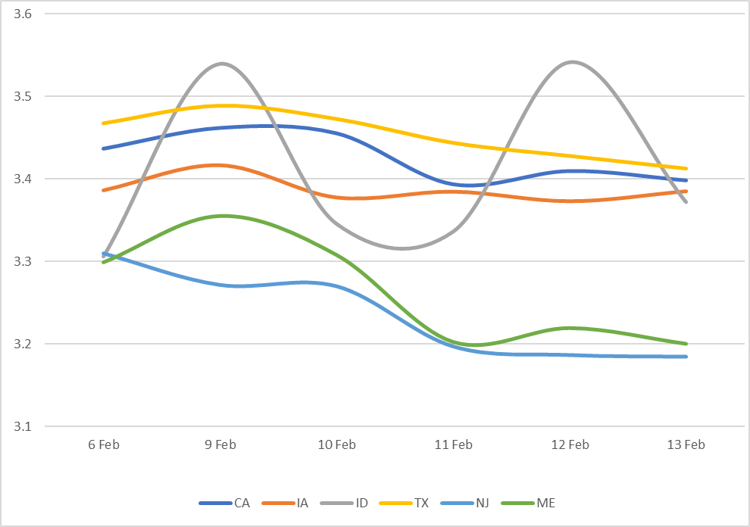
10 Year Yield by State – GO Only
Displays the average Muni 10 year yield by state between 2/6/26-2/13/26 (General Obligation Bonds only). Results are based on 6 select states, however, we offer data across all 50 states and U.S. territories
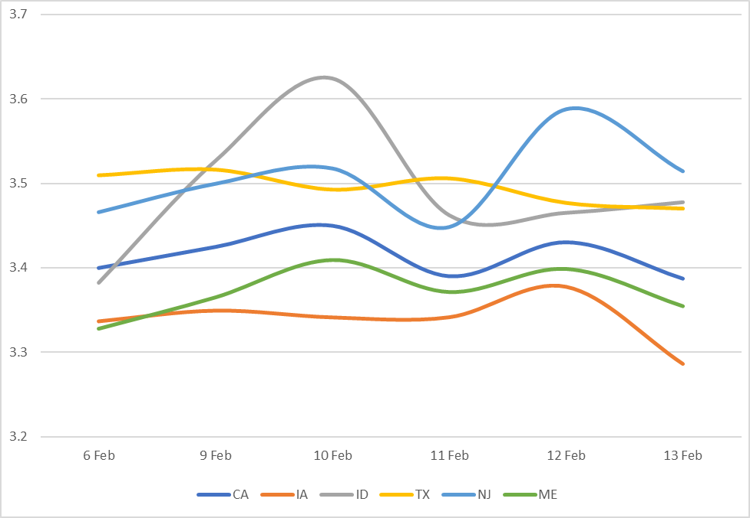
10 Year Yield by State – Rev Only
Displays the average Muni 10 year yield by state between 2/6/26-2/13/26 (Revenue Bonds only). Results are based on 6 select states, however, we offer data across all 50 states and U.S. territories
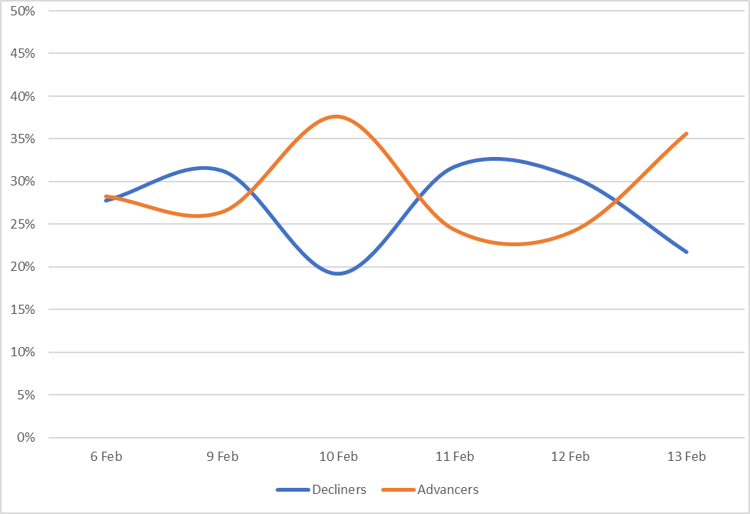
Sentiment
Reveals the percent of Muni bonds increasing in price (advancers) vs. decreasing in price (decliners) between 2/6/26-2/13/26
Top Quote Volume Movers: This Week vs Last Week
Exhibits the Munis with the largest increase in quote volume for the week ending 2/6/26 vs. the week ending 2/13/26
| Rank | Tranche | Coupon | Maturity | Prior Week | This Week | Increase | % Increase |
| 1 | ENERGY SOUTHEAST-A | 5.000% | 11/01/35 | 107 | 226 | 119 | 111% |
| 2 | N CAROLINA HSG FIN#48 | 3.500% | 07/01/42 | 4 | 97 | 93 | 2325% |
| 3 | SOUTHEAST ENERGY-H | 5.000% | 11/01/35 | 121 | 207 | 86 | 71% |
| 4 | CONROE ISD-A | 4.000% | 02/15/47 | 25 | 109 | 84 | 336% |
| 5 | LEHIGH CO AUTH-REF | 4.000% | 12/01/45 | 6 | 89 | 83 | 1383% |
| 6 | NORWALK-LA MIRADA CA | 4.000% | 08/01/48 | 11 | 92 | 81 | 736% |
| 7 | NEW YORK ST DORM AUTH | 4.000% | 07/01/50 | 20 | 98 | 78 | 390% |
| 8 | OKLAHOMA WTR RESOURCE | 4.000% | 10/01/43 | 19 | 95 | 76 | 400% |
| 9 | MANSFIELD ISD | 4.000% | 02/15/54 | 42 | 116 | 74 | 176% |
| 10 | ENERGY N W WA-SER A | 5.000% | 07/01/41 | 29 | 102 | 73 | 252% |
Most Quoted Munis
Ranks the Munis that were quoted by the highest number of dealers between 2/6/26-2/13/26
| Rank | Tranche | Coupon | Maturity | Dealers |
| 1 | NY TRANSITIONAL FIN-B | 5.250% | 05/01/48 | 60 |
| 2 | NY TRANSITIONAL FIN-B | 5.000% | 05/01/51 | 60 |
| 3 | TX WTR DEV BRD | 4.750% | 10/15/55 | 58 |
| 4 | BLACK BELT ENERGY GAS | 5.000% | 12/01/35 | 57 |
| 5 | KY PUB ENERGY AUTH-C | 5.000% | 05/01/36 | 55 |
| 6 | NEW YORK-D | 5.250% | 10/01/51 | 53 |
| 7 | NY ST THRUWAY AUTH-A | 5.000% | 01/01/35 | 52 |
| 8 | PROSPER ISD-REF | 5.250% | 02/15/55 | 51 |
| 9 | BOYS TWN VLG -REV | 5.250% | 07/01/55 | 51 |
| 10 | SAN DIEGO UNIF SD-C-3 | 5.000% | 07/01/50 | 49 |
Related Resources
About SOLVE
SOLVE is the leading market data platform provider for fixed-income securities, trusted by sophisticated buy-side and sell-side firms worldwide. Founded in 2011, SOLVE leverages its AI-driven technology and deep industry expertise to offer unparalleled transparency into markets, reduce risk, and save hundreds of hours across front-office workflows. With the largest real-time datasets for Securitized Products, Municipal Bonds, Corporate Bonds, Syndicated Bank Loans, Convertible Bonds, CDS, and Private Credit, SOLVE empowers clients to transform the way they bring new securities to market, trade on secondary markets, and value highly illiquid securities. Headquartered in Connecticut, with offices across the globe, SOLVE is the definitive source for market pricing in fixed-income markets.
