Syndicated Bank Loan Market Summary – Week Ending 10/10/25
Weekly Syndicated Bank Loan Market Summary
Our newsletter presents key trends derived from observable Syndicated Bank Loan pricing data over a weekly period.
New Issues
Loans issued during the week ending 10/10/25
| Issuer | Amount (MM) | Loan Type | Maturity | Rate |
| Pro Mach Group Inc. | 2193 | Term Loan | 10/9/2032 | S+275 |
| ConvergeOne Hldgs Corp. | 1069 | Term Loan | 1/28/2026 | S+500 |
| Aptean Inc. | 50 | Term Loan | 2/18/2030 | S+550 |
| Viasat Inc. | 369 | Term Loan | 10/15/2025 | S+200 |
Forward Calendar
Forward calendar during the week ending 10/10/25
| Issuer | Deal Information | Banks | Expected Issue Date |
| Bally’s Corp. | $600MM TLB | DB | Q4 2025 |
| Calabrio Inc. | $1.5B TL | SD | Q4 2025 |
| Pacific Bells LLC | $586.8MM TLB | CTZ | Q4 2025 |
Largest Loans
Highlights the weekly price movements and quote depth for the 20 largest bank loans between 10/3/25-10/10/25
| Rank | Size (MM) | Name | Change | PRC | PRC-1W | Dealers |
| 1 | 6,272 | UKG INC (USD) TL S+250 2/9/2031 | ▼ -0.25% | 99.63 | 99.88 | 15 |
| 2 | 6,145 | MAGNOLIA (USD) TL L+375 2/1/2028 | ▼ -0.50% | 83.73 | 84.15 | 15 |
| 3 | 5,621 | SOLAREDGE TECHS INC (USD) TL B S+250 7/31/2031 | ▼ -0.27% | 99.58 | 99.84 | 11 |
| 4 | 5,080 | ALLIED UNIVERSAL HOLDCO LLC (USD) TL B S+325 8/5/2032 | ▼ -0.41% | 99.89 | 100.29 | 17 |
| 5 | 4,750 | ZAYO (USD) TL L+300 3/9/2027 | ▼ -3.20% | 95.27 | 98.42 | 12 |
| 6 | 4,741 | INTERNET BRANDS (USD) TL B S+425 4/20/2028 | ▼ -2.22% | 92.09 | 94.18 | 12 |
| 7 | 4,664 | PROOFPOINT (USD) TL B S+300 8/31/2028 | ▼ -0.25% | 99.92 | 100.17 | 13 |
| 8 | 4,300 | MASMOVIL IBERCOM SA (EUR) TL B E+275 3/20/2031 | ▼ -0.25% | 99.59 | 99.84 | 14 |
| 9 | 4,230 | TK ELEVATOR (US) NEWCO INC TL B | ▼ -0.17% | 100.08 | 100.25 | 15 |
| 10 | 4,226 | INSPIRE BRANDS (USD) TL B S+250 12/15/2027 | ▼ -0.13% | 99.86 | 99.99 | 14 |
| 11 | 4,204 | JANE STREET (USD) TL B S+200 12/10/2031 | ▼ -0.68% | 98.42 | 99.10 | 18 |
| 12 | 4,074 | MEDLINE BORROWER LP (USD) TL B S+200 10/23/2028 | ▼ -0.14% | 99.86 | 100.00 | 13 |
| 13 | 4,001 | CITADEL (USD) TL B S+200 10/28/2031 | ▼ -0.26% | 99.88 | 100.14 | 14 |
| 14 | 3,935 | SS&C TECHS INC (USD) TL B8 S+200 5/2/2031 | ▼ -0.21% | 99.98 | 100.19 | 16 |
| 15 | 3,914 | BROADSTREET PARTNERS INC (USD) TL B S+275 6/16/2031 | ▼ -0.33% | 99.70 | 100.03 | 17 |
| 16 | 3,900 | DIRECTV FNCG LLC (USD) TL L+500 8/2/2027 | 0.00% | 100.00 | 100.00 | 13 |
| 17 | 3,830 | ALLIANT HLDGS INTERMEDIATE LLC (USD) TL B S+250 9/19/2031 | ▼ -0.33% | 99.32 | 99.65 | 19 |
| 18 | 3,640 | TRANSDIGM INC (USD) TL J S+250 2/12/2031 | ▼ -0.14% | 99.74 | 99.88 | 16 |
| 19 | 3,600 | GLOBAL MEDICAL RESPONSE INC (USD) TL S+350 9/10/2032 | ▼ -0.12% | 99.81 | 99.93 | 10 |
| 20 | 3,573 | CDK GLOBAL (USD) TL B S+325 7/6/2029 | ▼ -3.15% | 83.30 | 86.01 | 16 |
| Average | -0.65% | 97.48 | 99.91 | 14.5 | ||
Top 10 Performers
Showcases the top 10 loan performers based on the largest bid price increases between 10/3/25-10/10/25
| Rank | Name | Change | PRC | PRC-1W | Dealers |
| 1 | NOVAFR (EUR) TL B E+450 12/17/2028 | ▲ 7.33% | 53.29 | 49.65 | 12 |
| 2 | LOGOPLASTE (EUR) TL B E+375 7/7/2028 | ▲ 4.32% | 92.01 | 88.21 | 13 |
| 3 | LIBERTY LATIN AMERICA (USD) TL B L+375 10/16/2028 | ▲ 3.51% | 59.98 | 57.94 | 6 |
| 4 | SOLMAX (USD) TL L+475 5/29/2028 | ▲ 2.17% | 77.96 | 76.31 | 9 |
| 5 | TELESAT CANADA (USD) TL B5 L+275 12/7/2026 | ▲ 0.68% | 79.95 | 79.42 | 7 |
| 6 | AMEDES GROUP (EUR) TL B E+375 10/12/2028 | ▲ 0.40% | 81.71 | 81.38 | 13 |
| 7 | OSMOSE (USD) TL L+325 6/23/2028 | ▲ 0.40% | 95.07 | 94.70 | 6 |
| 8 | CP ATLAS BUYER INC TL B | ▲ 0.38% | 98.42 | 98.05 | 5 |
| 9 | INMARSAT (USD) TL B S+450 9/13/2029 | ▲ 0.16% | 98.92 | 98.76 | 11 |
| 10 | BRIGHTSPEED TL | ▲ 0.16% | 92.32 | 92.17 | 9 |
Bottom 10 Performers
Showcases the bottom 10 loan performers based on the largest bid price decreases between 10/3/25-10/10/25
| Rank | Name | Change | PRC | PRC-1W | Dealers |
| 1 | POLYGON INTERNATIONAL (EUR) TL B E+400 10/30/2028 | ▼ 10.43% | 76.04 | 84.89 | 10 |
| 2 | STYROLUTION (EUR) TL B E+425 10/7/2031 | ▼ 10.21% | 81.64 | 90.91 | 13 |
| 3 | CONSOLIDATED ENERGY FIN SA (USD) TL B S+450 11/8/2030 | ▼ 9.17% | 83.87 | 92.34 | 10 |
| 4 | INEOS FIN PLC (USD) TL B S+300 2/7/2031 | ▼ 7.76% | 82.55 | 89.49 | 12 |
| 5 | TRONOX INC (USD) TL B S+250 9/18/2031 | ▼ 6.99% | 74.27 | 79.85 | 14 |
| 6 | TWIN RIVER (USD) TL B L+325 10/2/2028 | ▼ 6.80% | 90.23 | 96.81 | 10 |
| 7 | BRAND INDL SERVS INC (USD) TL B S+450 8/1/2030 | ▼ 4.48% | 85.97 | 90.00 | 14 |
| 8 | AMMERAAL BELTECH (EUR) TL B2 E+500 12/19/2028 | ▼ 4.14% | 88.75 | 92.58 | 11 |
| 9 | CRH EUROPE (EUR) TL B E+475 12/28/2029 | ▼ 3.92% | 79.96 | 83.23 | 13 |
| 10 | CDK GLOBAL (USD) TL B S+325 7/6/2029 | ▼ 3.15% | 83.30 | 86.01 | 16 |
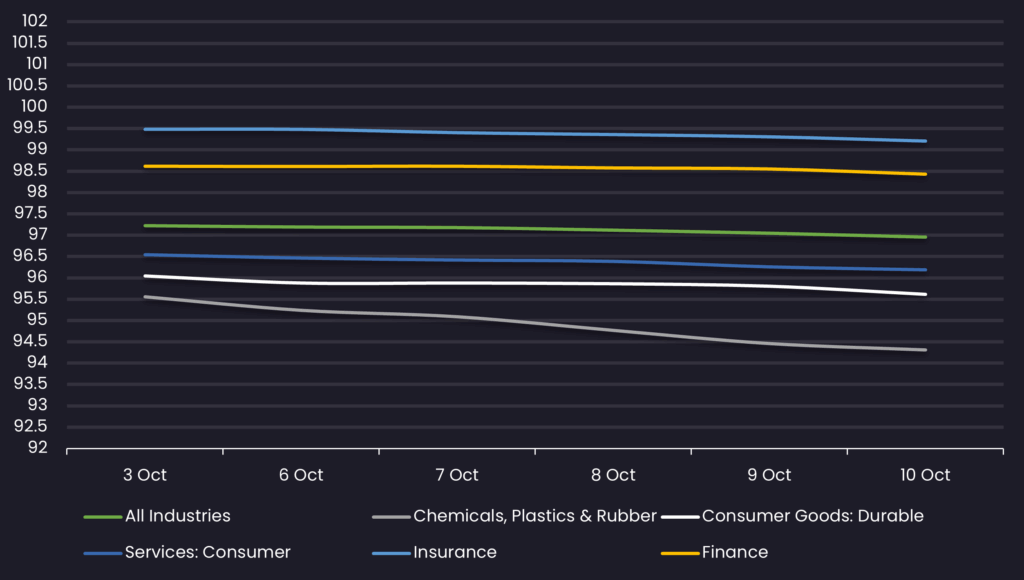
Avg Bid PX by Sector
Displays the average loan bid price by sector between 10/3/25-10/10/25 Results are based on 5 select industry sectors, however, we offer data across 36 sectors
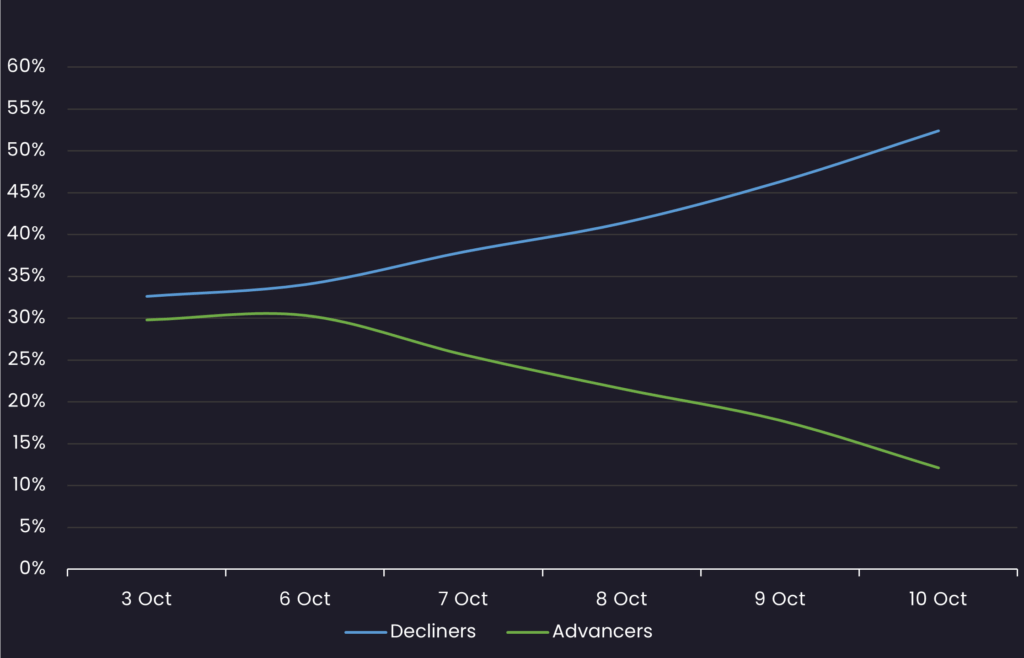
Sentiment
Reveals the percent of loans increasing in price (advancers) vs. loans decreasing in price (decliners) between 10/3/25-10/10/25
Top Quote Volume Movers: This Week vs Last Week
Exhibits the loans with the largest increase in quote volume for the week ending 10/3/25 vs. the week ending 10/10/25
| Rank | Tranche | Prior Week | This Week | Increase | % Increase |
| 1 | DIVERSITECH (USD) TL B S+325 12/22/2031 | 30 | 56 | 26 | ▲ 87% |
| 2 | HUSKY INJECTION MOLDING (USD) TL B S+400 2/15/2029 | 24 | 48 | 24 | ▲ 100% |
| 3 | ZAYO (USD) TL S+350 3/11/2030 | 18 | 40 | 22 | ▲ 122% |
| 4 | BISON MIDSTREAM (USD) TL B S+250 2/11/2030 | 28 | 48 | 20 | ▲ 71% |
| 5 | INTL GAME TECH PLC (USD) TL B S+475 7/1/2032 | 82 | 101 | 19 | ▲ 23% |
| 6 | GLOBAL MEDICAL RESPONSE INC (USD) TL S+350 9/10/2032 | 30 | 48 | 18 | ▲ 60% |
| 7 | ACTION NEDERLAND (USD) TL B S+225 9/11/2032 | 24 | 40 | 16 | ▲ 67% |
| 8 | NUMERICABLE (EUR) TL B11 E+300 6/22/2025 | 14 | 30 | 16 | ▲ 114% |
| 9 | ALTICE (FR) SA (EUR) TL B14 E+550 8/25/2028 | 0 | 16 | 16 | NA |
| 10 | TENNECO INC (USD) TL A S+475 11/17/2028 | 34 | 49 | 15 | ▲ 44% |
Most Quoted Loans
Ranks the loans that were quoted by the highest number of dealers between 10/3/25-10/10/25
| Rank | Tranche | Dealers |
| 1 | ALLIANT HLDGS INTERMEDIATE LLC (USD) TL B S+250 9/19/2031 | 19 |
| 2 | HUB INTL LTD (USD) TL B S+250 6/20/2030 | 19 |
| 3 | AMWINS GROUP INC (USD) TL B S+225 1/23/2032 | 19 |
| 4 | INTL GAME TECH PLC (USD) TL B S+475 7/1/2032 | 19 |
| 5 | FERTITTA ENTERTAINMENT LLC (USD) TL B S+325 1/27/2029 | 18 |
| 6 | WHATABURGER (USD) TL B S+250 8/3/2028 | 18 |
| 7 | BMC SOFTWARE (USD) TL B S+325 7/30/2031 | 18 |
| 8 | GO DADDY OPERATING CO LLC (USD) TL B S+175 11/10/2029 | 18 |
| 9 | NTL CABLE PLC (USD) TL B 3/31/2031 | 18 |
| 10 | FRONERI (USD) TL B S+250 7/17/2032 | 18 |
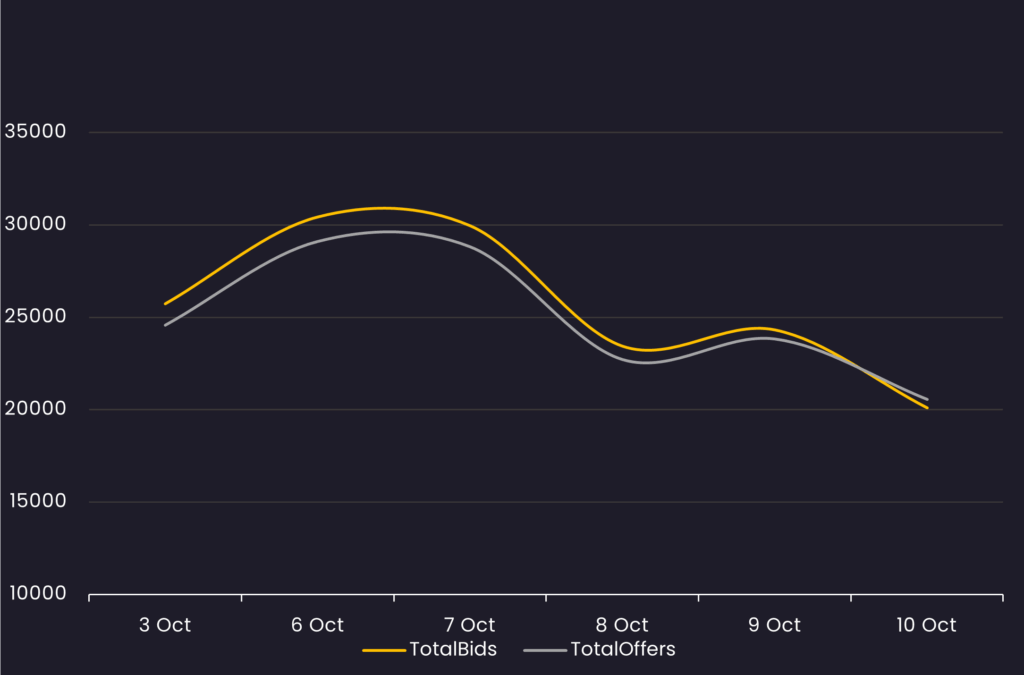
Bid and Offer Volume
Reveals the total number of quotes by bid and offer between 10/3/25-10/10/25
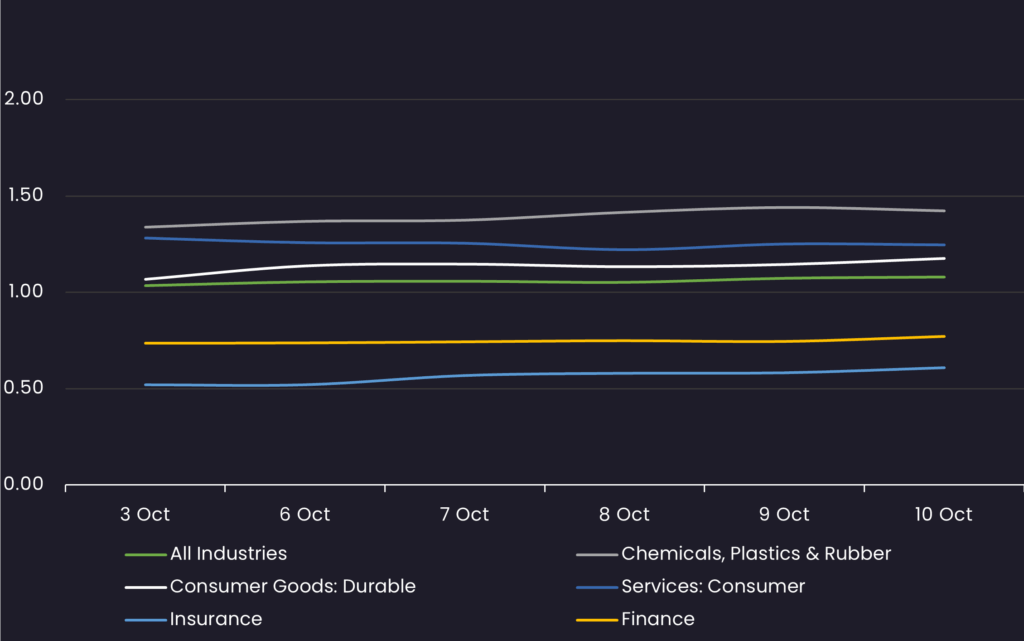
Sector Bid-Offer Spread
Results are based on 5 select industry sectors, however, we offer data across 36 sectors
Related Resources
About SOLVE
SOLVE is the leading market data platform provider for fixed-income securities, trusted by sophisticated buy-side and sell-side firms worldwide. Founded in 2011, SOLVE leverages its AI-driven technology and deep industry expertise to offer unparalleled transparency into markets, reduce risk, and save hundreds of hours across front-office workflows. With the largest real-time datasets for Securitized Products, Municipal Bonds, Corporate Bonds, Syndicated Bank Loans, Convertible Bonds, CDS, and Private Credit, SOLVE empowers clients to transform the way they bring new securities to market, trade on secondary markets, and value highly illiquid securities. Headquartered in Connecticut, with offices across the globe, SOLVE is the definitive source for market pricing in fixed-income markets.
