High Yield Corporate Bond Market Summary – Week Ending 9/19/25
GET OUR CORPORATE MARKET SUMMARIES STRAIGHT TO YOUR INBOX. LEARN MORE
High Yield Corporate Bond Market Summary: Week Ending 9/19/25
Our newsletter presents key trends derived from observable Corporate Bond pricing data over a weekly period.
Forward Calendar
The following are lists of upcoming high-yield corporate bond offerings in the United States
| Issuer | Deal Information | Banks | Expected Issue Date |
|---|---|---|---|
| – | – | – | – |
Top 10 Performers
Showcases the top 10 HY Corp performers based on the largest bid price increases between 9/12/25- 9/19/25
| RANK | BOND NAME | COUPON | MATURITY | CHANGE | PRC | PRC-1W | DEALERS |
|---|---|---|---|---|---|---|---|
| 1 | NFE 12 11/15/2029 144A | 12.00% | 11/15/29 | 19.67% | 32.17 | 26.88 | 22 |
| 2 | GLOBAU 8.75 1/15/2032 | 8.75% | 01/15/32 | 9.47% | 97.37 | 88.95 | 21 |
| 3 | NWDEVL 4.8 PERP | 4.80% | NULL | 8.34% | 32.58 | 30.07 | 15 |
| 4 | UKRAIN 1.75 2/1/2029 REGS | 4.50% | 02/01/29 | 7.81% | 67.10 | 62.25 | 24 |
| 5 | SAGLEN 11 12/15/2029 144A | 11.00% | 12/15/29 | 7.17% | 41.42 | 38.65 | 5 |
| 6 | GLPSP 4.5 PERP | 4.50% | NULL | 6.04% | 69.60 | 65.64 | 14 |
| 7 | ZIP 5 1/15/2030 144A | 5.00% | 01/15/30 | 5.32% | 83.81 | 79.58 | 13 |
| 8 | SPLS 12.75 1/15/2030 144A | 12.75% | 01/15/30 | 5.21% | 76.35 | 72.57 | 21 |
| 9 | KIKCN 10.75 6/30/2032 144A | 10.75% | 06/30/32 | 5.09% | 54.00 | 51.38 | 19 |
| 10 | EHICAR 7 9/21/2026 | 7.00% | 09/21/26 | 4.89% | 76.21 | 72.66 | 17 |
Bottom 10 Performers
Showcases the bottom 10 HY Corp performers based on the largest bid price decreases between 9/12/25 – 9/19/25
| RANK | BOND NAME | COUPON | MATURITY | CHANGE | PRC | PRC-1W | DEALERS |
|---|---|---|---|---|---|---|---|
| 1 | ARGENT 4.25 1/9/2038 | 4.25% | 01/09/38 | -16.03% | 48.69 | 57.98 | 11 |
| 2 | LNZING 5.25 5/15/2029 REGS | 5.25% | 05/15/29 | -12.21% | 51.35 | 58.49 | 16 |
| 3 | CNECN 5.75 11/24/2028 REGS | 5.75% | 11/24/28 | -7.94% | 36.73 | 39.90 | 19 |
| 4 | BUENOS 6.625 9/1/2037 REGS | 6.63% | 09/01/37 | -7.63% | 57.14 | 61.86 | 17 |
| 5 | ECUA 5.5 7/31/2035 REGS | 6.90% | 07/31/35 | -7.01% | 73.17 | 78.69 | 20 |
| 6 | CSCHLD 4.625 12/1/2030 144A | 4.63% | 12/01/30 | -5.68% | 37.56 | 39.82 | 20 |
| 7 | BRASKM 7.125 7/22/2041 144A | 7.13% | 07/22/41 | -5.65% | 59.77 | 63.35 | 22 |
| 8 | TRUK 6.25 2/1/2029 144A | 6.25% | 02/01/29 | -5.45% | 65.13 | 68.88 | 15 |
| 9 | ARGID 4.75 7/15/2027 REGS | 4.75% | 07/15/27 | -5.22% | 30.45 | 32.13 | 16 |
| 10 | TELSAT 5.625 12/6/2026 144A | 5.63% | 12/06/26 | -5.01% | 73.97 | 77.88 | 22 |
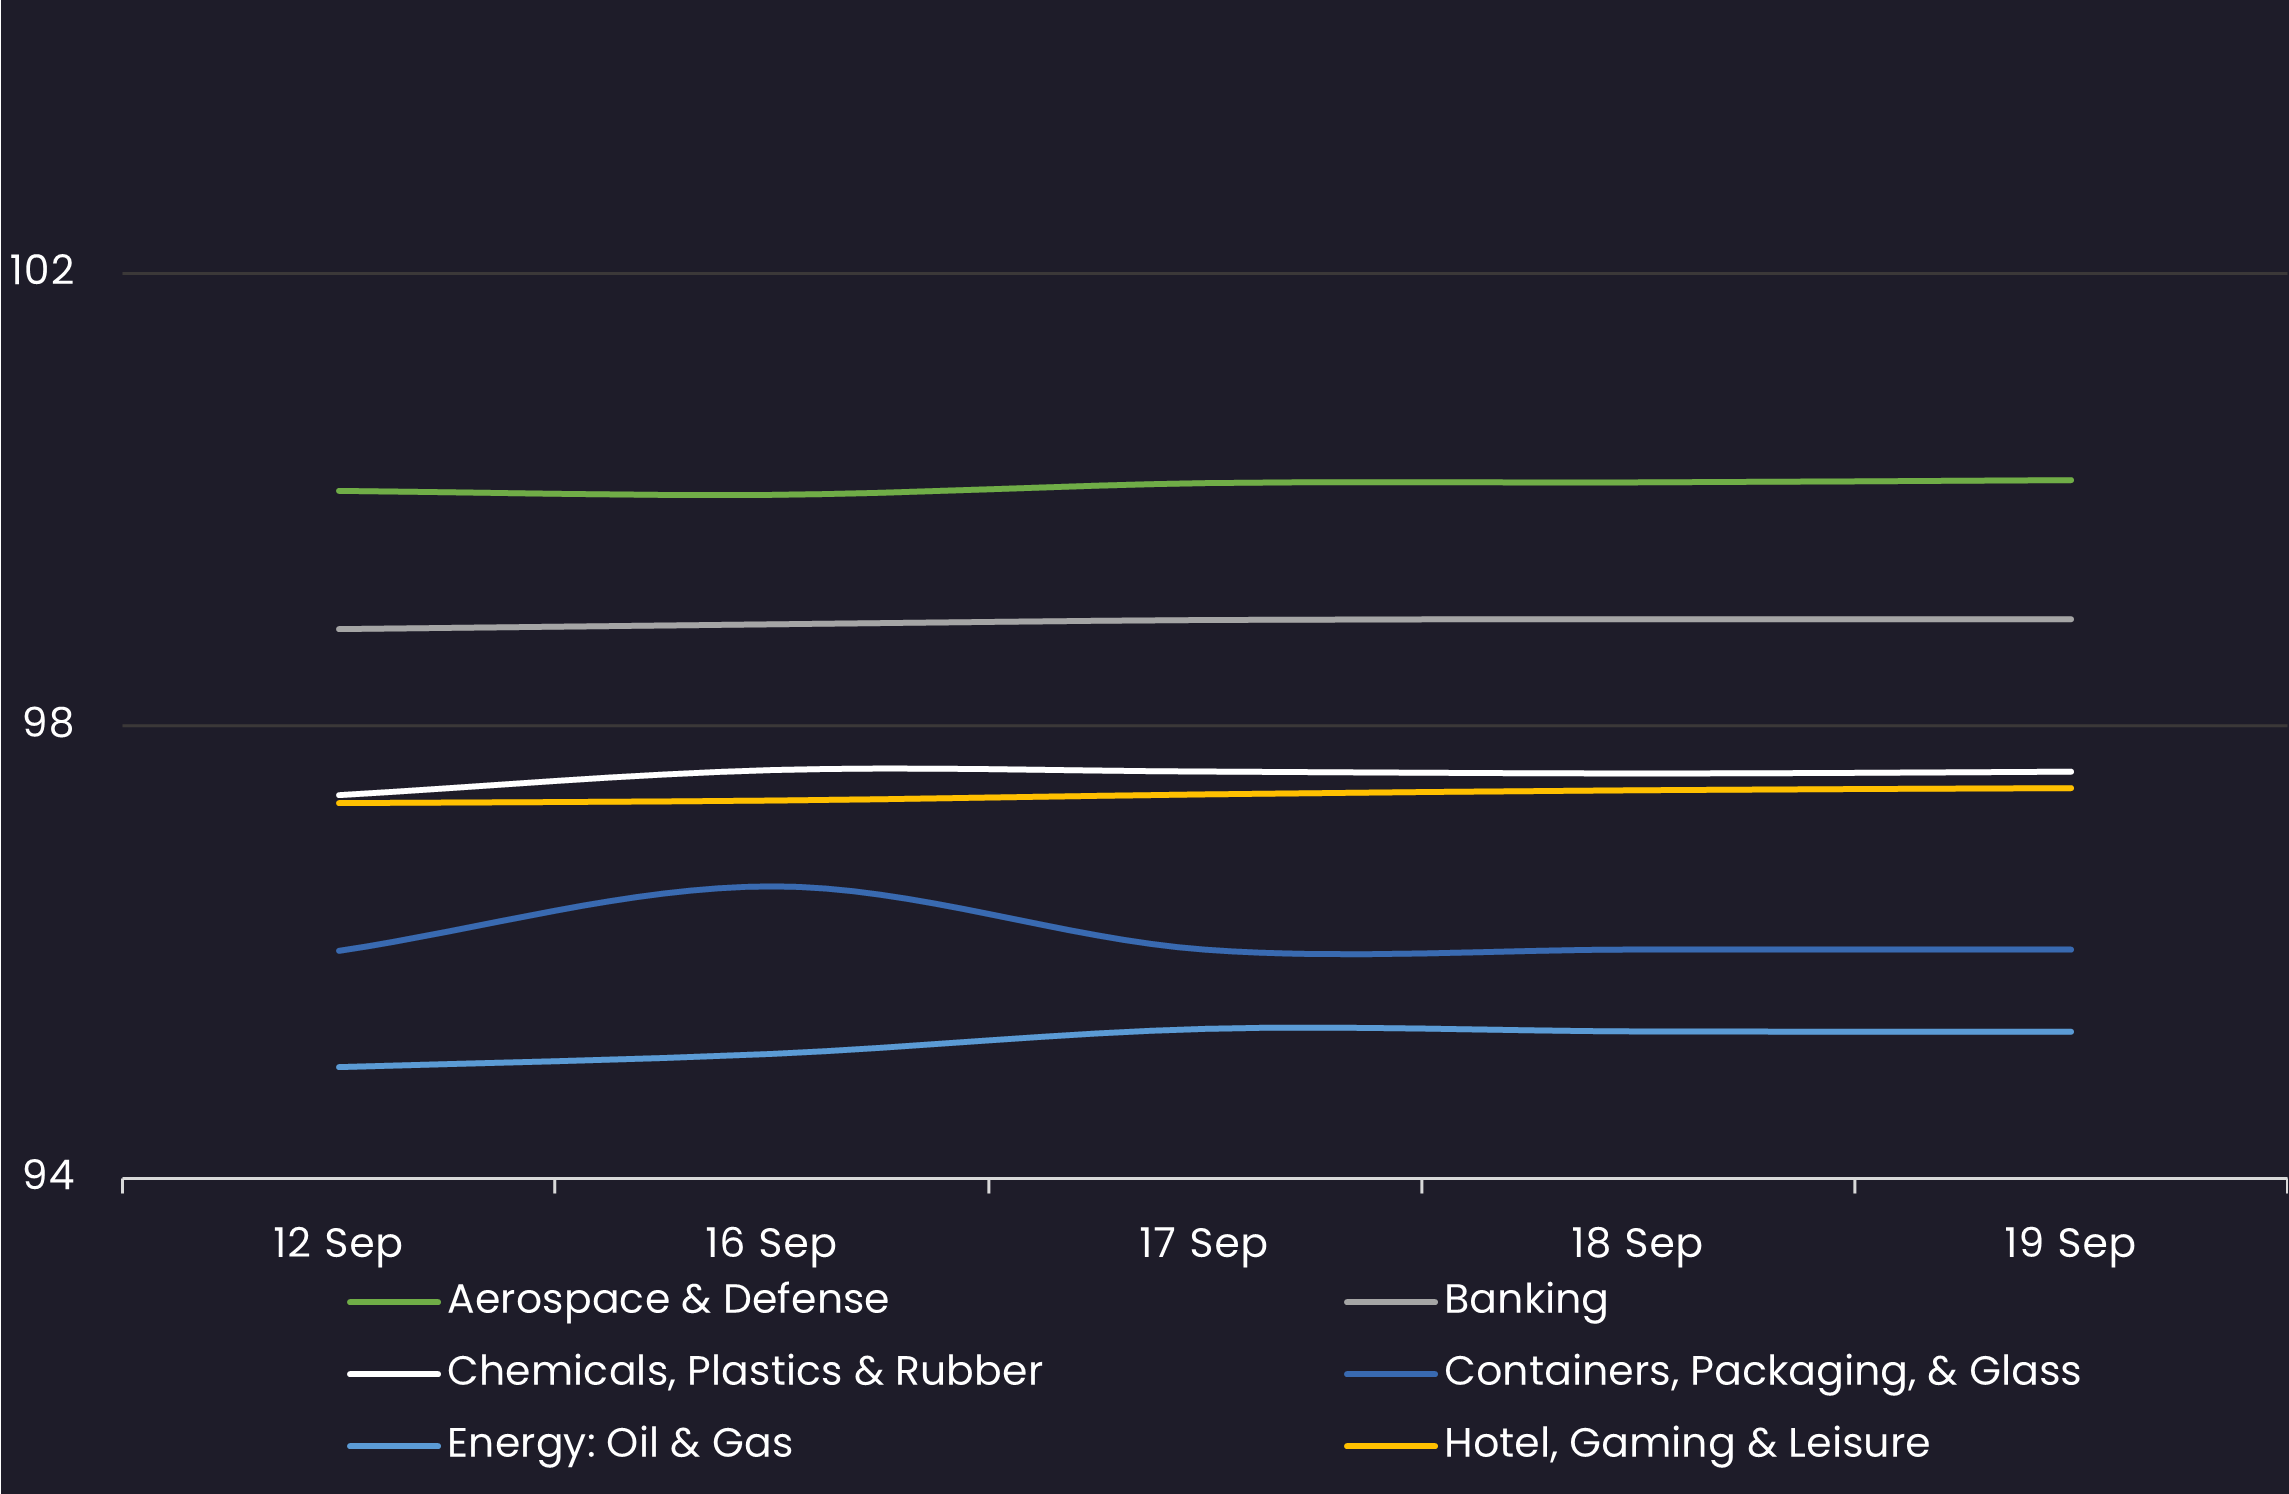
Avg Industry Price
Displays the HY Corp average industry price by sector between 9/12/25 – 9/19/25 Results are based on 5 select industry sectors, however, we offer data across 36 sectors
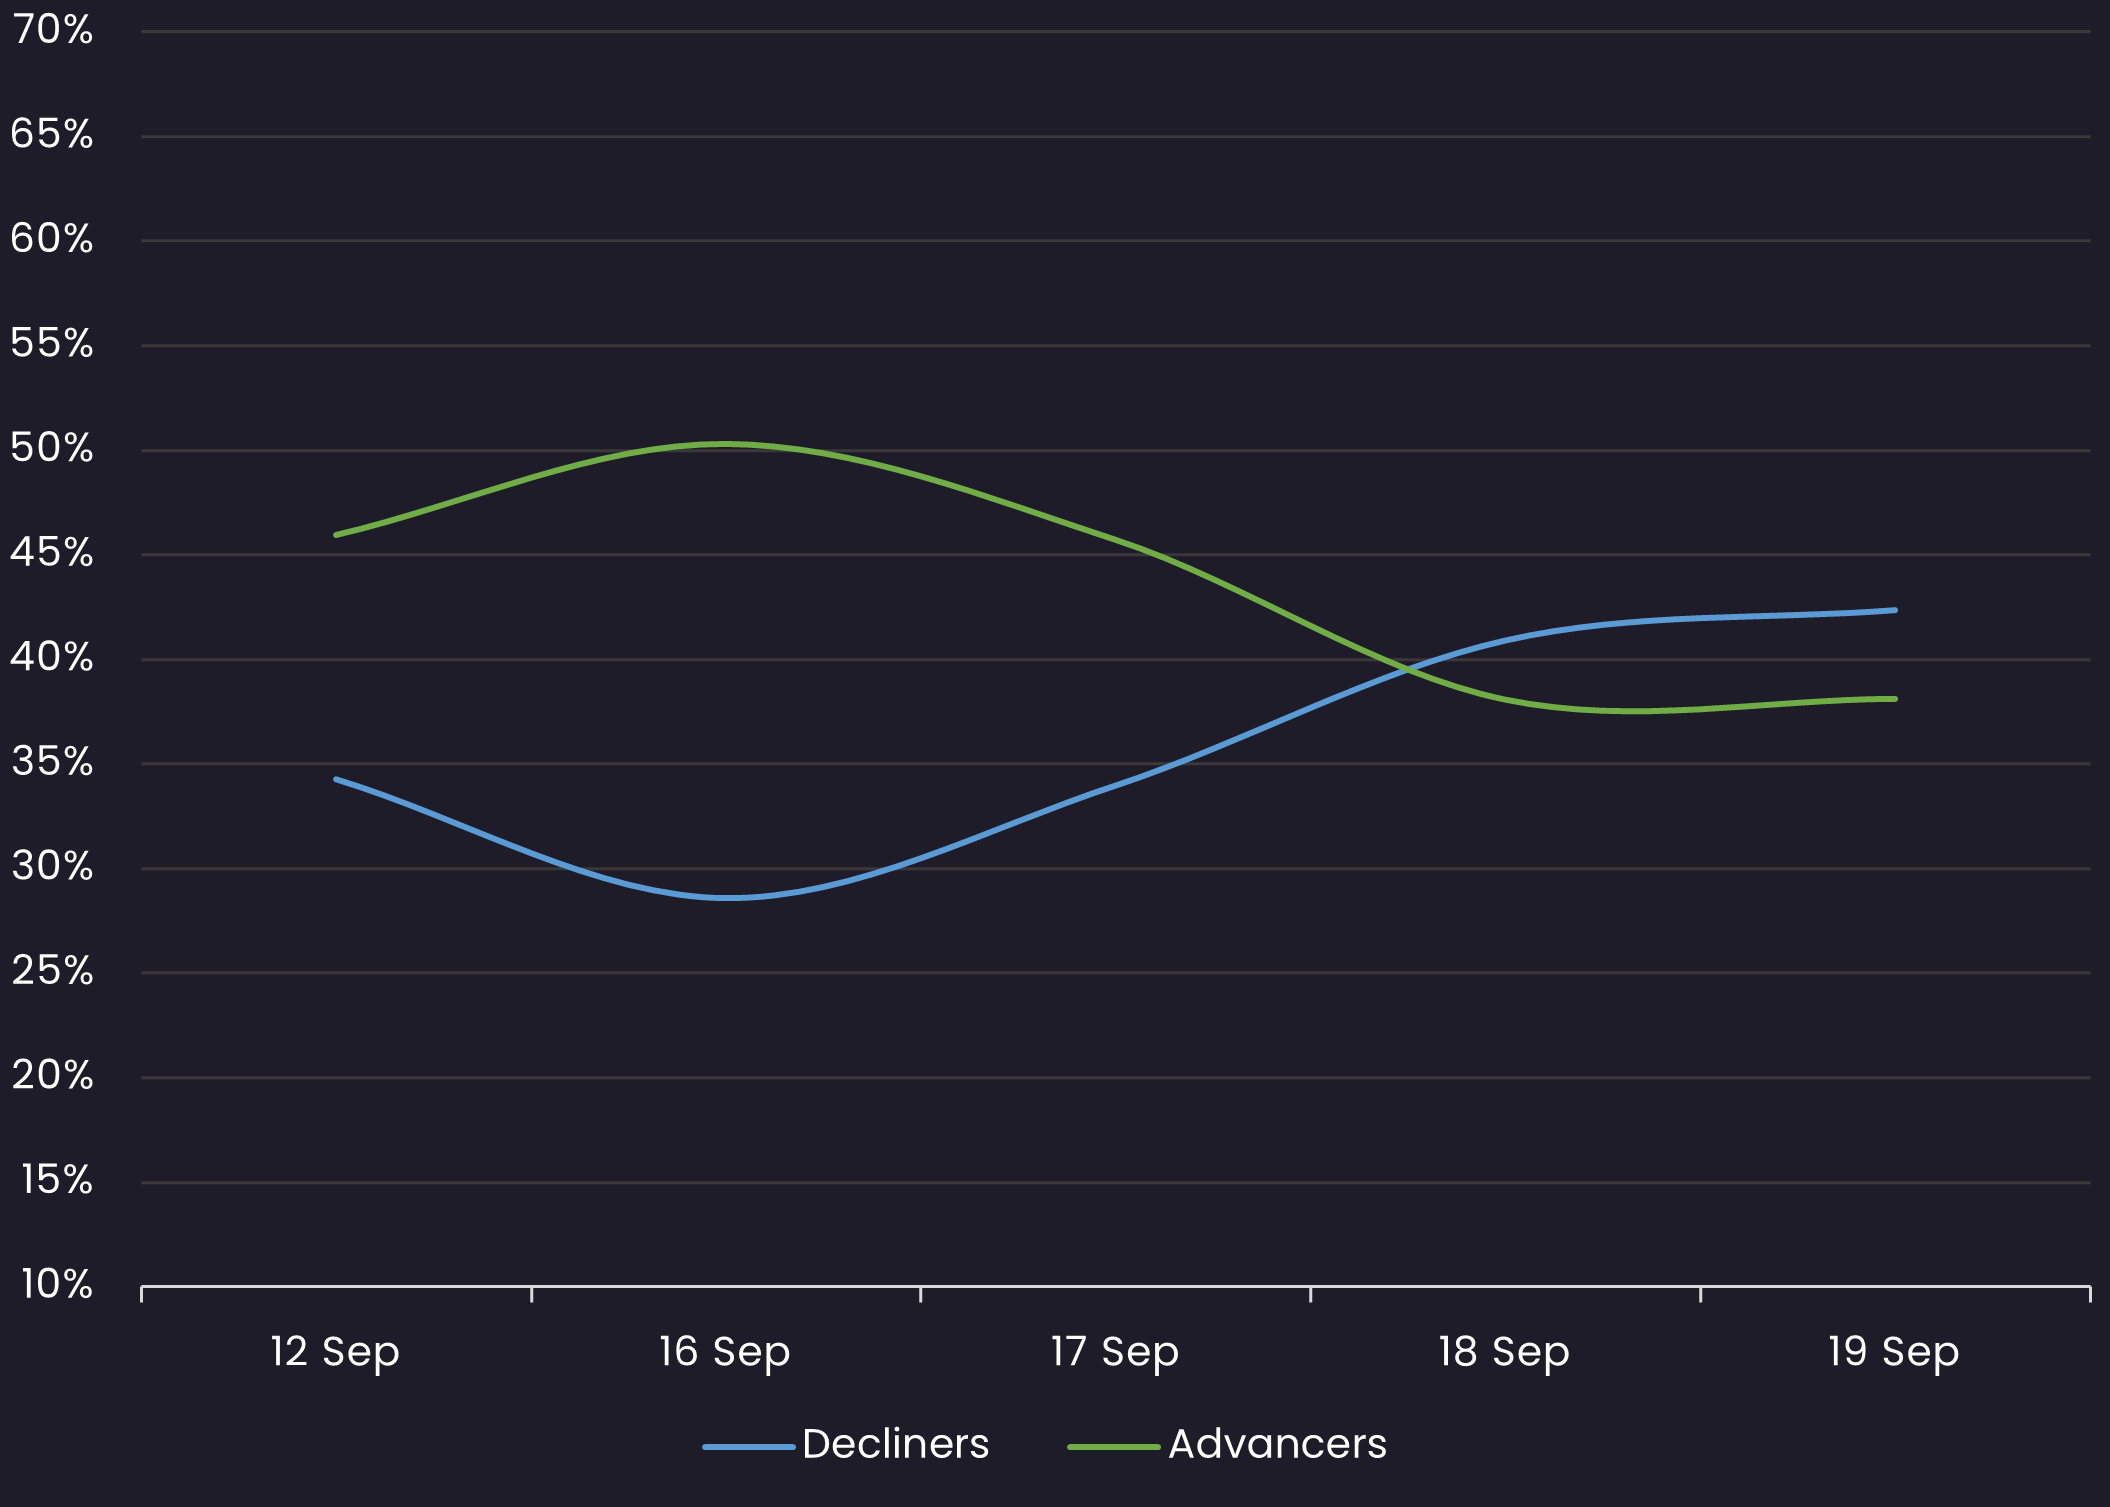
Sentiment
Reveals the percent of HY Corps increasing in price (advancers) vs. HY Corps decreasing in price (decliners) between 9/12/25 – 9/19/25
Top Quote Volume Movers: This Week vs Last Week
Exhibits the HY Corps with the largest increase in quote volume for the week ending 9/12/25 vs. the week ending 9/19/25
| RANK | TRANCHE | COUPON | MATURITY | PRIOR WEEK | THIS WEEK | INCREASE | % INCREASE |
|---|---|---|---|---|---|---|---|
| 1 | TNETBB 3.5 3/1/2028 144A | 3.50% | 03/01/28 | 40 | 220 | 180 | 450% |
| 2 | FE 5.15 1/15/2036 REGS | 5.15% | 01/15/36 | 115 | 273 | 158 | 137% |
| 3 | CSTM 3.125 7/15/2029 144A | 3.13% | 07/15/29 | 36 | 185 | 149 | 414% |
| 4 | FE 4.4 1/15/2031 REGS | 4.40% | 01/15/31 | 96 | 230 | 134 | 140% |
| 5 | IRM 3.875 11/15/2025 144A | 3.88% | 11/15/25 | 25 | 135 | 110 | 440% |
| 6 | PBFENE 7.875 9/15/2030 REGS | 7.88% | 09/15/30 | 147 | 250 | 103 | 70% |
| 7 | FE 4.15 1/15/2029 REGS | 4.15% | 01/15/29 | 92 | 185 | 93 | 101% |
| 8 | SOLEIN 6.75 8/1/2032 REGS | 6.75% | 08/01/32 | 88 | 180 | 92 | 105% |
| 9 | HBGCN 7.25 6/15/2030 | 7.25% | 06/15/30 | 124 | 216 | 92 | 74% |
| 10 | EDF 9.125 PERP REGS | 9.24% | NULL | 110 | 202 | 92 | 84% |
Most Quoted HY Corps
Ranks the HY Corps that were quoted by the highest number of dealers between 9/12/25 – 9/19/25
| RANK | TRANCHE | COUPON | MATURITY | DEALERS |
|---|---|---|---|---|
| 1 | TMUS 5.3 5/15/2035 | 5.30% | 05/15/35 | 37 |
| 2 | TMUS 5.05 7/15/2033 | 5.05% | 07/15/33 | 36 |
| 3 | TMUS 5.125 5/15/2032 | 5.13% | 05/15/32 | 35 |
| 4 | INTNED 5.75 PERP | 8.17% | NULL | 35 |
| 5 | SOCGEN 10 PERP REGS | 9.28% | NULL | 35 |
| 6 | SOCGEN 10 PERP 144A | 9.28% | NULL | 35 |
| 7 | SANTAN 9.625 PERP | 9.14% | NULL | 35 |
| 8 | BACR 4.375 PERP | 7.24% | NULL | 34 |
| 9 | STANLN 4.3 PERP REGS | 6.97% | NULL | 34 |
| 10 | BNP 7.375 PERP | 6.87% | NULL | 34 |
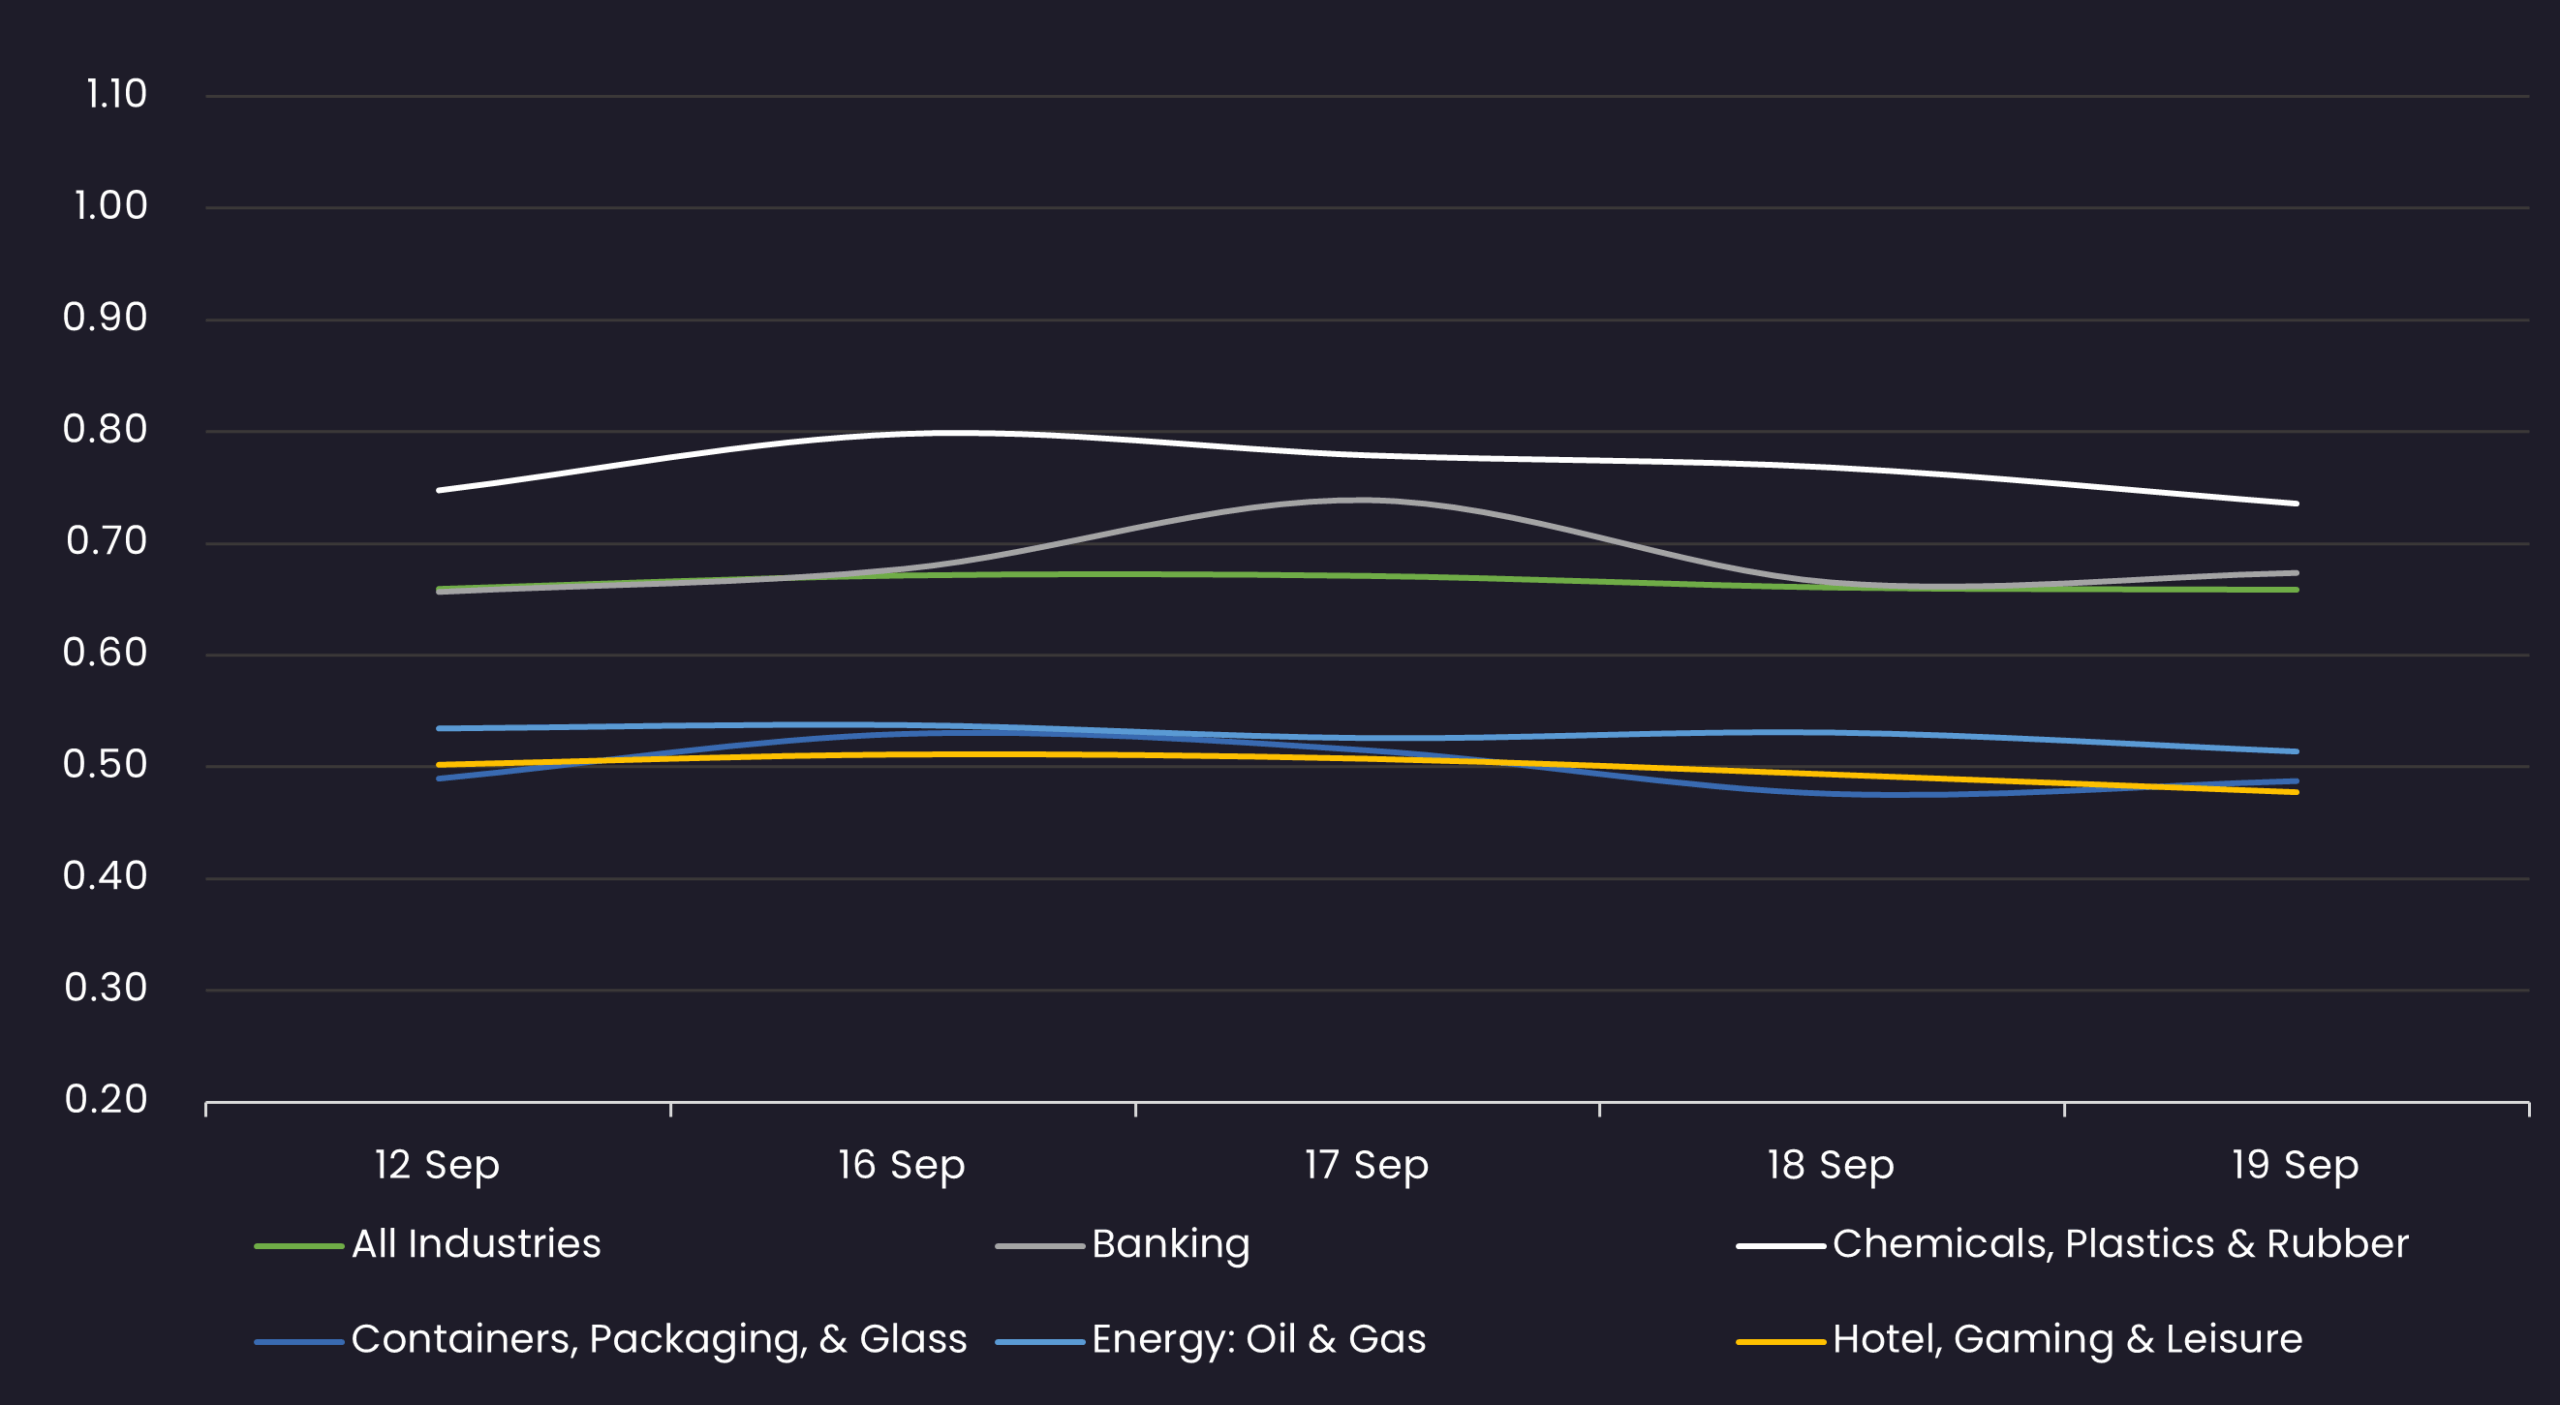
Bid-Offer Spread by Industry
Results are based on 5 select industry sectors, however, we offer data across 36 sectors
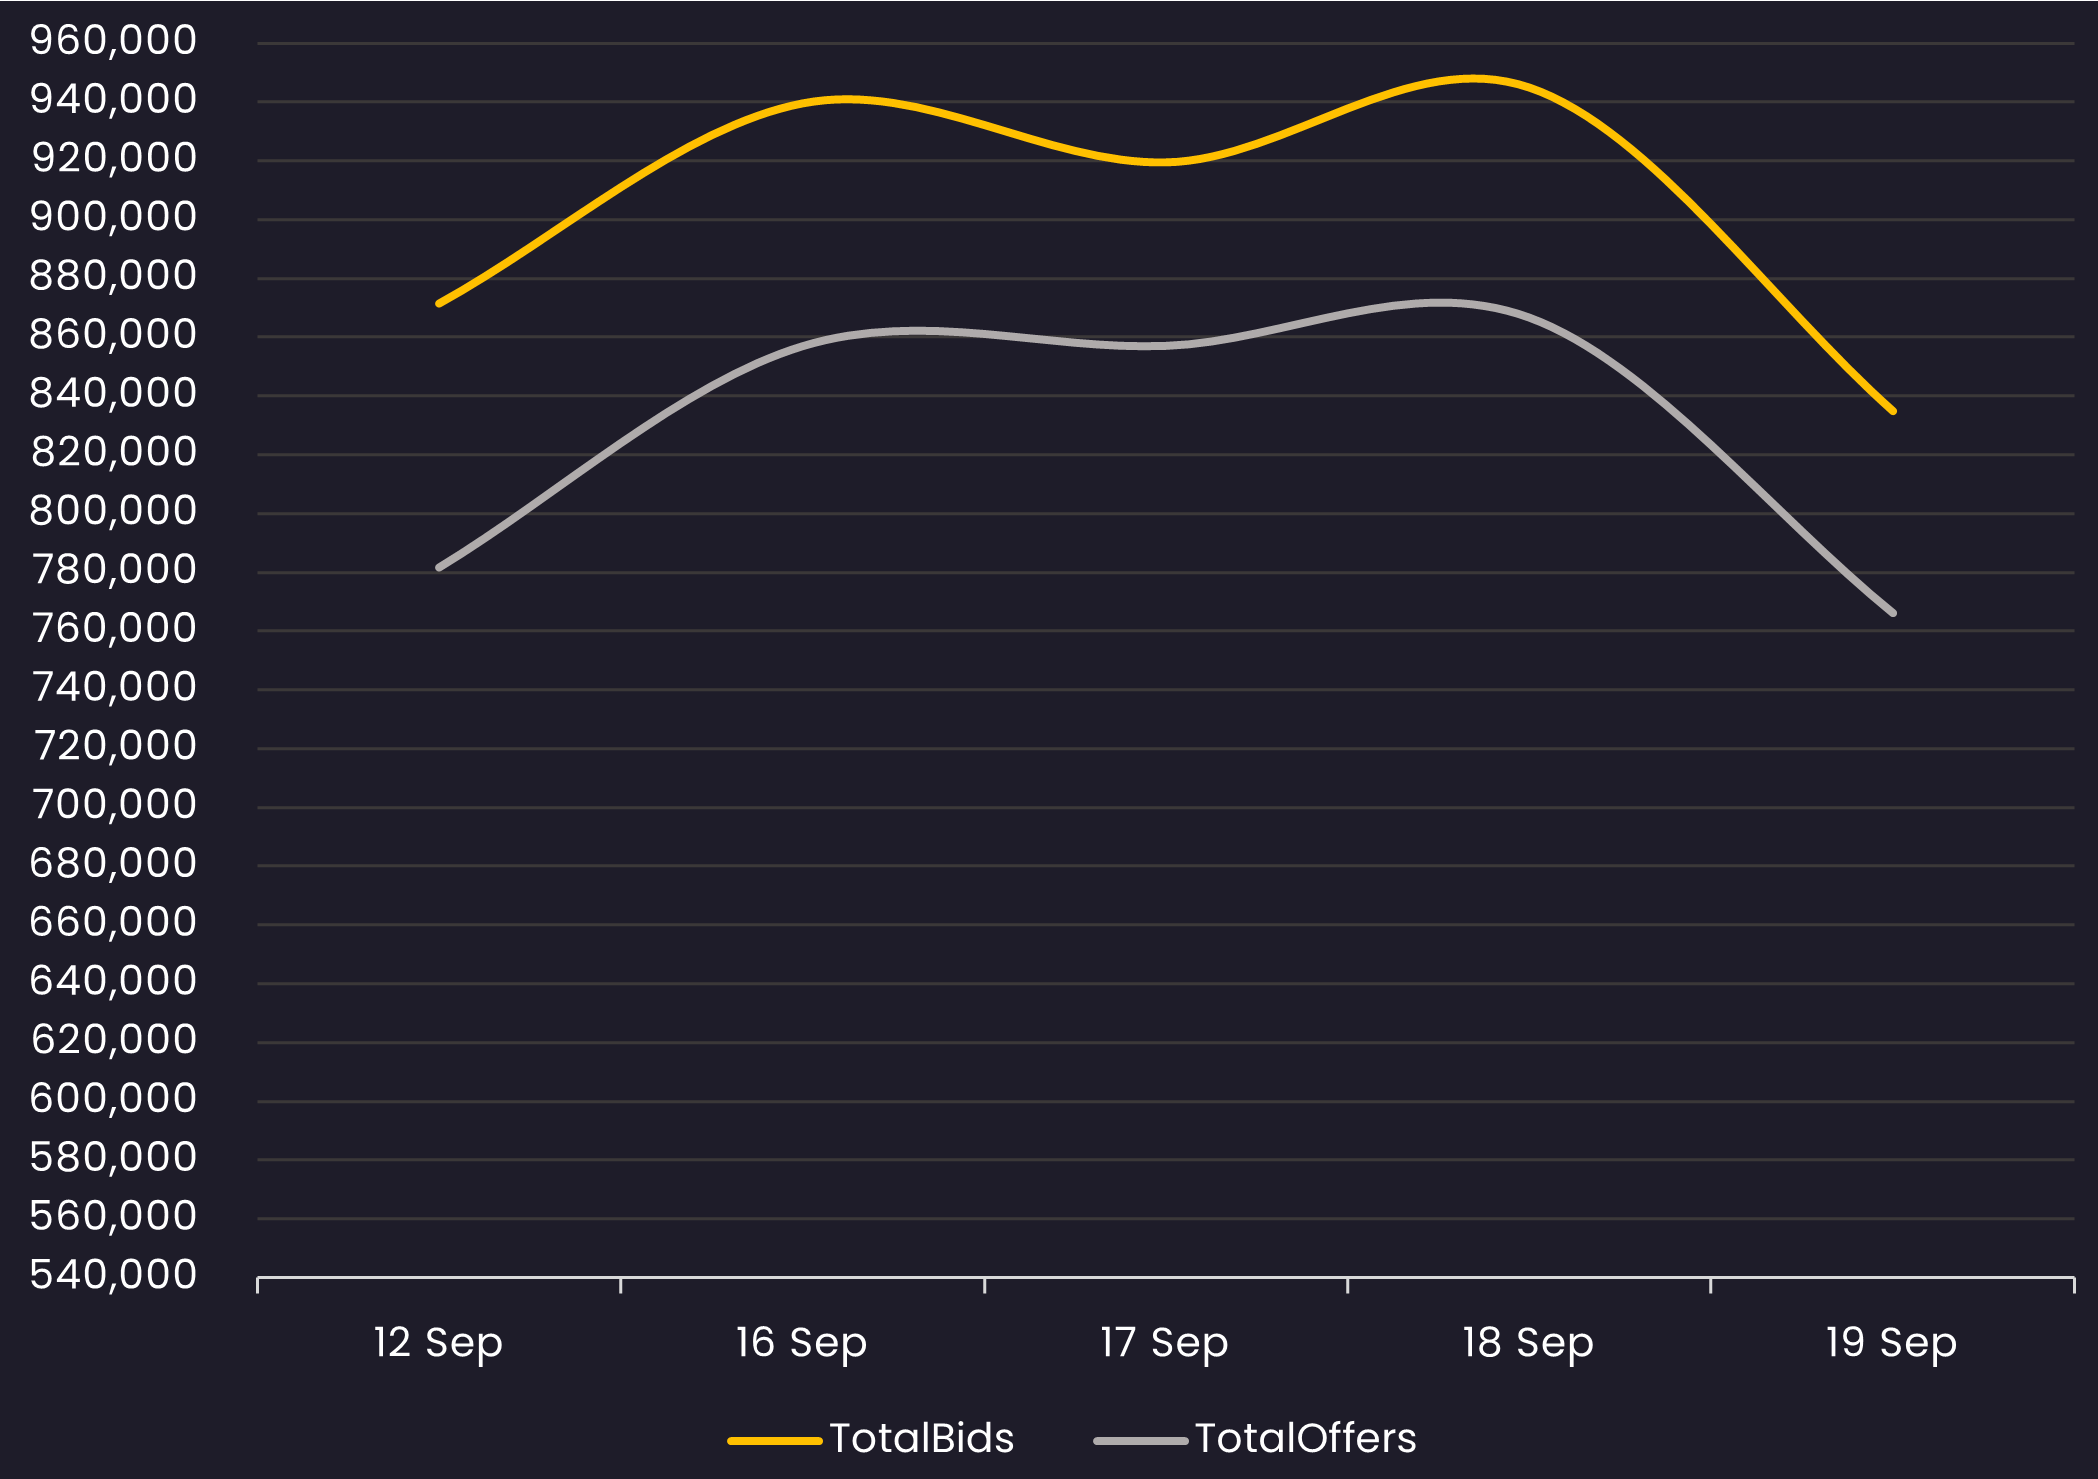
Bid and Offer Volume
Reveals the total number of quotes by bid and offer between 9/12/25 – 9/19/25
Stay up-to-date with weekly summaries.
Related Resources
About SOLVE
SOLVE is the leading market data platform provider for fixed-income securities, trusted by sophisticated buy-side and sell-side firms worldwide. Founded in 2011, SOLVE leverages its AI-driven technology and deep industry expertise to offer unparalleled transparency into markets, reduce risk, and save hundreds of hours across front-office workflows. With the largest real-time datasets for Securitized Products, Municipal Bonds, Corporate Bonds, Syndicated Bank Loans, Convertible Bonds, CDS, and Private Credit, SOLVE empowers clients to transform the way they bring new securities to market, trade on secondary markets, and value highly illiquid securities. Headquartered in Connecticut, with offices across the globe, SOLVE is the definitive source for market pricing in fixed-income markets.
