Investment Grade CDS Market Summary – October 2023
GET OUR CDS MARKET SUMMARIES STRAIGHT TO YOUR INBOX. LEARN MORE
Investment Grade CDS Market Summary:October 2023
Our newsletter presents key trends derived from observable Credit Default Swaps pricing data over a monthly period.
Top 10 Outperformers
Showcases the top 10 IG CDS “outperformers” based on the largest mid spread decreases between 10/1/23 – 10/31/23
| RANK | BOND NAME | ISSUER | % CHANGE | BPS CHANGE | SPRD | SPRD-1 MONTH | DEALERS |
|---|---|---|---|---|---|---|---|
| 1 | HESS 5Y | AMERADA HESS CORP | -46.0% | -45 | 52 | 97 | 7 |
| 2 | ABXFIN 5Y | BARRICK GOLD CORP | -9.0% | -6 | 59 | 64 | 7 |
| 3 | PSON 5Y | PEARSON DLR FIN PLC | -6.7% | -6 | 77 | 82 | 5 |
| 4 | TESCO 5Y | TESCO PLC | -5.6% | -5 | 87 | 92 | 5 |
| 5 | LIFP 5Y | KLEPIERRE SA | -5.2% | -5 | 94 | 99 | 3 |
| 6 | PUBFP 5Y | PUBLICIS S A NEW | -5.1% | -4 | 71 | 75 | 5 |
| 7 | VOLTRY 5Y | VOLVO TREAS AB | -4.5% | -3 | 74 | 77 | 4 |
| 8 | COXENT 5Y | COX COMMUNICATIONS INC NEW | -4.2% | -3 | 71 | 74 | 7 |
| 9 | GE 5Y | GENERAL ELEC CAP CORP MEDIUM | -3.9% | -3 | 63 | 66 | 6 |
| 10 | KPN 5Y | ROYAL KPN NV | -3.1% | -2 | 60 | 62 | 5 |
Top 10 Underperformers
Showcases the top 10 IG CDS “underperformers” based on the largest mid spread increases between 10/1/23 – 10/31/23
| RANK | BOND NAME | ISSUER | % CHANGE | BPS CHANGE | SPRD | SPRD-1 MONTH | DEALERS |
|---|---|---|---|---|---|---|---|
| 1 | SUMICH 5Y | SUMITOMO CHEMICAL CO LTD | 66.2% | 30 | 75 | 45 | 3 |
| 2 | RENTOKIL 5Y | RENTOKIL GROUP PLC | 52.6% | 31 | 89 | 58 | 5 |
| 3 | KAWHI 5Y | KAWASAKI HEAVY INDUSTRIES LTD | 39.6% | 20 | 70 | 50 | 3 |
| 4 | SIEGR 5Y | SIEMENS | 37.2% | 15 | 57 | 41 | 4 |
| 5 | TELMAL 5Y | TELEKOM MALAYSIA BERHAD | 32.6% | 15 | 61 | 46 | 2 |
| 6 | MITTOA 5Y | MITSUI CHEMICALS INC | 32.4% | 11 | 45 | 34 | 3 |
| 7 | CAT 5Y | CATERPILLAR INC. | 25.9% | 10 | 47 | 37 | 5 |
| 8 | AMZN 5Y | AMAZON.COM INC | 24.1% | 8 | 43 | 35 | 3 |
| 9 | CMBKKO 5Y | WOORI BK KOREA | 23.1% | 9 | 49 | 40 | 3 |
| 10 | KOREAT 5Y | KT CORP MEDIUM TERM NTS BOOK | 22.9% | 9.2 | 50 | 40 | 2 |
Normalized IG Spread by Region
Displays the IG CDS spread by region between 10/1/23 – 10/31/23 Results are based on 5 select regions, however, we offer data across 12 regions
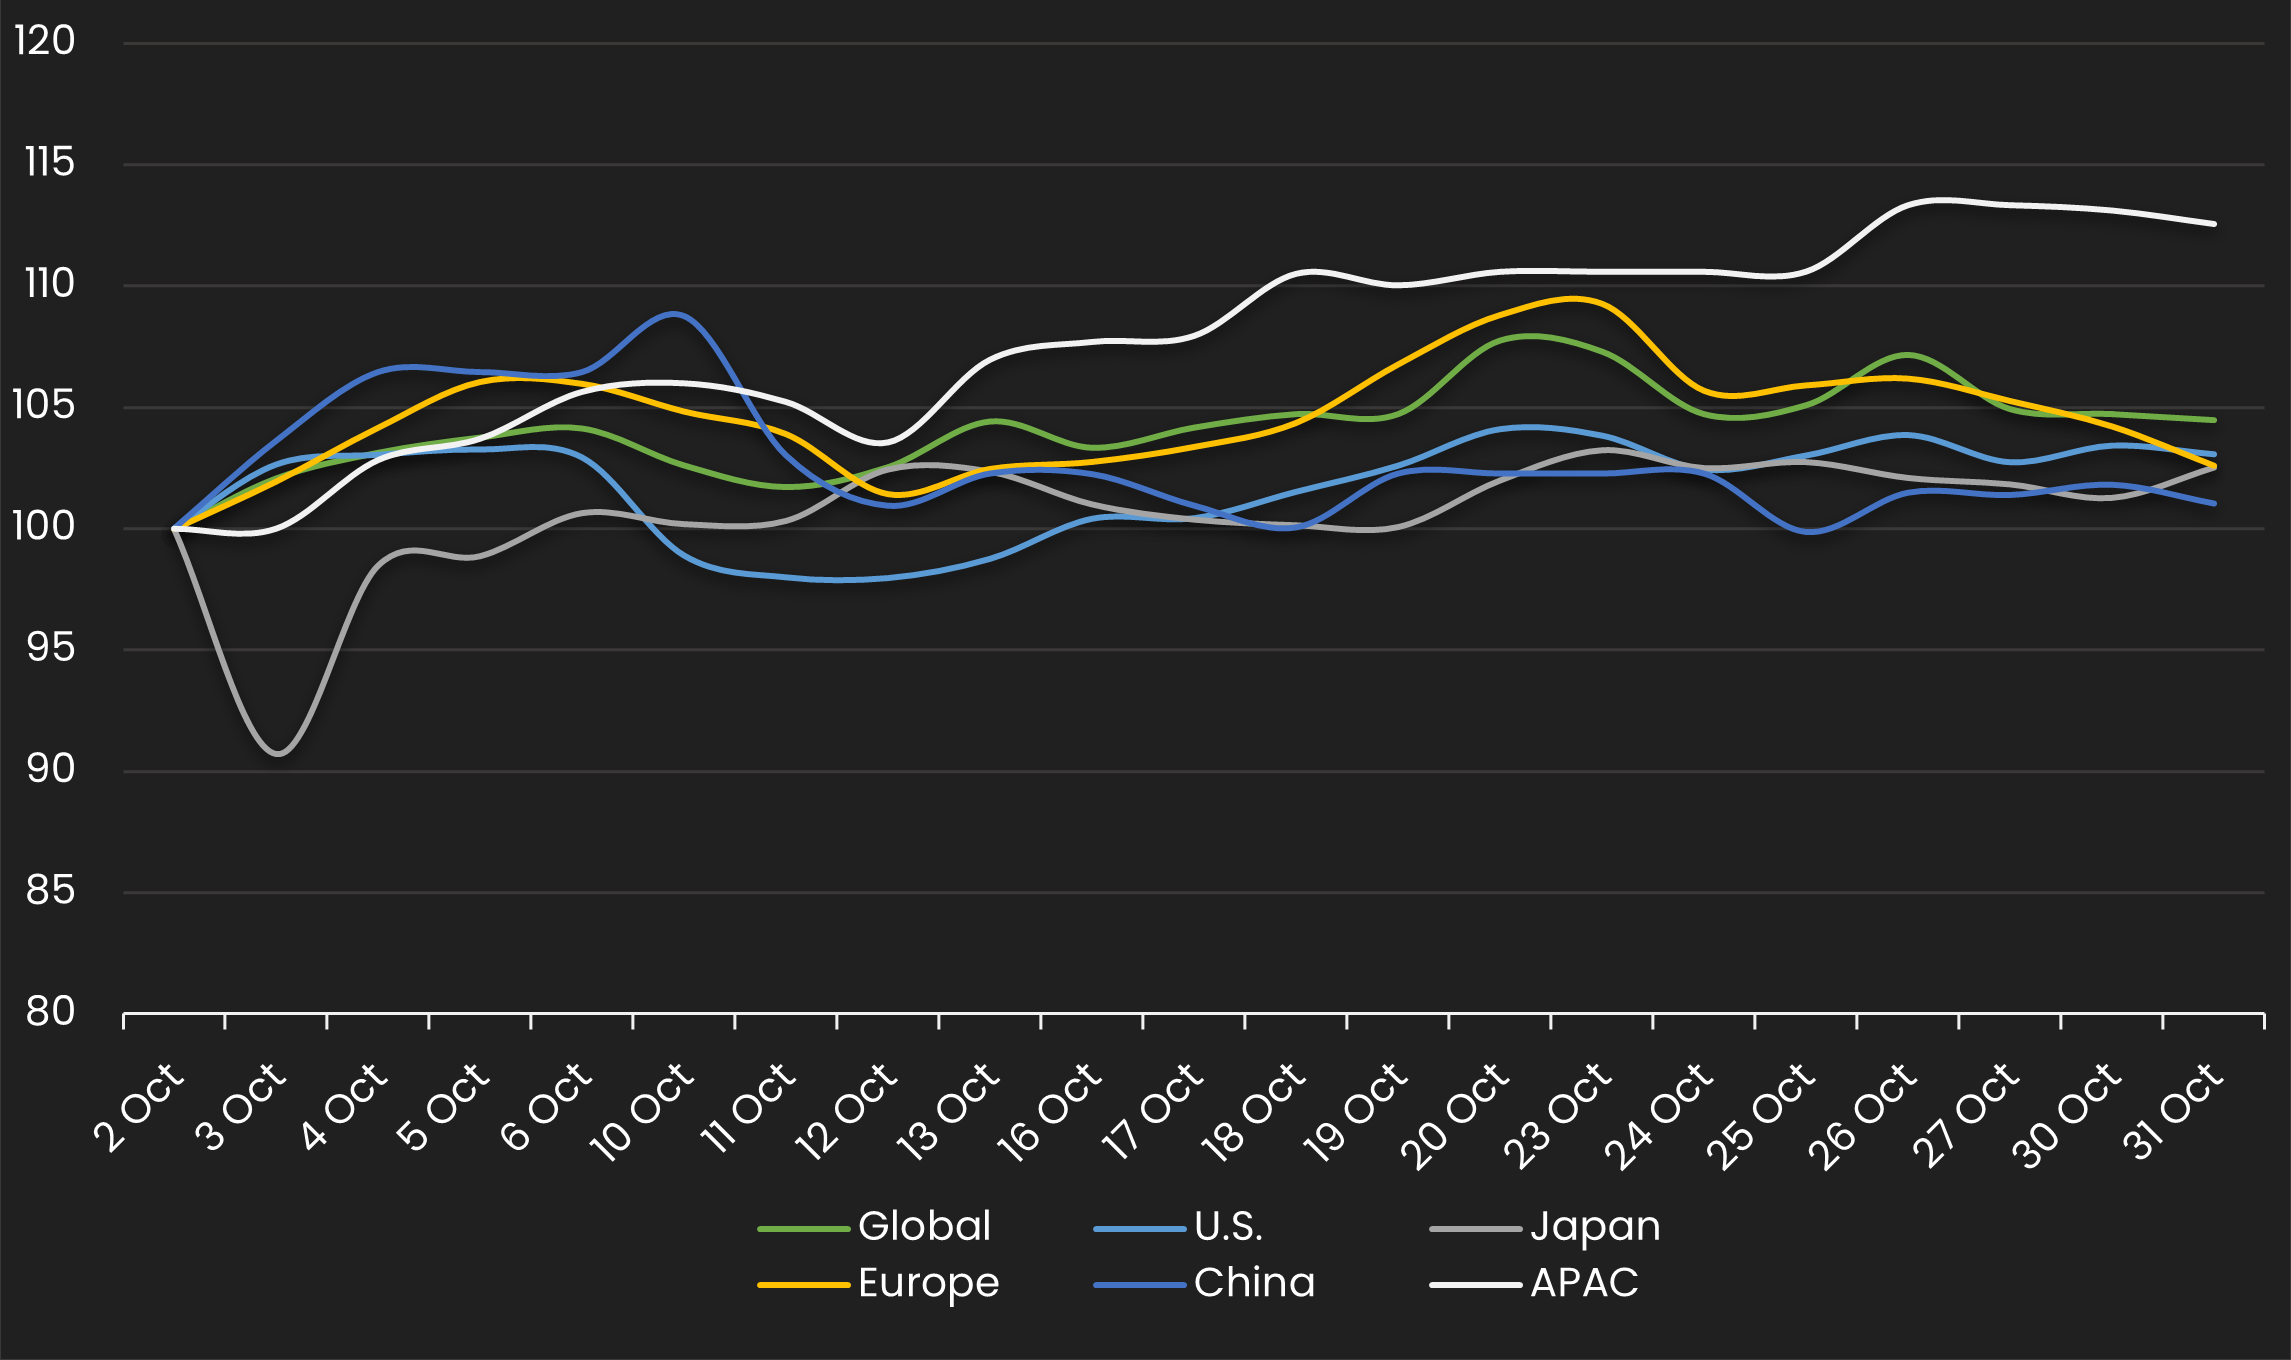
IG Spread by Region – Monthly Comparison
Exhibits the IG mid spread by region for the month ending 9/30/23 vs. the month ending 10/31/23
| REGION | PREVIOUS SPREAD | CURRENT SPREAD | BPS CHANGE | MONTHLY PERFORMANCE | CDS COUNT |
|---|---|---|---|---|---|
| Global | 67 | 70 | 3 | Wider | 496 |
| U.S. | 66 | 68 | 2 | Wider | 171 |
| Europe | 70 | 72 | 2 | Wider | 148 |
| Canada | 73 | 60 | -12 | Tighter | 5 |
| China | 92 | 93 | 1 | Wider | 8 |
| MENA | 80 | 98 | 18 | Wider | 14 |
Normalized IG Spread by Industry
Displays the IG CDS spread by industry between 10/1/23 – 10/31/23 Results are based on 5 select industry sectors, however, we offer data across 36 sectors
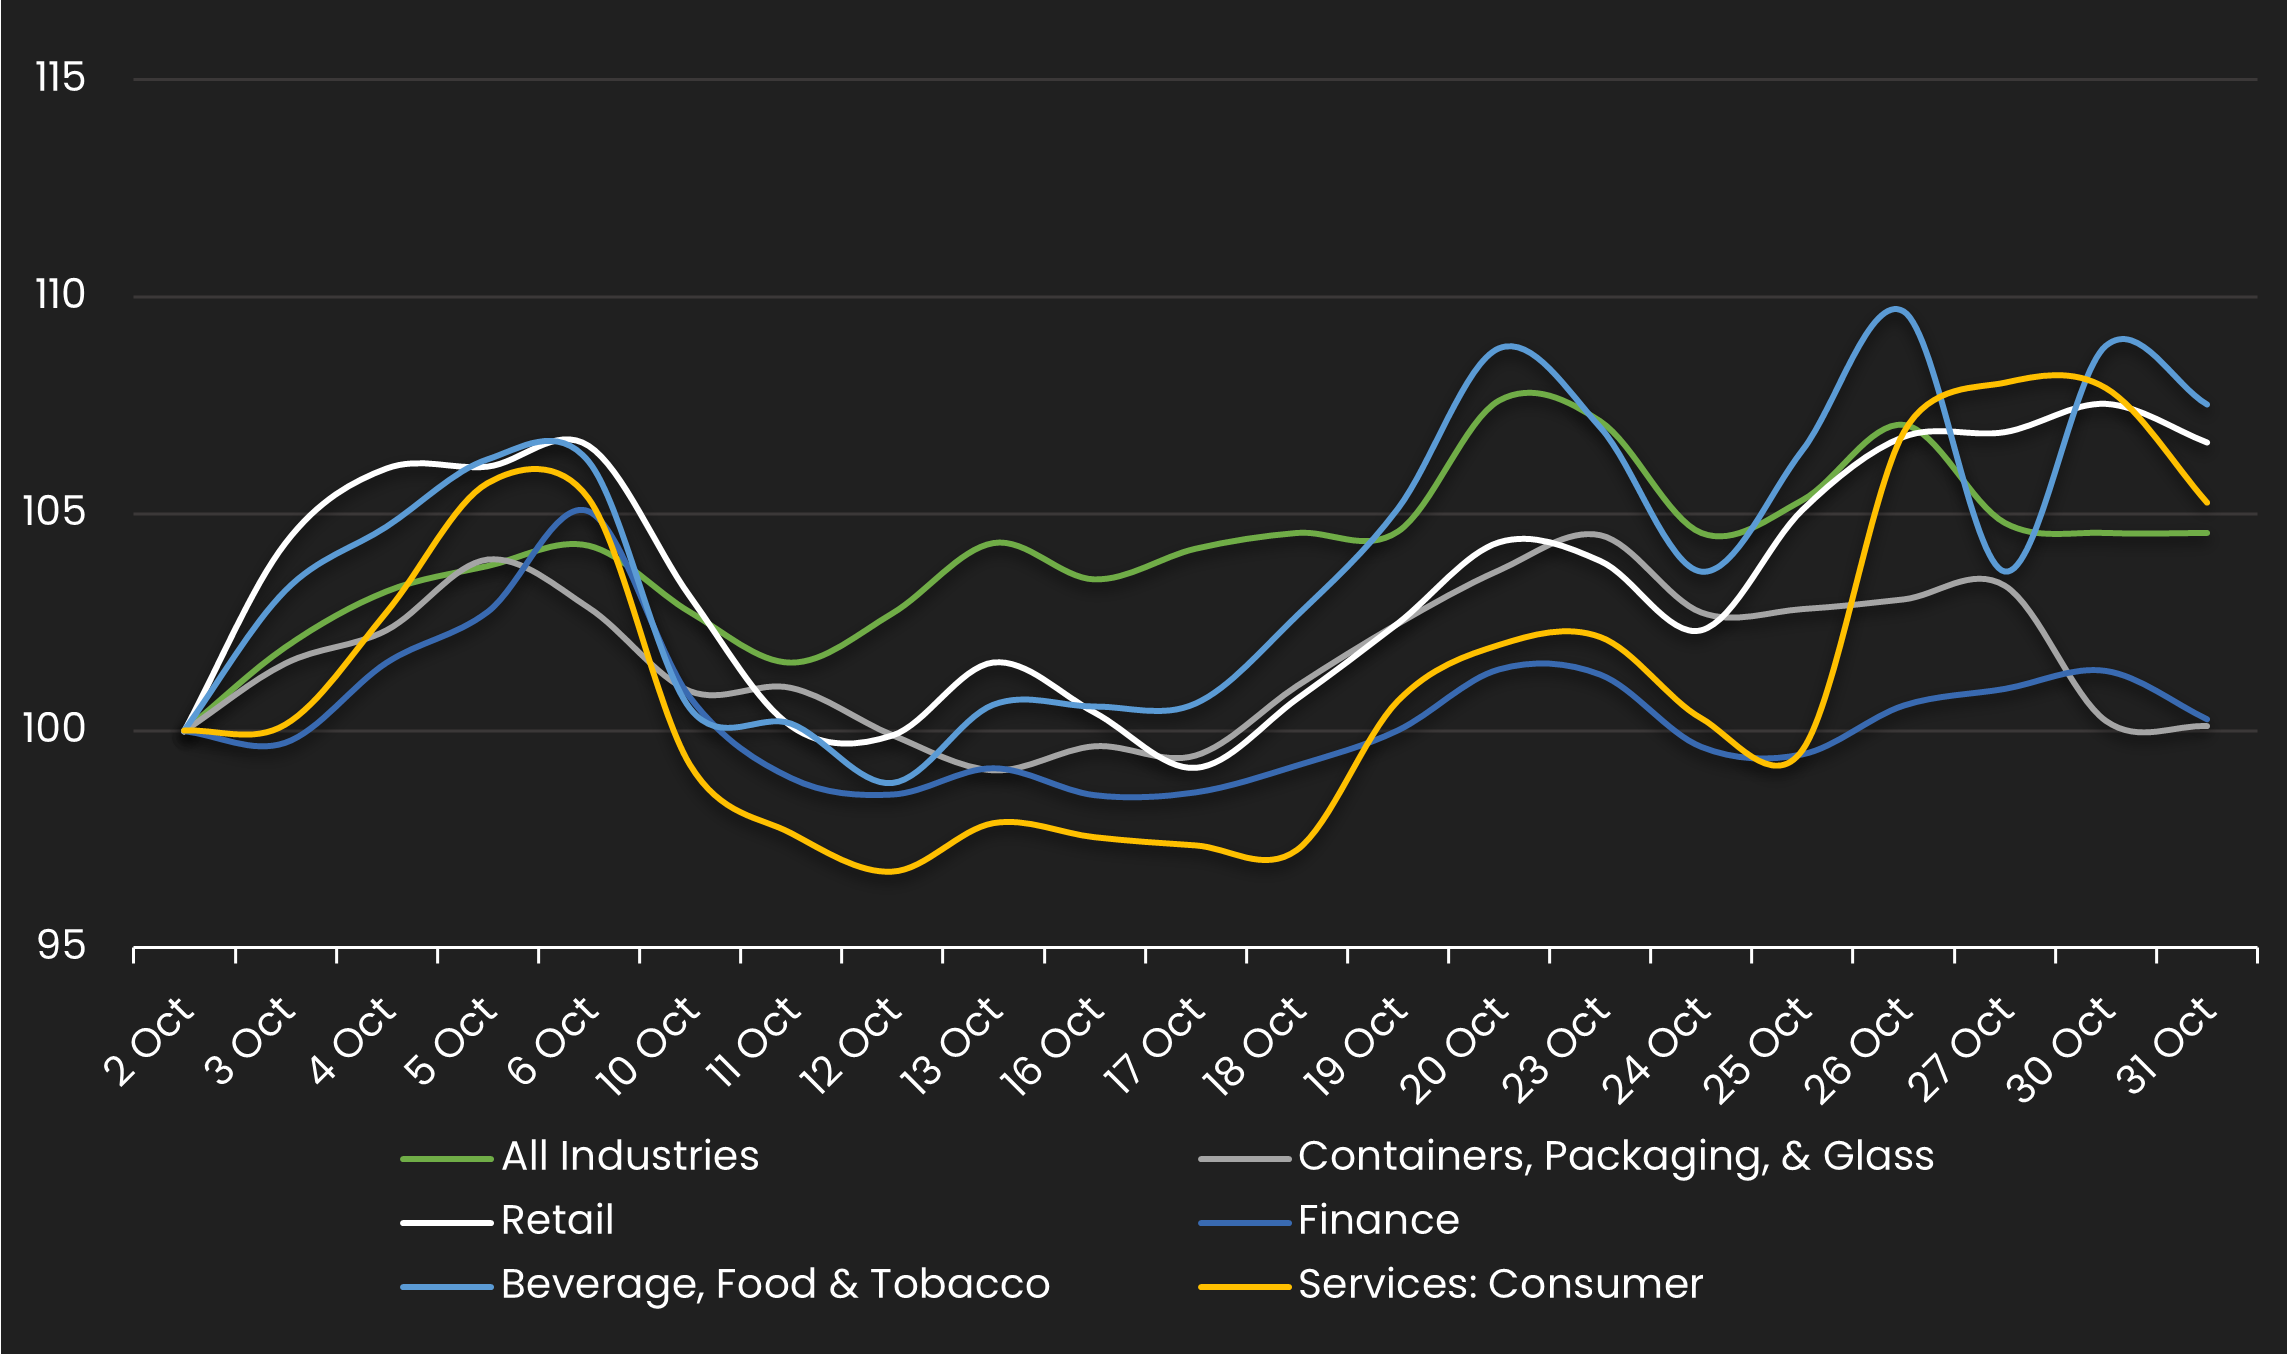
IG Spread by Industries – Monthly Comparison
Exhibits the IG spread by industry for the month ending 9/30/23 vs. the month ending 10/31/23
| INDUSTRIES | PREVIOUS SPREAD | CURRENT SPREAD | BPS CHANGE | MONTHLY PERFORMANCE | CDS COUNT |
|---|---|---|---|---|---|
| All Industries | 67 | 70 | 3 | Wider | 0 |
| Containers, Packaging, & Glass | 62 | 62 | 0 | Wider | 0 |
| Retail | 59 | 63 | 4 | Wider | 0 |
| Finance | 76 | 76 | 0 | Wider | 0 |
| Beverage, Food & Tobacco | 48 | 51 | 4 | Wider | 0 |
| Services: Consumer | 122 | 129 | 6 | Wider | 0 |
Stay up-to-date with monthly summaries.
Related Resources
About SOLVE
SOLVE is the leading market data platform provider for fixed-income securities, trusted by sophisticated buy-side and sell-side firms worldwide. Founded in 2011, SOLVE leverages its AI-driven technology and deep industry expertise to offer unparalleled transparency into markets, reduce risk, and save hundreds of hours across front-office workflows. With the largest real-time datasets for Securitized Products, Municipal Bonds, Corporate Bonds, Syndicated Bank Loans, Convertible Bonds, CDS, and Private Credit, SOLVE empowers clients to transform the way they bring new securities to market, trade on secondary markets, and value highly illiquid securities. Headquartered in Connecticut, with offices across the globe, SOLVE is the definitive source for market pricing in fixed-income markets.
