Investment Grade CDS Market Summary – November 2024
GET OUR CDS MARKET SUMMARIES STRAIGHT TO YOUR INBOX. LEARN MORE
Investment Grade CDS Market November 2024
Our newsletter presents key trends derived from observable Credit Default Swaps pricing data over a monthly period.
Top 10 Outperformers
Showcases the top 10 IG CDS “outperformers” based on the largest mid spread decreases between 11/1/24 – 11/30/24
| RANK | BOND NAME | ISSUER | % CHANGE | BPS CHANGE | SPRD | SPRD-1 MONTH | DEALERS |
|---|---|---|---|---|---|---|---|
| 1 | OVV 5Y | OVINTIV | -21.3% | -23 | 85 | 107 | 3 |
| 2 | HAL 5Y | DRESSER INDS INC | -20.5% | -13 | 52 | 66 | 5 |
| 3 | KMI 5Y | K N ENERGY INC | -20.1% | -13 | 53 | 66 | 3 |
| 4 | EXPE 5Y | EXPEDIA INC | -18.8% | -12 | 53 | 65 | 3 |
| 5 | PCG 5Y | PG&E CORP | -18.4% | -21 | 92 | 113 | 3 |
| 6 | MPC 5Y | MPC LLC | -18.1% | -14 | 63 | 77 | 5 |
| 7 | WMB 5Y | MAPCO INC | -18.0% | -12 | 53 | 65 | 5 |
| 8 | POSCO 5Y | POSCO | -16.3% | -10 | 50 | 60 | 2 |
| 9 | PHM 5Y | CENTEX CORP | -15.4% | -12 | 64 | 75 | 4 |
| 10 | VLO 5Y | PREMCOR REFNG GROUP INC | -15.3% | -11 | 60 | 71 | 5 |
Top 10 Underperformers
Showcases the top 10 IG CDS “underperformers” based on the largest mid spread increases between 11/1/24 – 11/30/24
| RANK | BOND NAME | ISSUER | % CHANGE | BPS CHANGE | SPRD | SPRD-1 MONTH | DEALERS |
|---|---|---|---|---|---|---|---|
| 1 | OPTUS 5Y | SINGAPORE TELECOMMUNICATIONS | 49.6% | 16 | 48 | 32 | 3 |
| 2 | SYY 5Y | SYSCO CORP | 37.0% | 20 | 73 | 54 | 2 |
| 3 | PBG 5Y | BOTTLING GROUP LLC | 36.9% | 12 | 43 | 32 | 2 |
| 4 | HMSOLN 5Y | HAMMERSON PLC | 25.9% | 12 | 59 | 47 | 3 |
| 5 | KOBSTL 5Y | KOBE STEEL LTD | 21.9% | 13 | 73 | 60 | 3 |
| 6 | WYE 5Y | ALPHARMA INC | 20.0% | 7 | 42 | 35 | 5 |
| 7 | AMGN 5Y | AMGEN INC | 18.6% | 7 | 45 | 38 | 5 |
| 8 | BABA 5Y | ALIBABA GROUP HOLDING | 17.8% | 14 | 91 | 77 | 3 |
| 9 | AKZANA 5Y | ICI WILMINGTON INC | 17.4% | 10 | 69 | 59 | 5 |
| 10 | AXASA 5Y | AXA SA | 15.5% | 6.8 | 51 | 44 | 5 |
Normalized IG Spread by Region
Displays the IG CDS spread by region between 11/1/24 – 11/30/24 Results are based on 5 select regions, however, we offer data across 12 regions
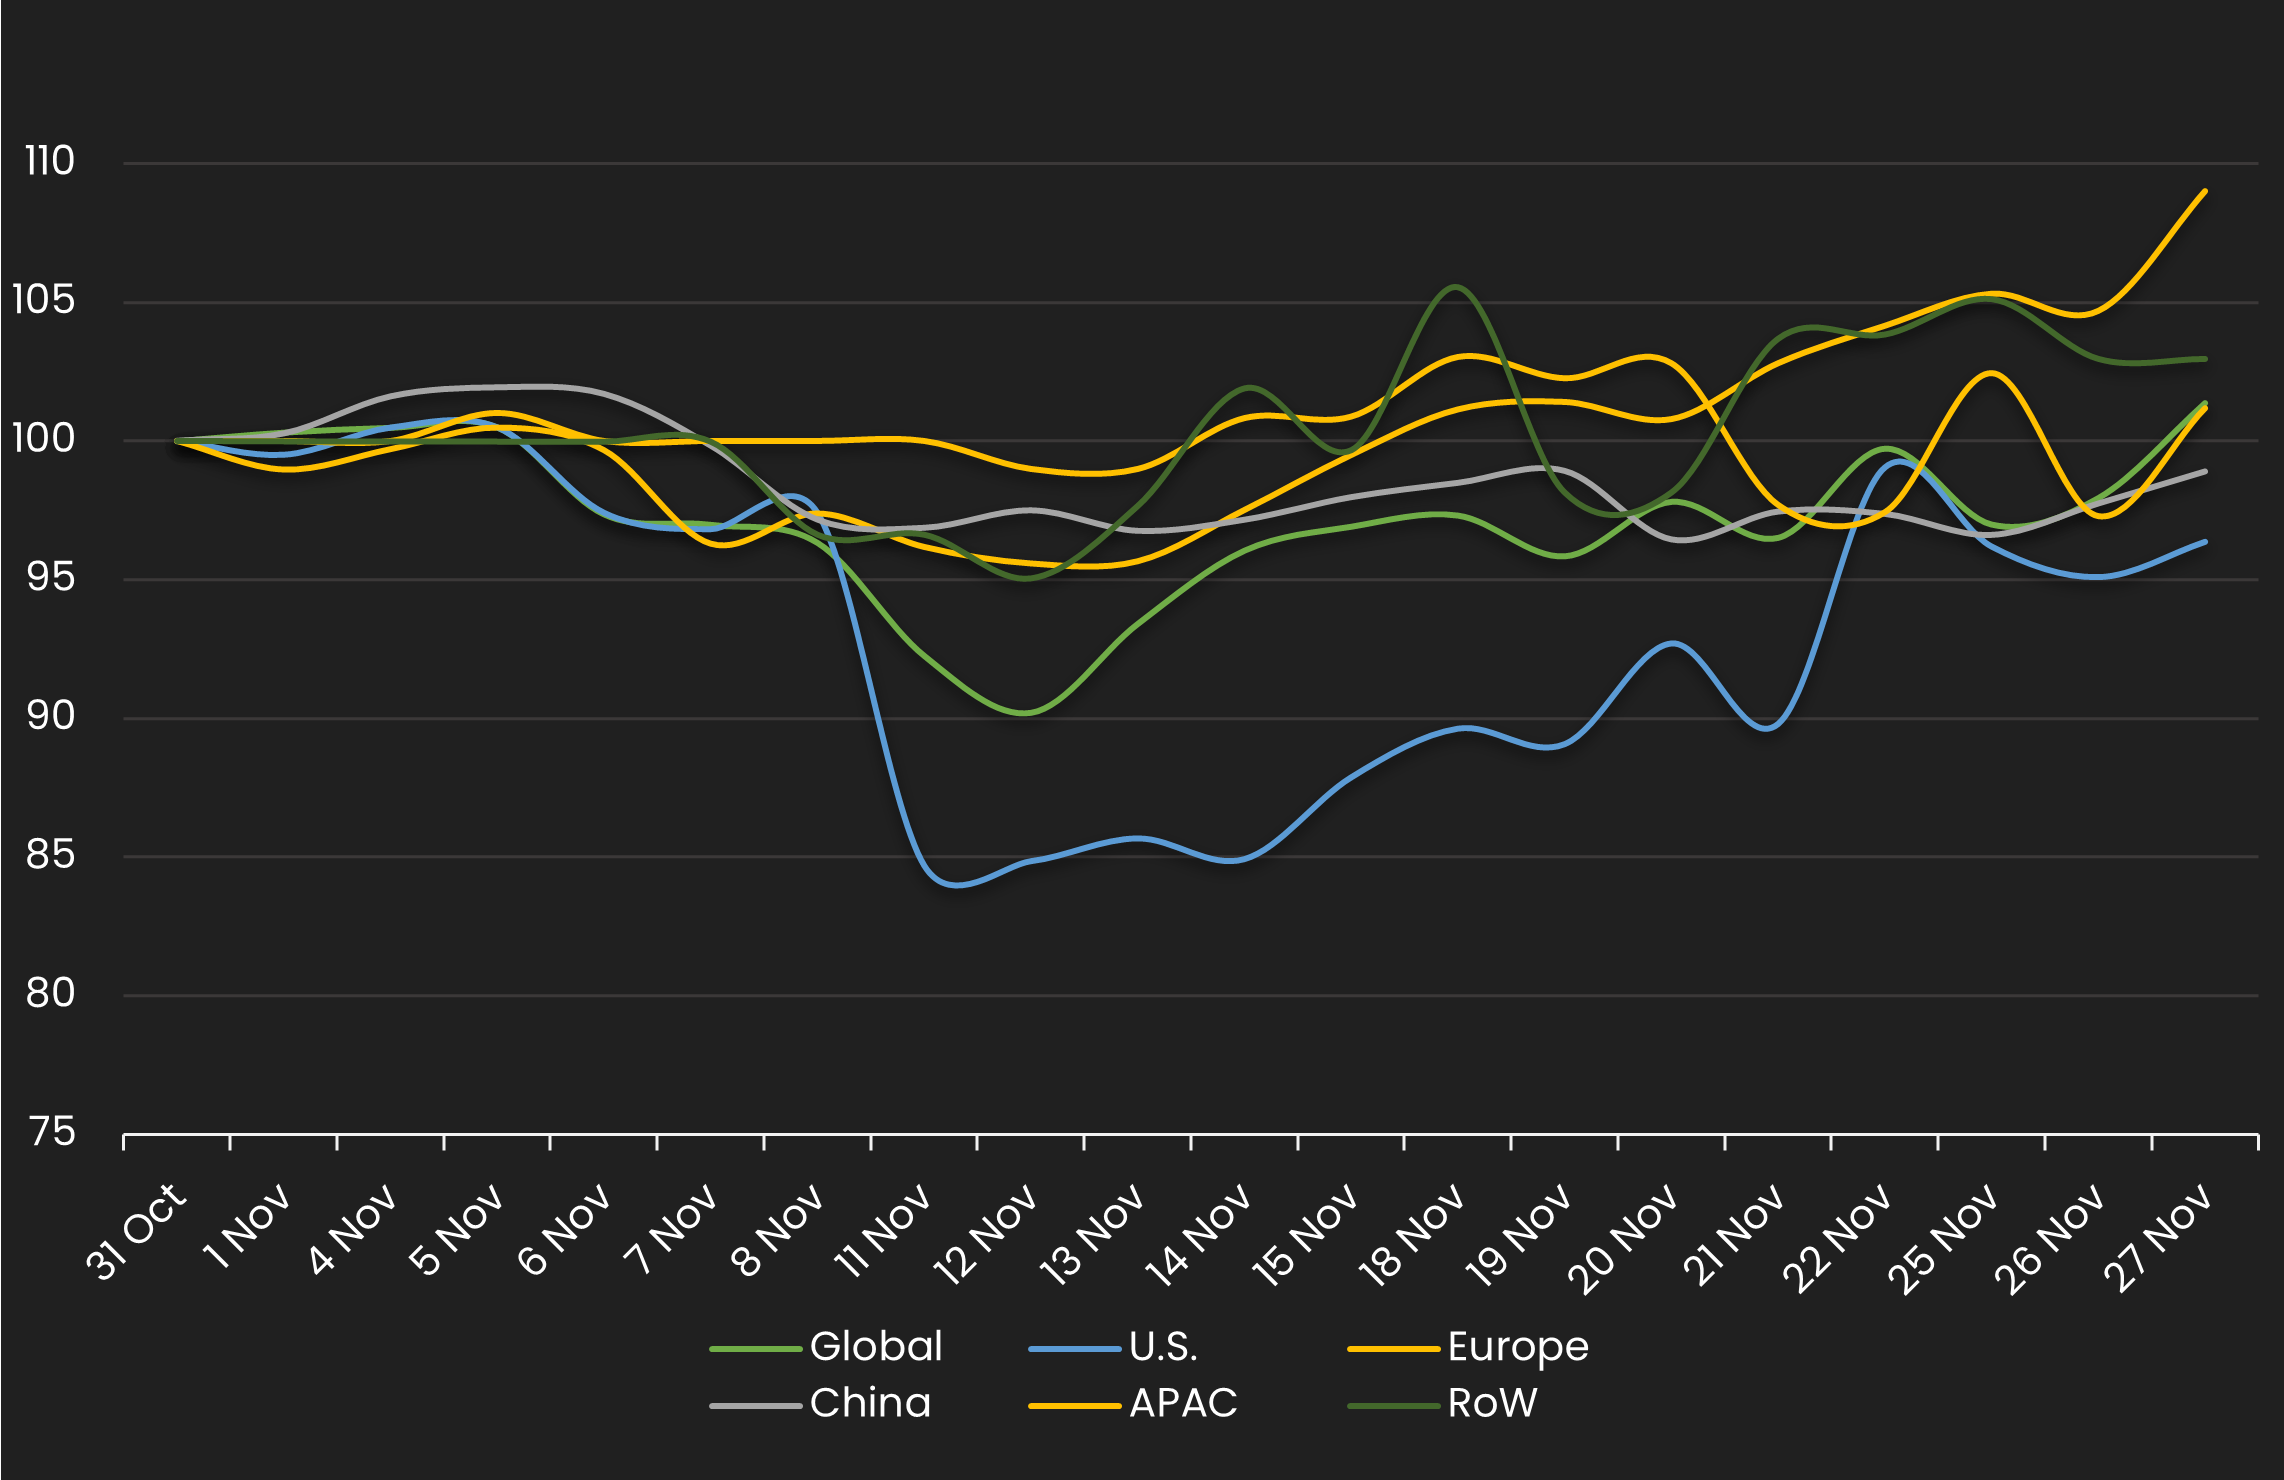
IG Spread by Region – Monthly Comparison
Exhibits the IG mid spread by region for the month ending 10/31/23 vs. the month ending 11/30/24
| REGION | PREVIOUS SPREAD | CURRENT SPREAD | BPS CHANGE | MONTHLY PERFORMANCE | CDS COUNT |
|---|---|---|---|---|---|
| Global | 49 | 50 | 1 | Wider | 587 |
| U.S. | 48 | 46 | -2 | Tighter | 237 |
| Europe | 47 | 51 | 4 | Wider | 152 |
| China | 65 | 64 | -1 | Tighter | 9 |
| APAC | 50 | 50 | 1 | Wider | 45 |
| RoW | 67 | 69 | 2 | Wider | 11 |
Normalized IG Spread by Industry
Displays the IG CDS spread by industry between 11/1/24 – 11/30/24 Results are based on 5 select industry sectors, however, we offer data across 36 sectors
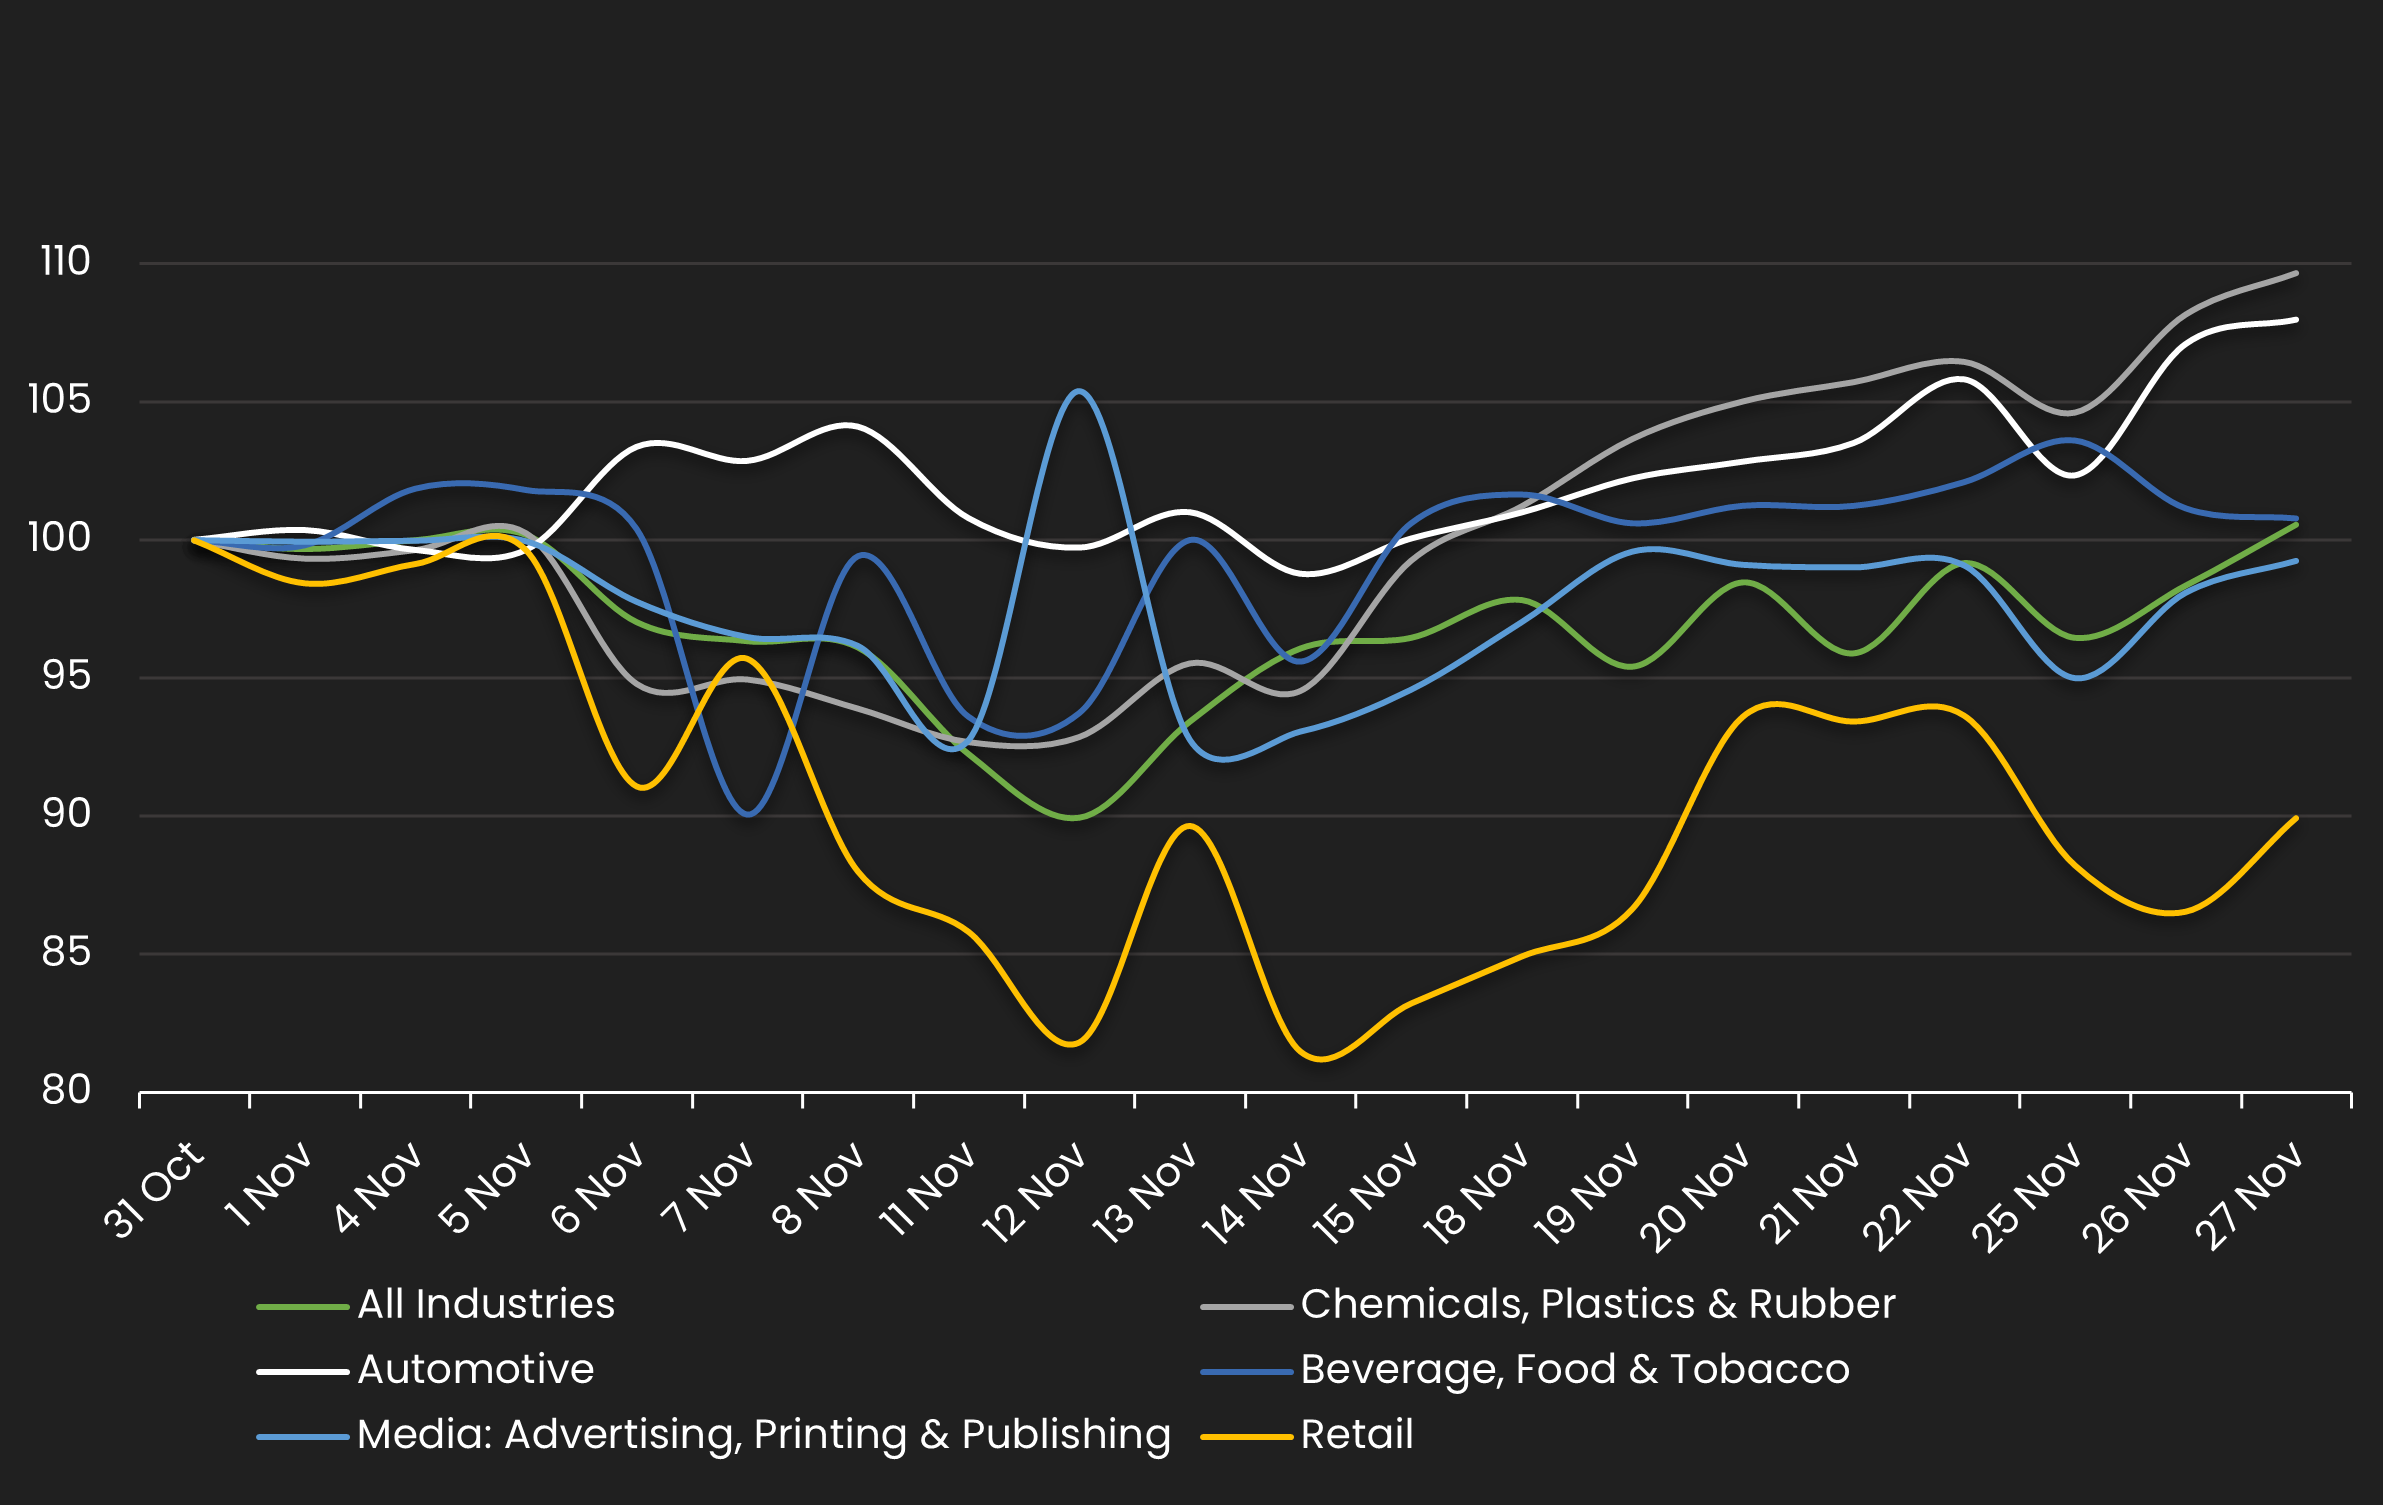
IG Spread by Industries – Monthly Comparison
Exhibits the IG spread by industry for the month ending 10/31/23 vs. the month ending 11/30/24
| INDUSTRIES | PREVIOUS SPREAD | CURRENT SPREAD | BPS CHANGE | MONTHLY PERFORMANCE | CDS COUNT |
|---|---|---|---|---|---|
| All Industries | 50 | 50 | 0 | Wider | 0 |
| Chemicals, Plastics & Rubber | 63 | 69 | 6 | Wider | 0 |
| Automotive | 58 | 63 | 5 | Wider | 0 |
| Beverage, Food & Tobacco | 40 | 41 | 0 | Wider | 0 |
| Media: Advertising, Printing & Publishing | 37 | 37 | 0 | Tighter | 0 |
| Retail | 45 | 41 | -5 | Tighter | 0 |
Stay up-to-date with monthly summaries.
Related Resources
About SOLVE
SOLVE is the leading market data platform provider for fixed-income securities, trusted by sophisticated buy-side and sell-side firms worldwide. Founded in 2011, SOLVE leverages its AI-driven technology and deep industry expertise to offer unparalleled transparency into markets, reduce risk, and save hundreds of hours across front-office workflows. With the largest real-time datasets for Securitized Products, Municipal Bonds, Corporate Bonds, Syndicated Bank Loans, Convertible Bonds, CDS, and Private Credit, SOLVE empowers clients to transform the way they bring new securities to market, trade on secondary markets, and value highly illiquid securities. Headquartered in Connecticut, with offices across the globe, SOLVE is the definitive source for market pricing in fixed-income markets.
