Investment Grade CDS Market Summary – July 2023
GET OUR CDS MARKET SUMMARIES STRAIGHT TO YOUR INBOX. LEARN MORE
Investment Grade CDS Market Summary:July 2023
Our newsletter presents key trends derived from observable Credit Default Swaps pricing data over a monthly period.
Top 10 Outperformers
Showcases the top 10 IG CDS “outperformers” based on the largest mid spread decreases between 7/1/23 – 7/31/23
| RANK | BOND NAME | ISSUER | % CHANGE | BPS CHANGE | SPRD | SPRD-1 MONTH | DEALERS |
|---|---|---|---|---|---|---|---|
| 1 | NMAC 5Y | NISSAN MTR ACCEP CORP | -34.5% | -51 | 96 | 146 | 4 |
| 2 | AAPL 5Y | APPLE INC | -28.0% | -8 | 20 | 28 | 2 |
| 3 | ASH 5Y | ASHLAND GLOBAL HOLDINGS | -26.7% | -37 | 100 | 137 | 4 |
| 4 | MPC 5Y | MPC LLC | -24.6% | -23 | 71 | 94 | 6 |
| 5 | VLO 5Y | PREMCOR REFNG GROUP INC | -23.8% | -22 | 69 | 91 | 6 |
| 6 | CNQCN 5Y | CANADIAN NAT RES LTD | -23.4% | -18 | 59 | 77 | 6 |
| 7 | HAL 5Y | DRESSER INDS INC | -22.5% | -18 | 61 | 79 | 7 |
| 8 | NUNPC 5Y | NIPPON PAPER INDUSTRIES CO LTD | -22.5% | -38 | 132 | 170 | 4 |
| 9 | EQM 5Y | EQT MIDSTREAM PARTNERS L P | -22.2% | -41 | 144 | 184 | 3 |
| 10 | DVN 5Y | DEVON ENERGY CORP | -22.1% | -27 | 96 | 123 | 6 |
Top 10 Underperformers
Showcases the top 10 IG CDS “underperformers” based on the largest mid spread increases between 7/1/23 – 7/31/23
| RANK | BOND NAME | ISSUER | % CHANGE | BPS CHANGE | SPRD | SPRD-1 MONTH | DEALERS |
|---|---|---|---|---|---|---|---|
| 1 | FSA_AA 5Y | ASSURED GUARANTY MUNICIPAL CORP. | 28.9% | 17 | 77 | 60 | 5 |
| 2 | RTX 5Y | UNITED TECHNOLOGIES CORP | 15.4% | 6 | 45 | 39 | 4 |
| 3 | OMC 5Y | OMNICOM GROUP INC | 15.3% | 6 | 49 | 42 | 4 |
| 4 | ALL 5Y | ALLIED CAP COML MTG TR | 9.0% | 3 | 31 | 28 | 3 |
| 5 | ATT 5Y | AT&T CORP | 5.6% | 6 | 105 | 100 | 4 |
| 6 | TAKEDA 5Y | TAKEDA PHARMACEUTICAL CO LTD | 4.4% | 2 | 37 | 35 | 3 |
| 7 | HONDA 5Y | AMERICAN HONDA FIN CORP MEDIUM | 3.9% | 1 | 19 | 19 | 3 |
| 8 | LUV 5Y | AIRTRAN HLDGS INC | 3.1% | 3 | 96 | 93 | 3 |
| 9 | CAG 5Y | CONAGRA FOODS INC | 3.0% | 2 | 67 | 65 | 4 |
| 10 | MGNLN 5Y | M&G PLC | 2.9% | 2.5 | 87 | 85 | 3 |
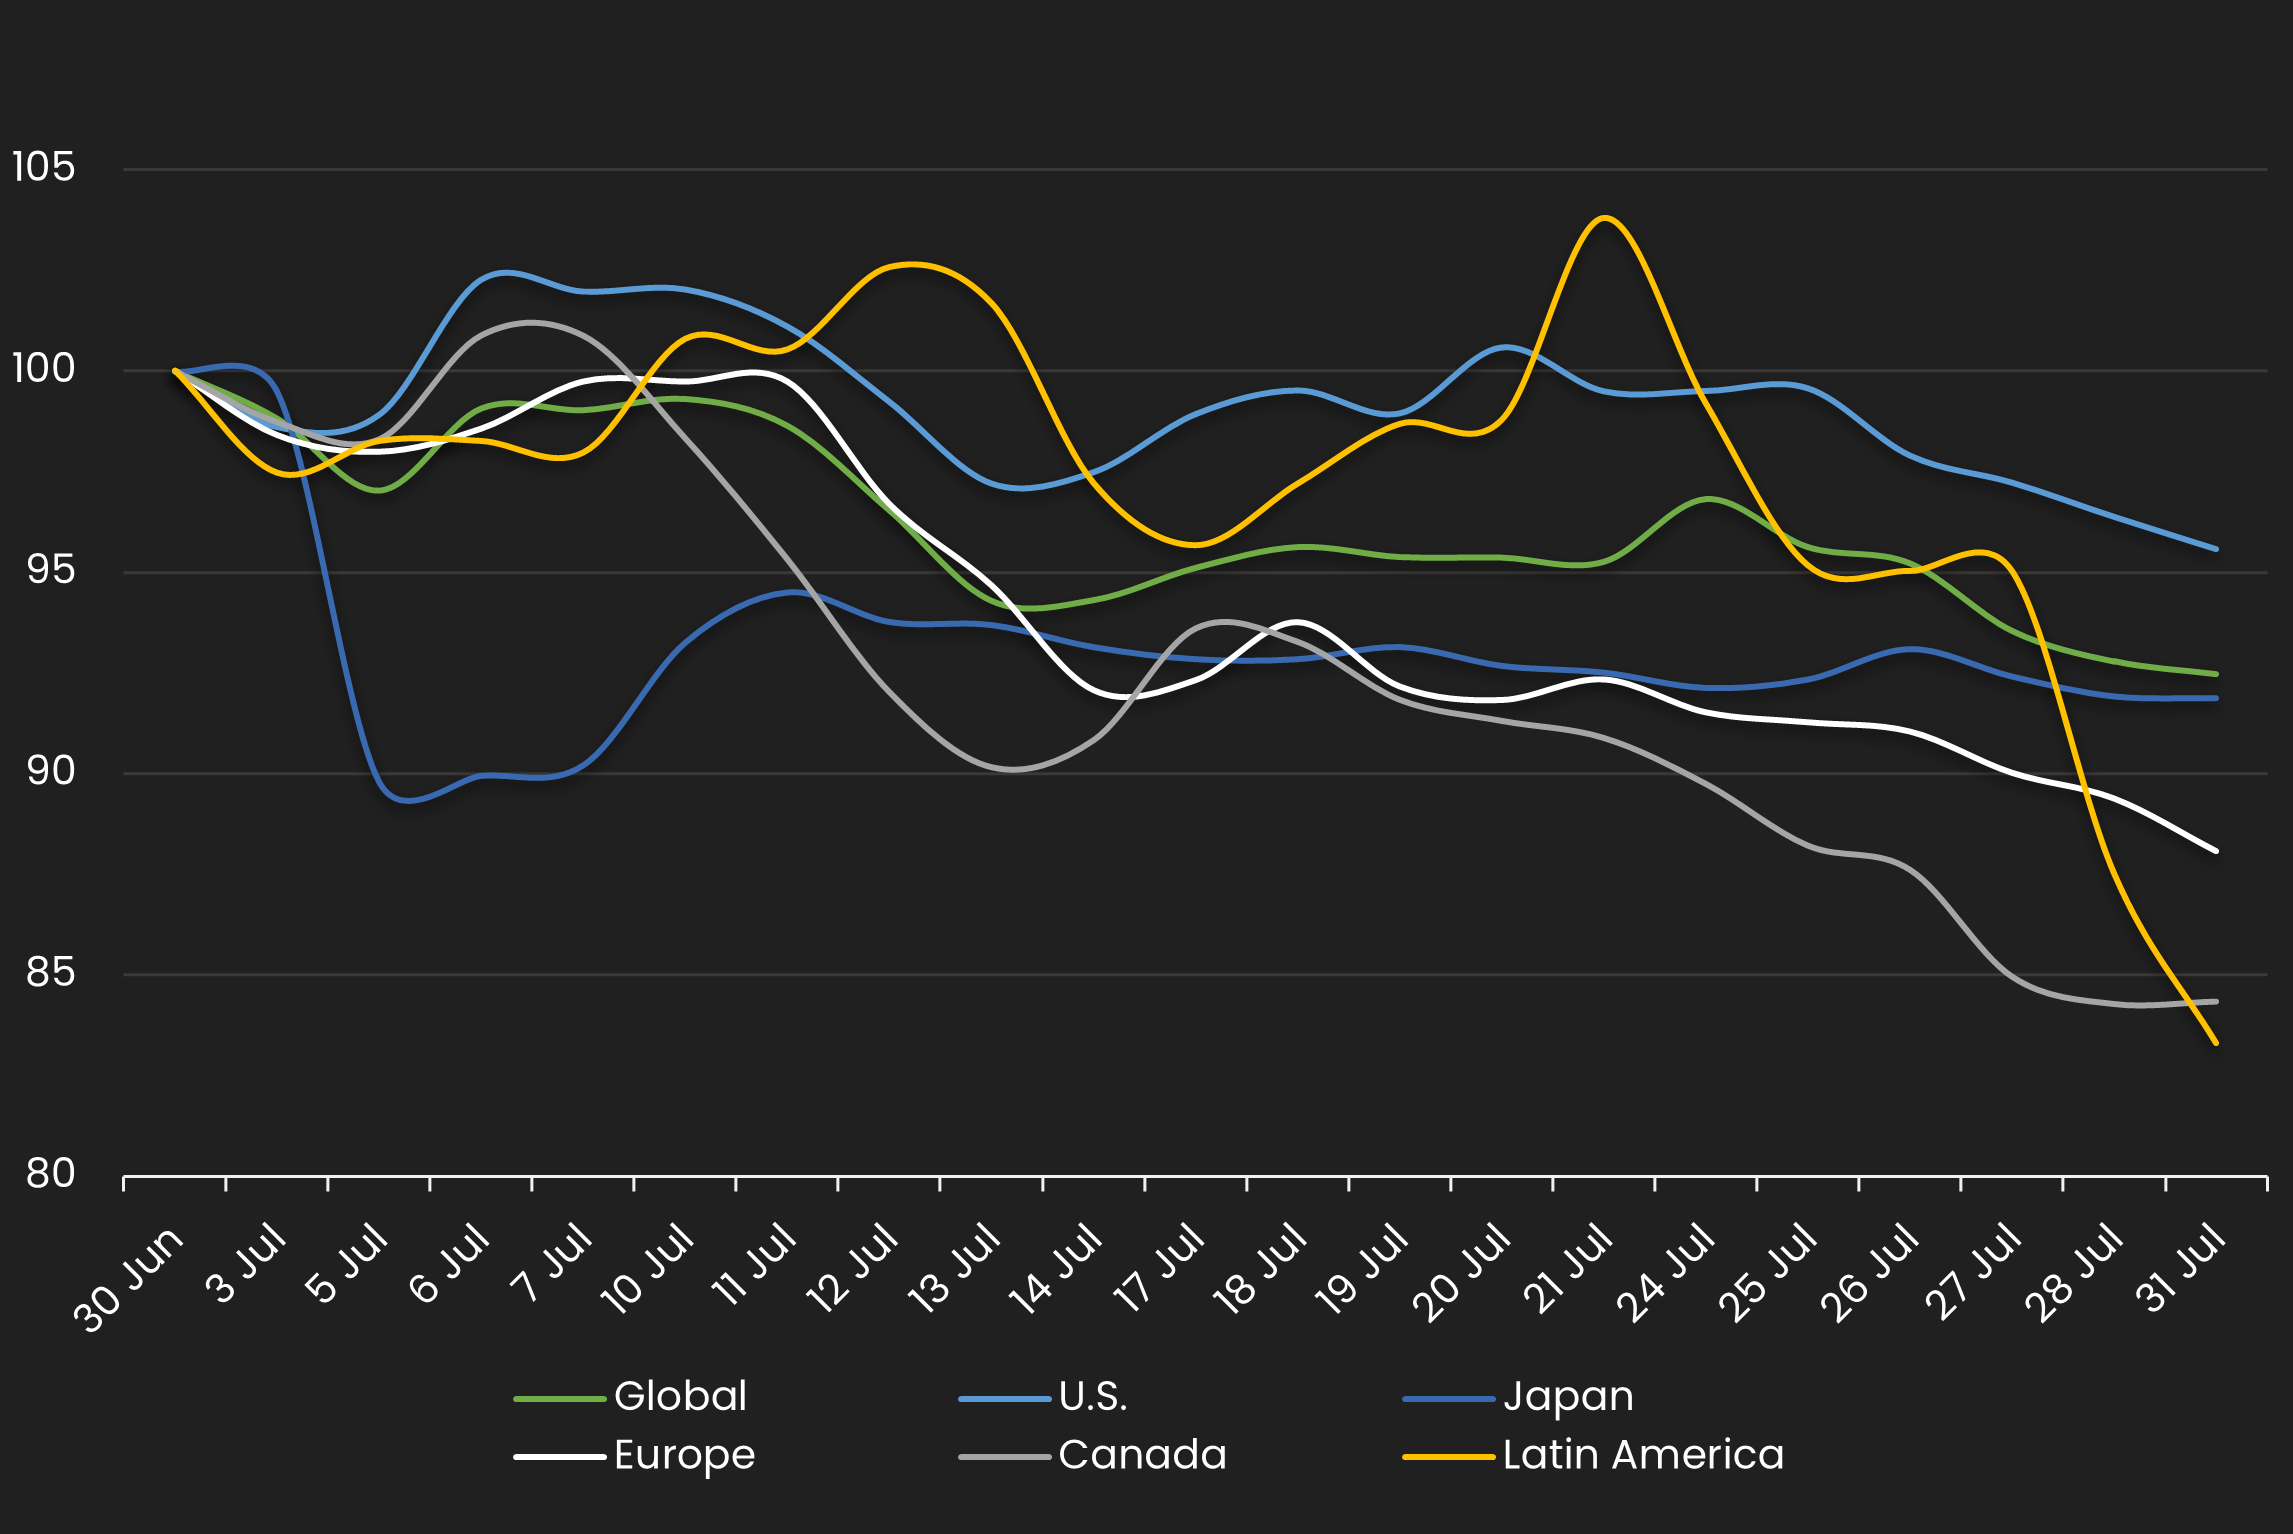
Normalized IG Spread by Region
Displays the IG CDS spread by region between 7/1/23 – 7/31/23 Results are based on 5 select regions, however, we offer data across 12 regions
IG Spread by Region – Monthly Comparison
Exhibits the IG mid spread by region for the month ending 6/30/23 vs. the month ending 7/31/23
| REGION | PREVIOUS SPREAD | CURRENT SPREAD | BPS CHANGE | MONTHLY PERFORMANCE | CDS COUNT |
|---|---|---|---|---|---|
| Global | 65 | 60 | -5 | Tighter | 521 |
| U.S. | 63 | 60 | -3 | Tighter | 181 |
| Japan | 37 | 34 | -3 | Tighter | 44 |
| Europe | 70 | 62 | -8 | Tighter | 151 |
| Canada | 69 | 59 | -11 | Tighter | 5 |
| Latin America | 78 | 65 | -13 | Tighter | 9 |
Normalized IG Spread by Industry
Displays the IG CDS spread by industry between 7/1/23 – 7/31/23 Results are based on 5 select industry sectors, however, we offer data across 36 sectors

IG Spread by Industries – Monthly Comparison
Exhibits the IG spread by industry for the month ending 6/30/23 vs. the month ending 7/31/23
| INDUSTRIES | PREVIOUS SPREAD | CURRENT SPREAD | BPS CHANGE | MONTHLY PERFORMANCE | CDS COUNT |
|---|---|---|---|---|---|
| All Industries | 65 | 60 | -5 | Tighter | 522.00 |
| Healthcare & Pharmaceuticals | 44 | 40 | -5 | Tighter | 25.00 |
| Energy: Oil & Gas | 79 | 69 | -11 | Tighter | 28.00 |
| Insurance | 62 | 50 | -12 | Tighter | 25.00 |
| Real Estate | 101 | 96 | -6 | Tighter | 25.00 |
| Telecommunications | 45 | 41 | -4 | Tighter | 26.00 |
Stay up-to-date with monthly summaries.
Related Resources
About SOLVE
SOLVE is the leading market data platform provider for fixed-income securities, trusted by sophisticated buy-side and sell-side firms worldwide. Founded in 2011, SOLVE leverages its AI-driven technology and deep industry expertise to offer unparalleled transparency into markets, reduce risk, and save hundreds of hours across front-office workflows. With the largest real-time datasets for Securitized Products, Municipal Bonds, Corporate Bonds, Syndicated Bank Loans, Convertible Bonds, CDS, and Private Credit, SOLVE empowers clients to transform the way they bring new securities to market, trade on secondary markets, and value highly illiquid securities. Headquartered in Connecticut, with offices across the globe, SOLVE is the definitive source for market pricing in fixed-income markets.
