Investment Grade CDS Market Summary – April 2025
GET OUR CDS MARKET SUMMARIES STRAIGHT TO YOUR INBOX. LEARN MORE
Investment Grade CDS Market April 2025
Our newsletter presents key trends derived from observable Credit Default Swaps pricing data over a monthly period.
Top 10 Outperformers
Showcases the top 10 IG CDS “outperformers” based on the largest mid spread decreases between 4/1/25 – 4/30/25
| RANK | BOND NAME | ISSUER | % CHANGE | BPS CHANGE | SPRD | SPRD-1 MONTH | DEALERS |
|---|---|---|---|---|---|---|---|
| 1 | COFB 5Y | CAPITAL ONE FINL CORP | -24.3% | -14 | 44 | 58 | 3 |
| 2 | HONDA 5Y | AMERICAN HONDA FIN CORP MEDIUM | -15.8% | -11 | 56 | 67 | 4 |
| 3 | KPN 5Y | ROYAL KPN NV | -12.4% | -6 | 44 | 50 | 5 |
| 4 | SWFP 5Y | SODEXO SA | -10.8% | -7 | 55 | 61 | 5 |
| 5 | KHC 5Y | KRAFT HEINZ FOODS CO | -10.8% | -6 | 50 | 55 | 4 |
| 6 | DDS 5Y | DILLARD DEPT STORES INC | -10.5% | -10 | 90 | 100 | 2 |
| 7 | TJX 5Y | TJX COS INC NEW | -9.2% | -5 | 49 | 54 | 2 |
| 8 | ALTRIA 5Y | ALTRIA GROUP INC | -9.0% | -5 | 47 | 51 | 3 |
| 9 | CPB 5Y | CAMPBELL SOUP CO | -8.0% | -4 | 48 | 53 | 4 |
| 10 | AVT 5Y | AVNET INC | -6.1% | -6 | 90 | 96 | 3 |
Top 10 Underperformers
Showcases the top 10 IG CDS “underperformers” based on the largest mid spread increases between 4/1/25 – 4/30/25
| RANK | BOND NAME | ISSUER | % CHANGE | BPS CHANGE | SPRD | SPRD-1 MONTH | DEALERS |
|---|---|---|---|---|---|---|---|
| 1 | CKHH 5Y | CK HUTCHISON INTL 16 LTD | 44.8% | 28 | 90 | 62 | 4 |
| 2 | FREGR 5Y | FRESENIUS SE & CO KGAA | 39.6% | 25 | 89 | 64 | 3 |
| 3 | HAL 5Y | DRESSER INDS INC | 35.8% | 26 | 99 | 73 | 4 |
| 4 | PPR 5Y | KERING SA | 34.5% | 21 | 80 | 60 | 5 |
| 5 | DBSSP 5Y | DBS BK LTD GLOBAL MEDIUM TERM | 34.2% | 12 | 49 | 37 | 2 |
| 6 | HYUELE 5Y | HYNIX SEMICONDUCTOR INC | 34.2% | 22 | 88 | 65 | 3 |
| 7 | HESS 5Y | AMERADA HESS CORP | 33.0% | 13 | 53 | 40 | 4 |
| 8 | NOMURA 5Y | NOMURA HLDGS INC | 32.7% | 23 | 93 | 70 | 2 |
| 9 | DOW 5Y | DOW CAP B V | 31.7% | 24 | 99 | 75 | 3 |
| 10 | GALPPL 5Y | GALP ENERGIA SGPS SA | 30.3% | 22.4 | 96 | 74 | 5 |
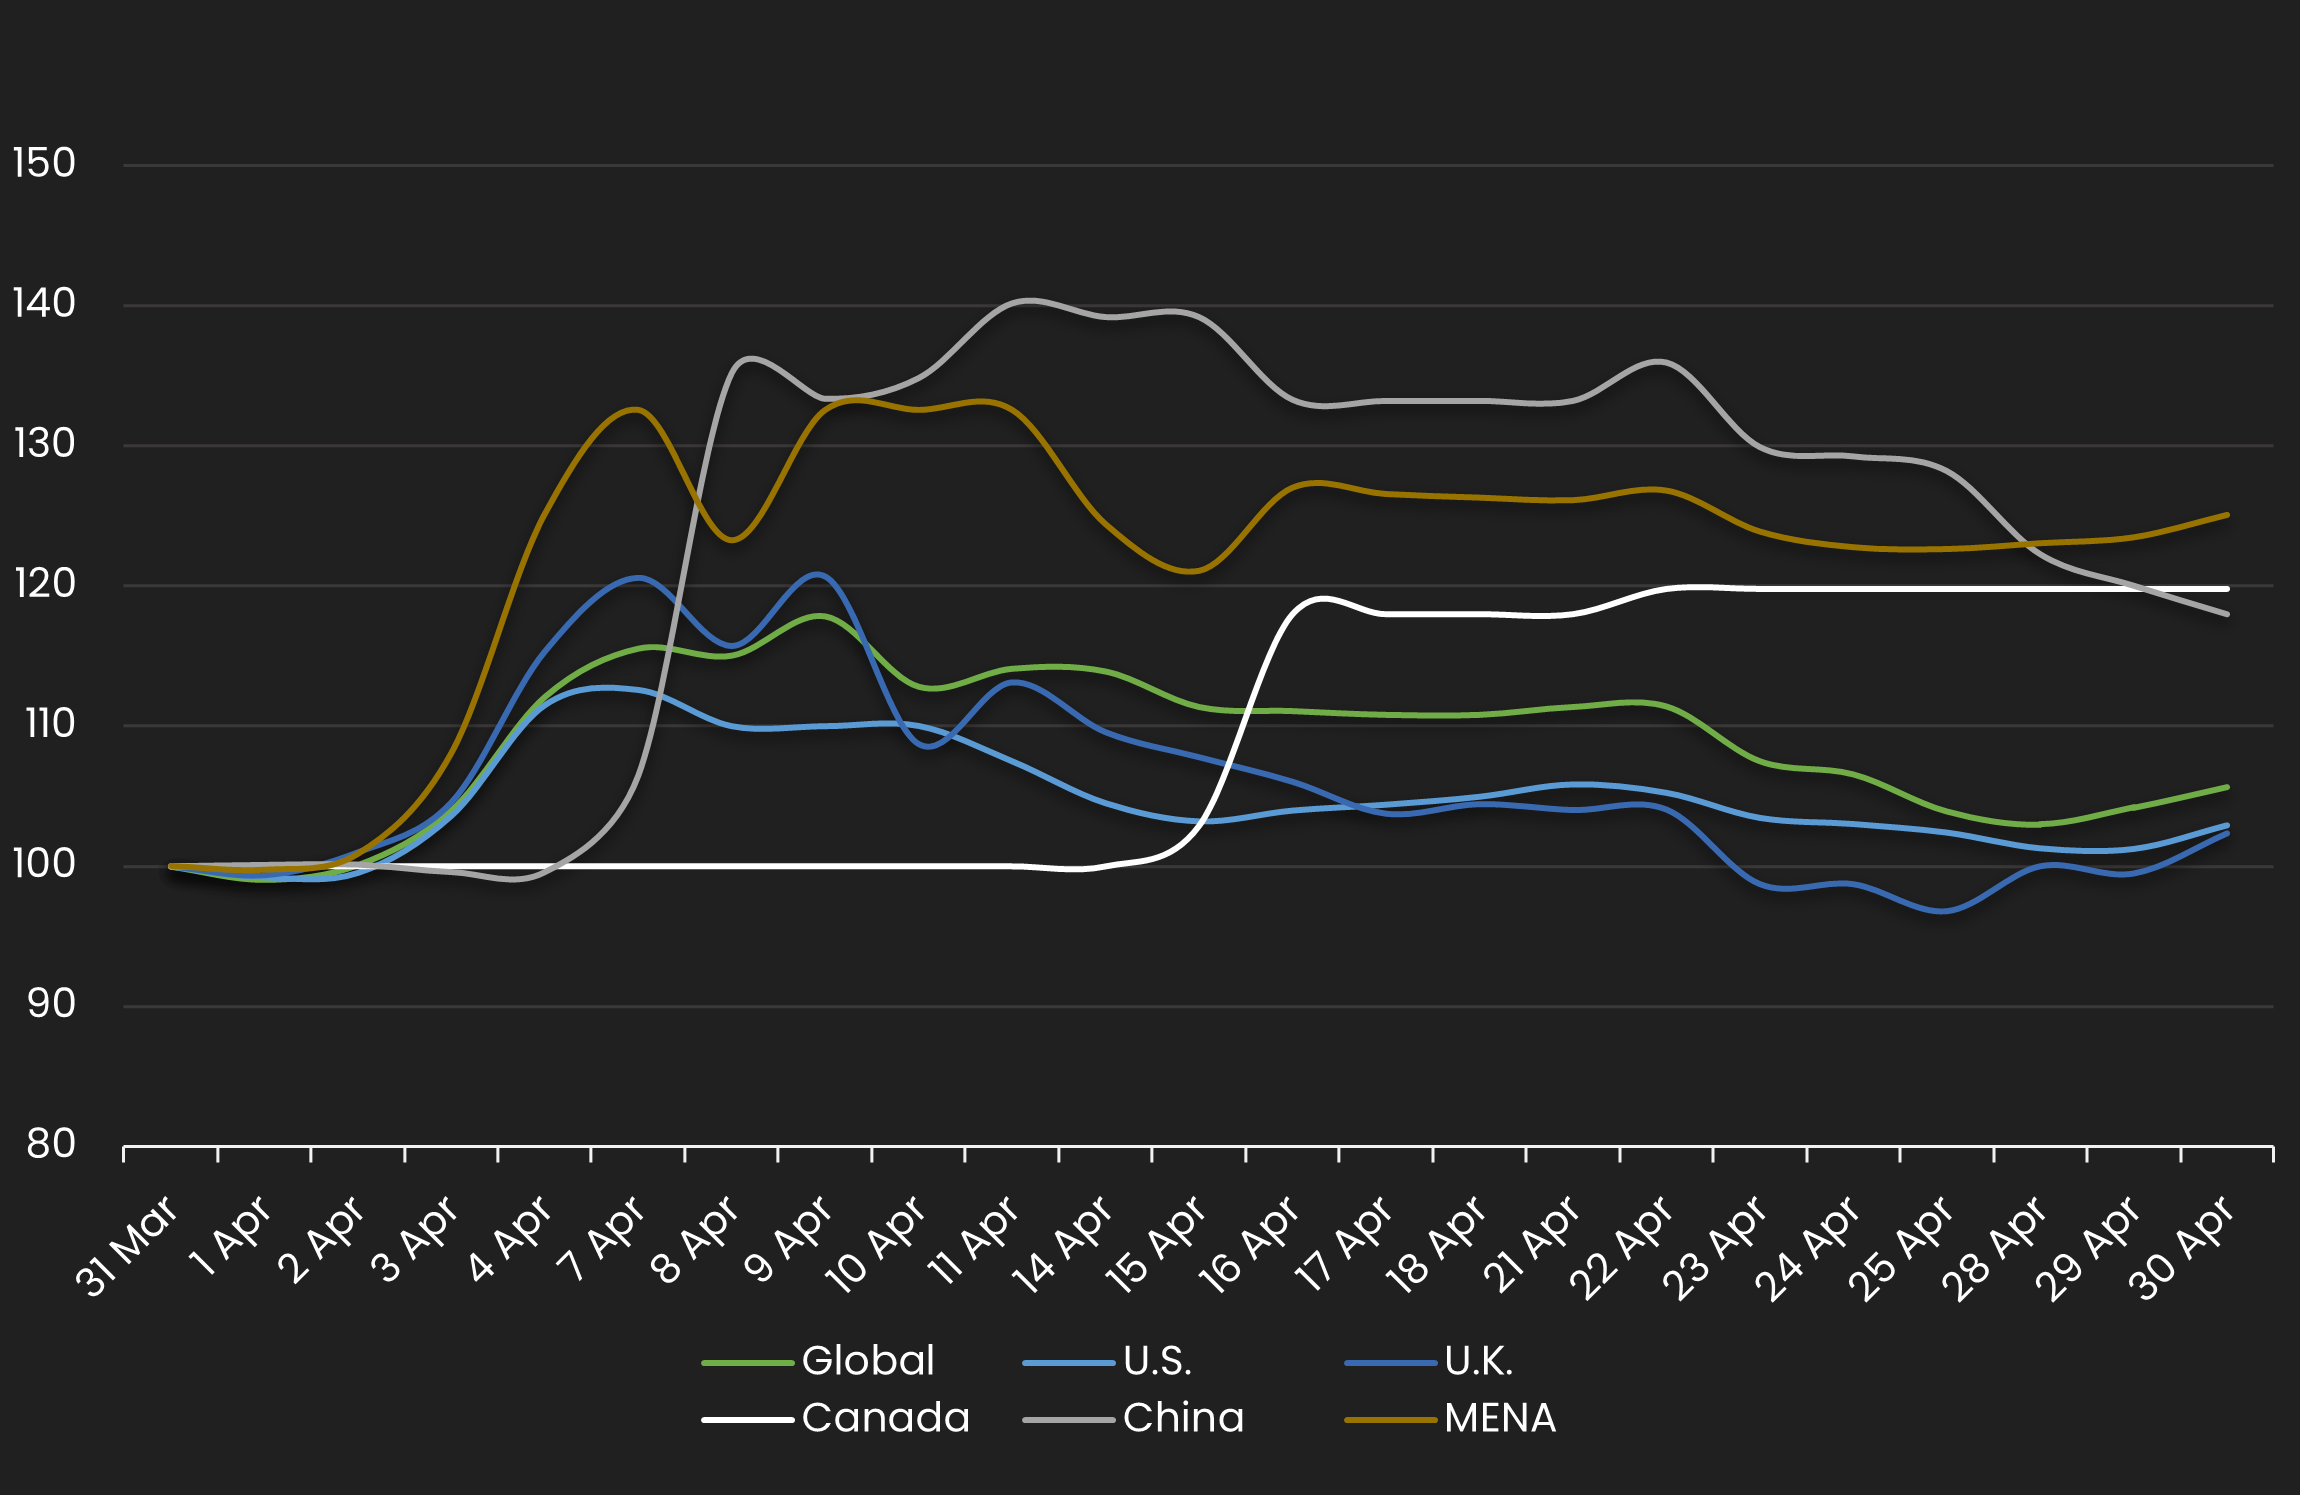
Normalized IG Spread by Region
Displays the IG CDS spread by region between 4/1/25 – 4/30/25 Results are based on 5 select regions, however, we offer data across 12 regions
IG Spread by Region – Monthly Comparison
Exhibits the IG mid spread by region for the month ending 3/31/24 vs. the month ending 4/30/25
| REGION | PREVIOUS SPREAD | CURRENT SPREAD | BPS CHANGE | MONTHLY PERFORMANCE | CDS COUNT |
|---|---|---|---|---|---|
| Global | 54 | 57 | 3 | Wider | 580 |
| U.S. | 53 | 54 | 2 | Wider | 239 |
| U.K. | 63 | 64 | 1 | Wider | 41 |
| Canada | 56 | 67 | 11 | Wider | 16 |
| China | 54 | 64 | 10 | Wider | 9 |
| APAC | 56 | 68 | 12 | Wider | 43 |
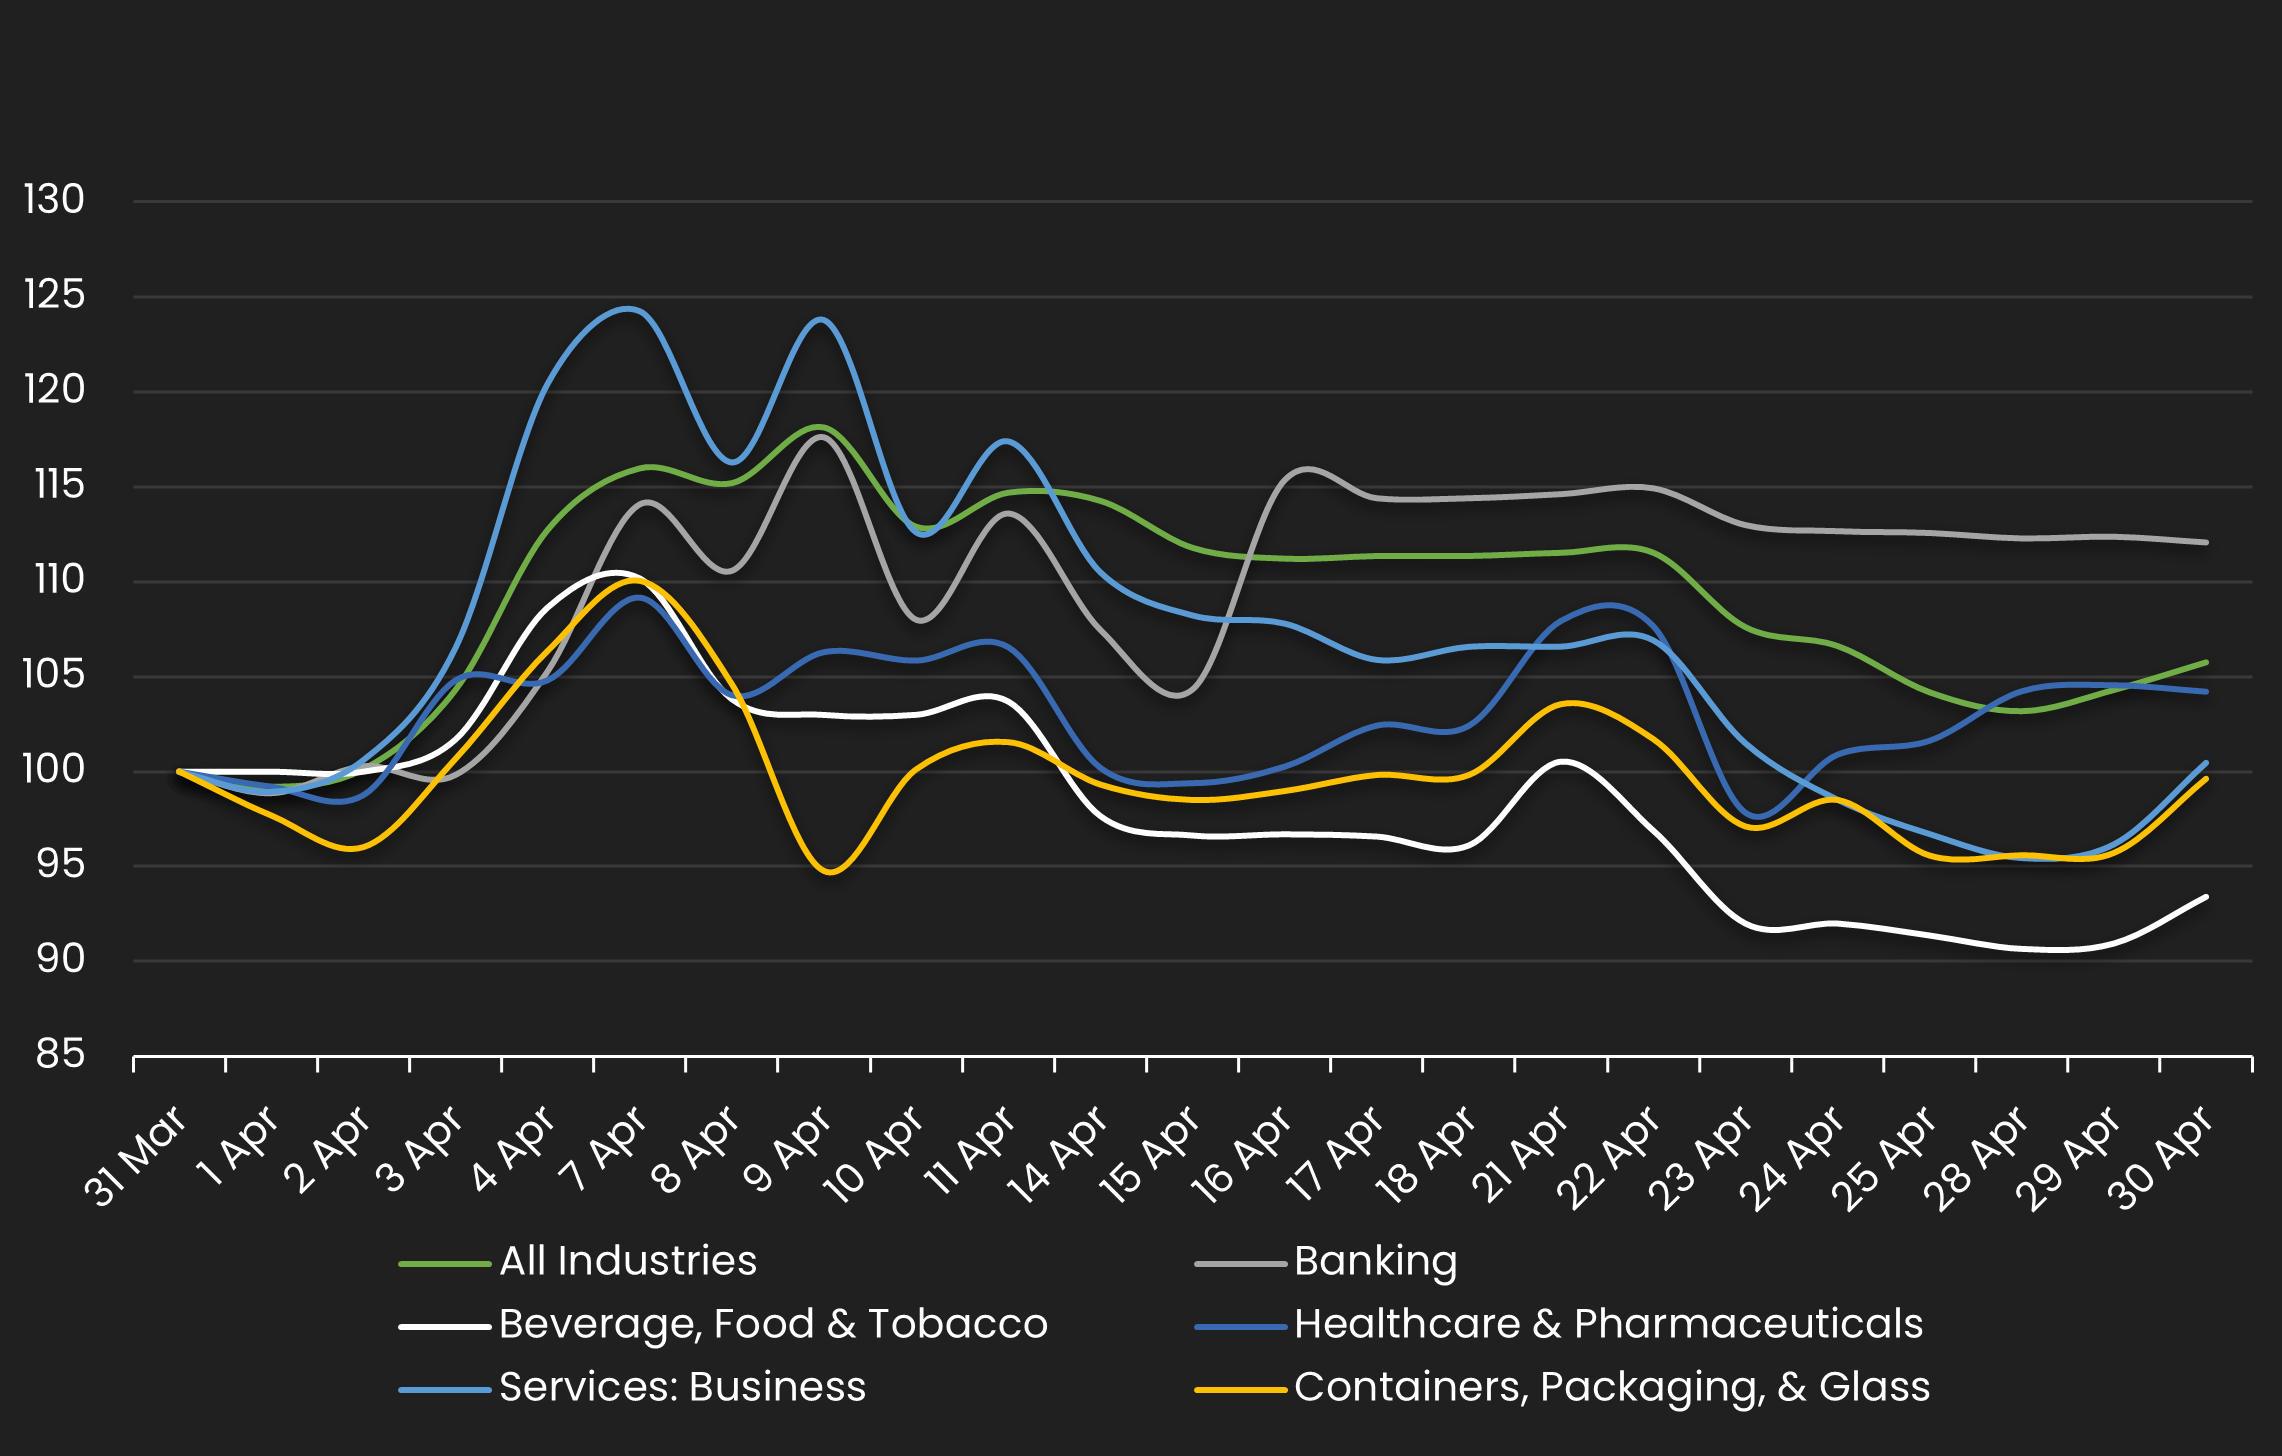
Normalized IG Spread by Industry
Displays the IG CDS spread by industry between 4/1/25 – 4/30/25 Results are based on 5 select industry sectors, however, we offer data across 36 sectors
IG Spread by Industries – Monthly Comparison
Exhibits the IG spread by industry for the month ending 3/31/24 vs. the month ending 4/30/25
| INDUSTRIES | PREVIOUS SPREAD | CURRENT SPREAD | BPS CHANGE | MONTHLY PERFORMANCE | CDS COUNT |
|---|---|---|---|---|---|
| All Industries | 54 | 57 | 3 | Wider | 582.00 |
| Banking | 52 | 58 | 6 | Wider | 46.00 |
| Beverage, Food & Tobacco | 50 | 47 | -3 | Tighter | 33.00 |
| Healthcare & Pharmaceuticals | 43 | 45 | 2 | Wider | 31.00 |
| Services: Business | 94 | 95 | 0 | Wider | 3.00 |
| Containers, Packaging, & Glass | 31 | 30 | 0 | Tighter | 2.00 |
Stay up-to-date with monthly summaries.
Related Resources
About SOLVE
SOLVE is the leading market data platform provider for fixed-income securities, trusted by sophisticated buy-side and sell-side firms worldwide. Founded in 2011, SOLVE leverages its AI-driven technology and deep industry expertise to offer unparalleled transparency into markets, reduce risk, and save hundreds of hours across front-office workflows. With the largest real-time datasets for Securitized Products, Municipal Bonds, Corporate Bonds, Syndicated Bank Loans, Convertible Bonds, CDS, and Private Credit, SOLVE empowers clients to transform the way they bring new securities to market, trade on secondary markets, and value highly illiquid securities. Headquartered in Connecticut, with offices across the globe, SOLVE is the definitive source for market pricing in fixed-income markets.
