Investment Grade CDS Market Summary – January 2023
GET OUR CDS MARKET SUMMARIES STRAIGHT TO YOUR INBOX. LEARN MORE
Investment Grade CDS Market Summary: January 2023
Our newsletter presents key trends derived from observable Credit Default Swaps pricing data over a monthly period.
Top 10 Outperformers
Showcases the top 10 IG CDS “outperformers” based on the largest mid spread decreases between 1/1/22 – 1/31/23
| RANK | BOND NAME | ISSUER | % CHANGE | BPS CHANGE | SPRD | SPRD-1 MONTH | DEALERS |
|---|---|---|---|---|---|---|---|
| 1 | DBSSP 5Y | DBS BK LTD GLOBAL MEDIUM TERM | -55.2% | -21 | 17 | 38 | 2 |
| 2 | OPTUS 5Y | SINGAPORE TELECOMMUNICATIONS | -44.9% | -22 | 27 | 49 | 2 |
| 3 | CHGRID 5Y | STATE GRID CORPORATION OF CHINA | -38.1% | -34 | 55 | 89 | 3 |
| 4 | LXSGR 5Y | LANXESS FINANCE BV | -36.1% | -76 | 135 | 211 | 7 |
| 5 | BCHINA 5Y | BANK CHINA LTD | -30.3% | -26 | 61 | 88 | 3 |
| 6 | CKHH 5Y | CK HUTCHISON INTL 16 LTD | -30.2% | -19 | 44 | 63 | 2 |
| 7 | SCFER 5Y | SCHAEFFLER FINANCE BV | -30.1% | -27 | 63 | 90 | 3 |
| 8 | BA 5Y | BOEING CAP CORP INTERNOTES | -29.9% | -42 | 99 | 141 | 3 |
| 9 | SUNHUN 5Y | SUN HUNG KAI PPTYS LTD | -28.6% | -24 | 59 | 83 | 3 |
| 10 | VLO 5Y | PREMCOR REFNG GROUP INC | -28.6% | -29 | 72 | 100 | 3 |
Top 10 Underperformers
Showcases the top 10 IG CDS “underperformers” based on the largest mid spread increases between 1/1/23 – 1/31/23
| RANK | BOND NAME | ISSUER | % CHANGE | BPS CHANGE | SPRD | SPRD-1 MONTH | DEALERS |
|---|---|---|---|---|---|---|---|
| 1 | KIM 5Y | KIMCO REALTY CORP | 33.0% | 21 | 87 | 65 | 2 |
| 2 | BAX 5Y | BAXTER INTL INC | 21.4% | 14 | 79 | 65 | 4 |
| 3 | DXC 5Y | DXC TECHNOLOGY CO | 12.5% | 22 | 201 | 178 | 3 |
| 4 | NUNPC 5Y | NIPPON PAPER INDUSTRIES CO LTD | 9.6% | 20 | 229 | 209 | 3 |
| 5 | DGX 5Y | AMERIPATH INC | 9.3% | 4 | 44 | 41 | 4 |
| 6 | BXP 5Y | BOSTON PPTYS INC | 6.1% | 5 | 92 | 87 | 2 |
| 7 | GIS 5Y | GENERAL MLS INC | 5.7% | 3 | 47 | 45 | 4 |
| 8 | NEE 5Y | FPL ENERGY AMERN WIND LLC | 5.2% | 4 | 80 | 76 | 4 |
| 9 | CPB 5Y | CAMPBELL SOUP CO | 3.2% | 2 | 51 | 50 | 4 |
| 10 | NIPSTL 5Y | SUMITOMO METAL INDUSTRIES LTD | 3.2% | 1.7 | 55 | 53 | 3 |
Normalized IG Spread by Region
Displays the IG CDS spread by region between 1/1/23 – 1/31/23 Results are based on 5 select regions, however, we offer data across 12 regions
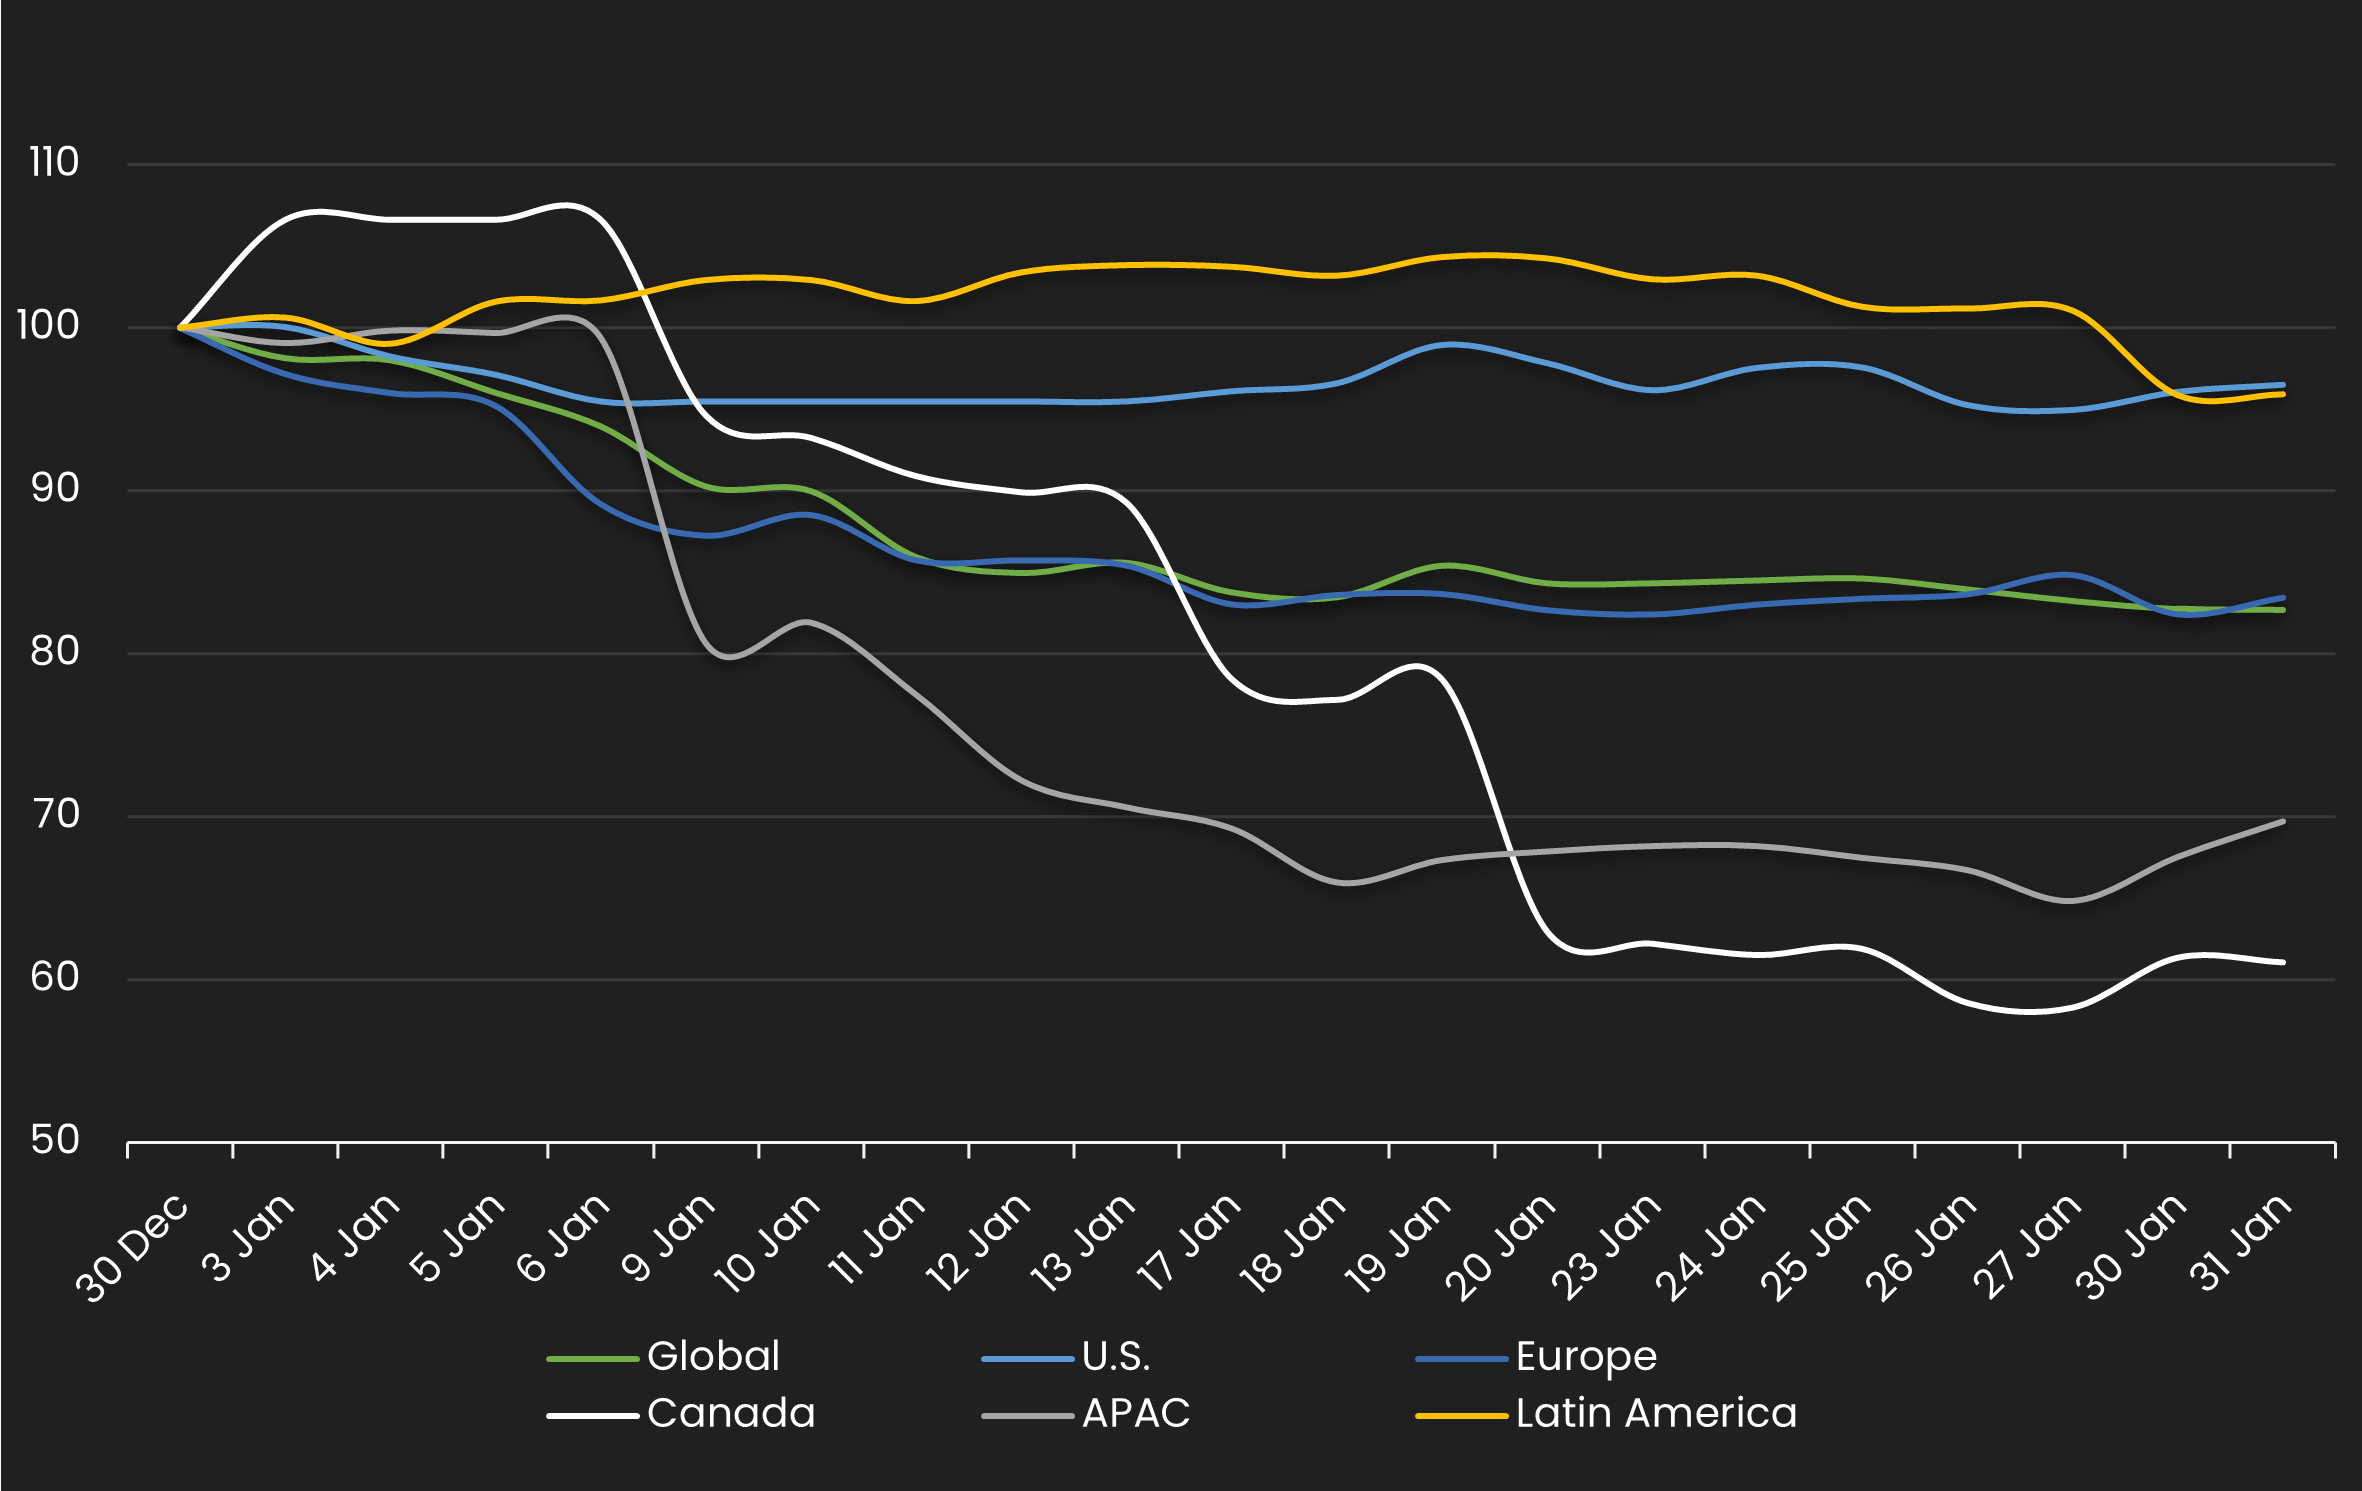
IG Spread by Region – Monthly Comparison
Exhibits the IG mid spread by region for the month ending 12/31/22 vs. the month ending 1/31/23
| REGION | PREVIOUS SPREAD | CURRENT SPREAD | BPS CHANGE | MONTHLY PERFORMANCE | CDS COUNT |
|---|---|---|---|---|---|
| Global | 79 | 66 | -14 | Tighter | 534 |
| U.S. | 68 | 66 | -2 | Tighter | 194 |
| Europe | 83 | 69 | -14 | Tighter | 151 |
| Canada | 92 | 56 | -36 | Tighter | 7 |
| APAC | 97 | 68 | -29 | Tighter | 31 |
| Latin America | 113 | 108 | -5 | Tighter | 10 |
Normalized IG Spread by Industry
Displays the IG CDS spread by industry between 1/1/23 – 1/31/23 Results are based on 5 select industry sectors, however, we offer data across 36 sectors
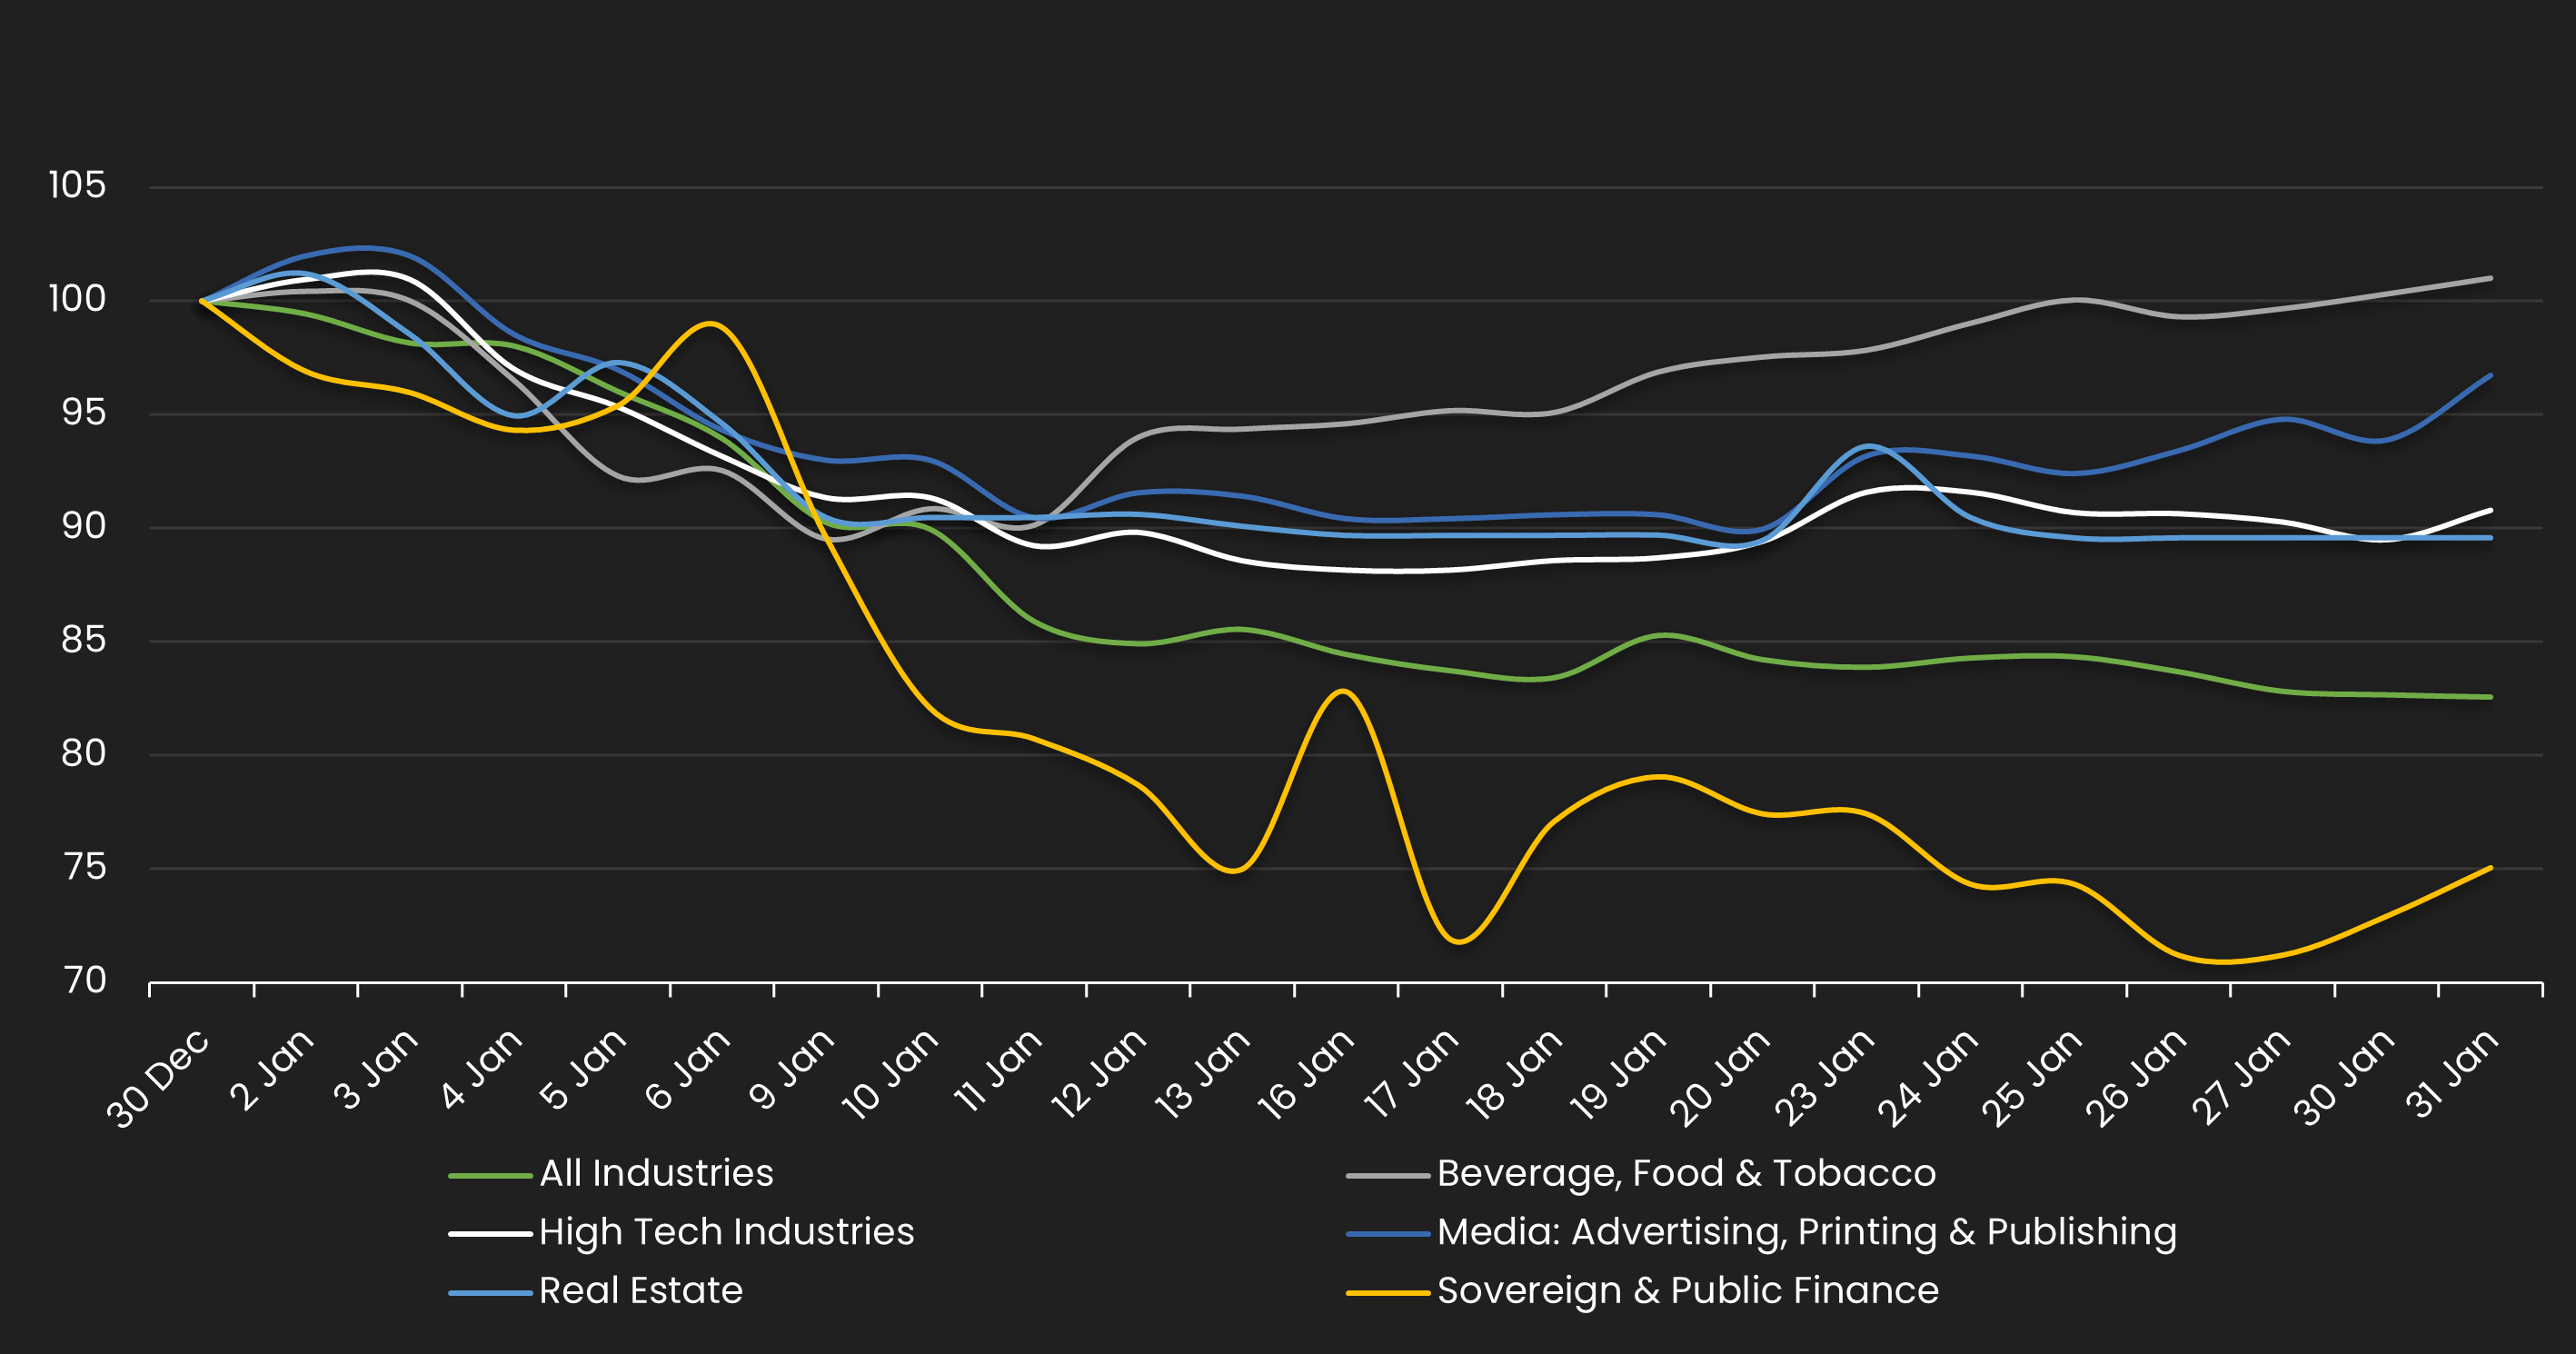
IG Spread by Industries – Monthly Comparison
Exhibits the IG spread by industry for the month ending 12/31/22 vs. the month ending 1/31/23
| INDUSTRIES | PREVIOUS SPREAD | CURRENT SPREAD | BPS CHANGE | MONTHLY PERFORMANCE | CDS COUNT |
|---|---|---|---|---|---|
| All Industries | 79 | 66 | -14 | Tighter | 535.00 |
| Beverage, Food & Tobacco | 50 | 50 | 1 | Wider | 28.00 |
| High Tech Industries | 42 | 39 | -4 | Tighter | 18.00 |
| Media: Advertising, Printing & Publishing | 79 | 77 | -3 | Tighter | 3.00 |
| Real Estate | 112 | 100 | -12 | Tighter | 27.00 |
| Sovereign & Public Finance | 74 | 56 | -19 | Tighter | 60.00 |
Stay up-to-date with monthly summaries.
Related Resources
About SOLVE
SOLVE is the leading market data platform provider for fixed-income securities, trusted by sophisticated buy-side and sell-side firms worldwide. Founded in 2011, SOLVE leverages its AI-driven technology and deep industry expertise to offer unparalleled transparency into markets, reduce risk, and save hundreds of hours across front-office workflows. With the largest real-time datasets for Securitized Products, Municipal Bonds, Corporate Bonds, Syndicated Bank Loans, Convertible Bonds, CDS, and Private Credit, SOLVE empowers clients to transform the way they bring new securities to market, trade on secondary markets, and value highly illiquid securities. Headquartered in Connecticut, with offices across the globe, SOLVE is the definitive source for market pricing in fixed-income markets.
