High Yield CDS Market Summary – August 2024
GET OUR CDS MARKET SUMMARIES STRAIGHT TO YOUR INBOX. LEARN MORE
High Yield CDS Market Summary:August 2024
Our newsletter presents key trends derived from observable Credit Default Swaps pricing data over a monthly period.
Top 10 Outperformers
Showcases the top 10 HY CDS “outperformers” based on the largest mid spread decreases between 8/1/24 – 8/31/24
| RANK | BOND NAME | ISSUER | % CHANGE | BPS CHANGE | SPRD | SPRD-1 MONTH | DEALERS |
|---|---|---|---|---|---|---|---|
| 1 | OLN 5Y | OLIN CORP | -26.8% | -35 | 96 | 132 | 4 |
| 2 | TATAMTR 5Y | JAGUAR LD ROVER PLC | -21.0% | -42 | 157 | 199 | 3 |
| 3 | BAB 5Y | BRITISH AIRWAYS | -15.8% | -23 | 123 | 146 | 3 |
| 4 | VISTRAENE 5Y | VISTRA ENERGY CORP | -15.7% | -21 | 115 | 136 | 2 |
| 5 | NVFVES 5Y | NOVAFIVES SAS | -14.8% | -21 | 122 | 144 | 4 |
| 6 | LW 5Y | LAMB WESTON | -12.6% | -17 | 116 | 133 | 4 |
| 7 | TITIM 5Y | TELECOM ITALIA SPA | -12.5% | -24 | 171 | 196 | 4 |
| 8 | AES 5Y | AES TRUST I | -11.7% | -14 | 106 | 120 | 4 |
| 9 | NRG 5Y | NRG ENERGY INC | -10.4% | -13 | 112 | 125 | 5 |
| 10 | TKAGR 5Y | VERTICAL MIDCO GMBH | -9.2% | -18 | 178 | 196 | 3 |
Top 10 Underperformers
Showcases the top 10 HY CDS “underperformers” based on the largest mid spread increases between 8/1/24 – 8/31/24
| RANK | BOND NAME | ISSUER | % CHANGE | BPS CHANGE | SPREAD | SPREAD-1 MONTH | DEALERS |
|---|---|---|---|---|---|---|---|
| 1 | MBIA_AA 5Y | MBIA INC | 89.9% | 94 | 198 | 104 | 3 |
| 2 | GT 5Y | GOODYEAR TIRE & RUBBER CO | 38.5% | 93 | 334 | 241 | 3 |
| 3 | GNW 5Y | AQGEN LIBERTY MGMT I INC | 36.1% | 28 | 106 | 78 | 3 |
| 4 | CLF 5Y | CLIFFS NAT RES INC | 32.8% | 62 | 251 | 189 | 4 |
| 5 | ZFFNGR 5Y | ZF NA CAPITAL | 20.9% | 42 | 243 | 201 | 2 |
| 6 | CABBCO 5Y | MONITCHEM HOLDCO 3 | 17.5% | 75 | 506 | 431 | 4 |
| 7 | RRD 5Y | DONNELLEY R R & SONS CO | 15.1% | 72 | 547 | 475 | 3 |
| 8 | CLAR 5Y | CLARIANT AG | 14.9% | 13 | 97 | 84 | 5 |
| 9 | MGM 5Y | MGM RESORTS INTERNATIONAL | 12.5% | 19 | 173 | 153 | 4 |
| 10 | CECGR 5Y | CECONOMY AG | 9.1% | 28 | 336 | 308 | 3 |
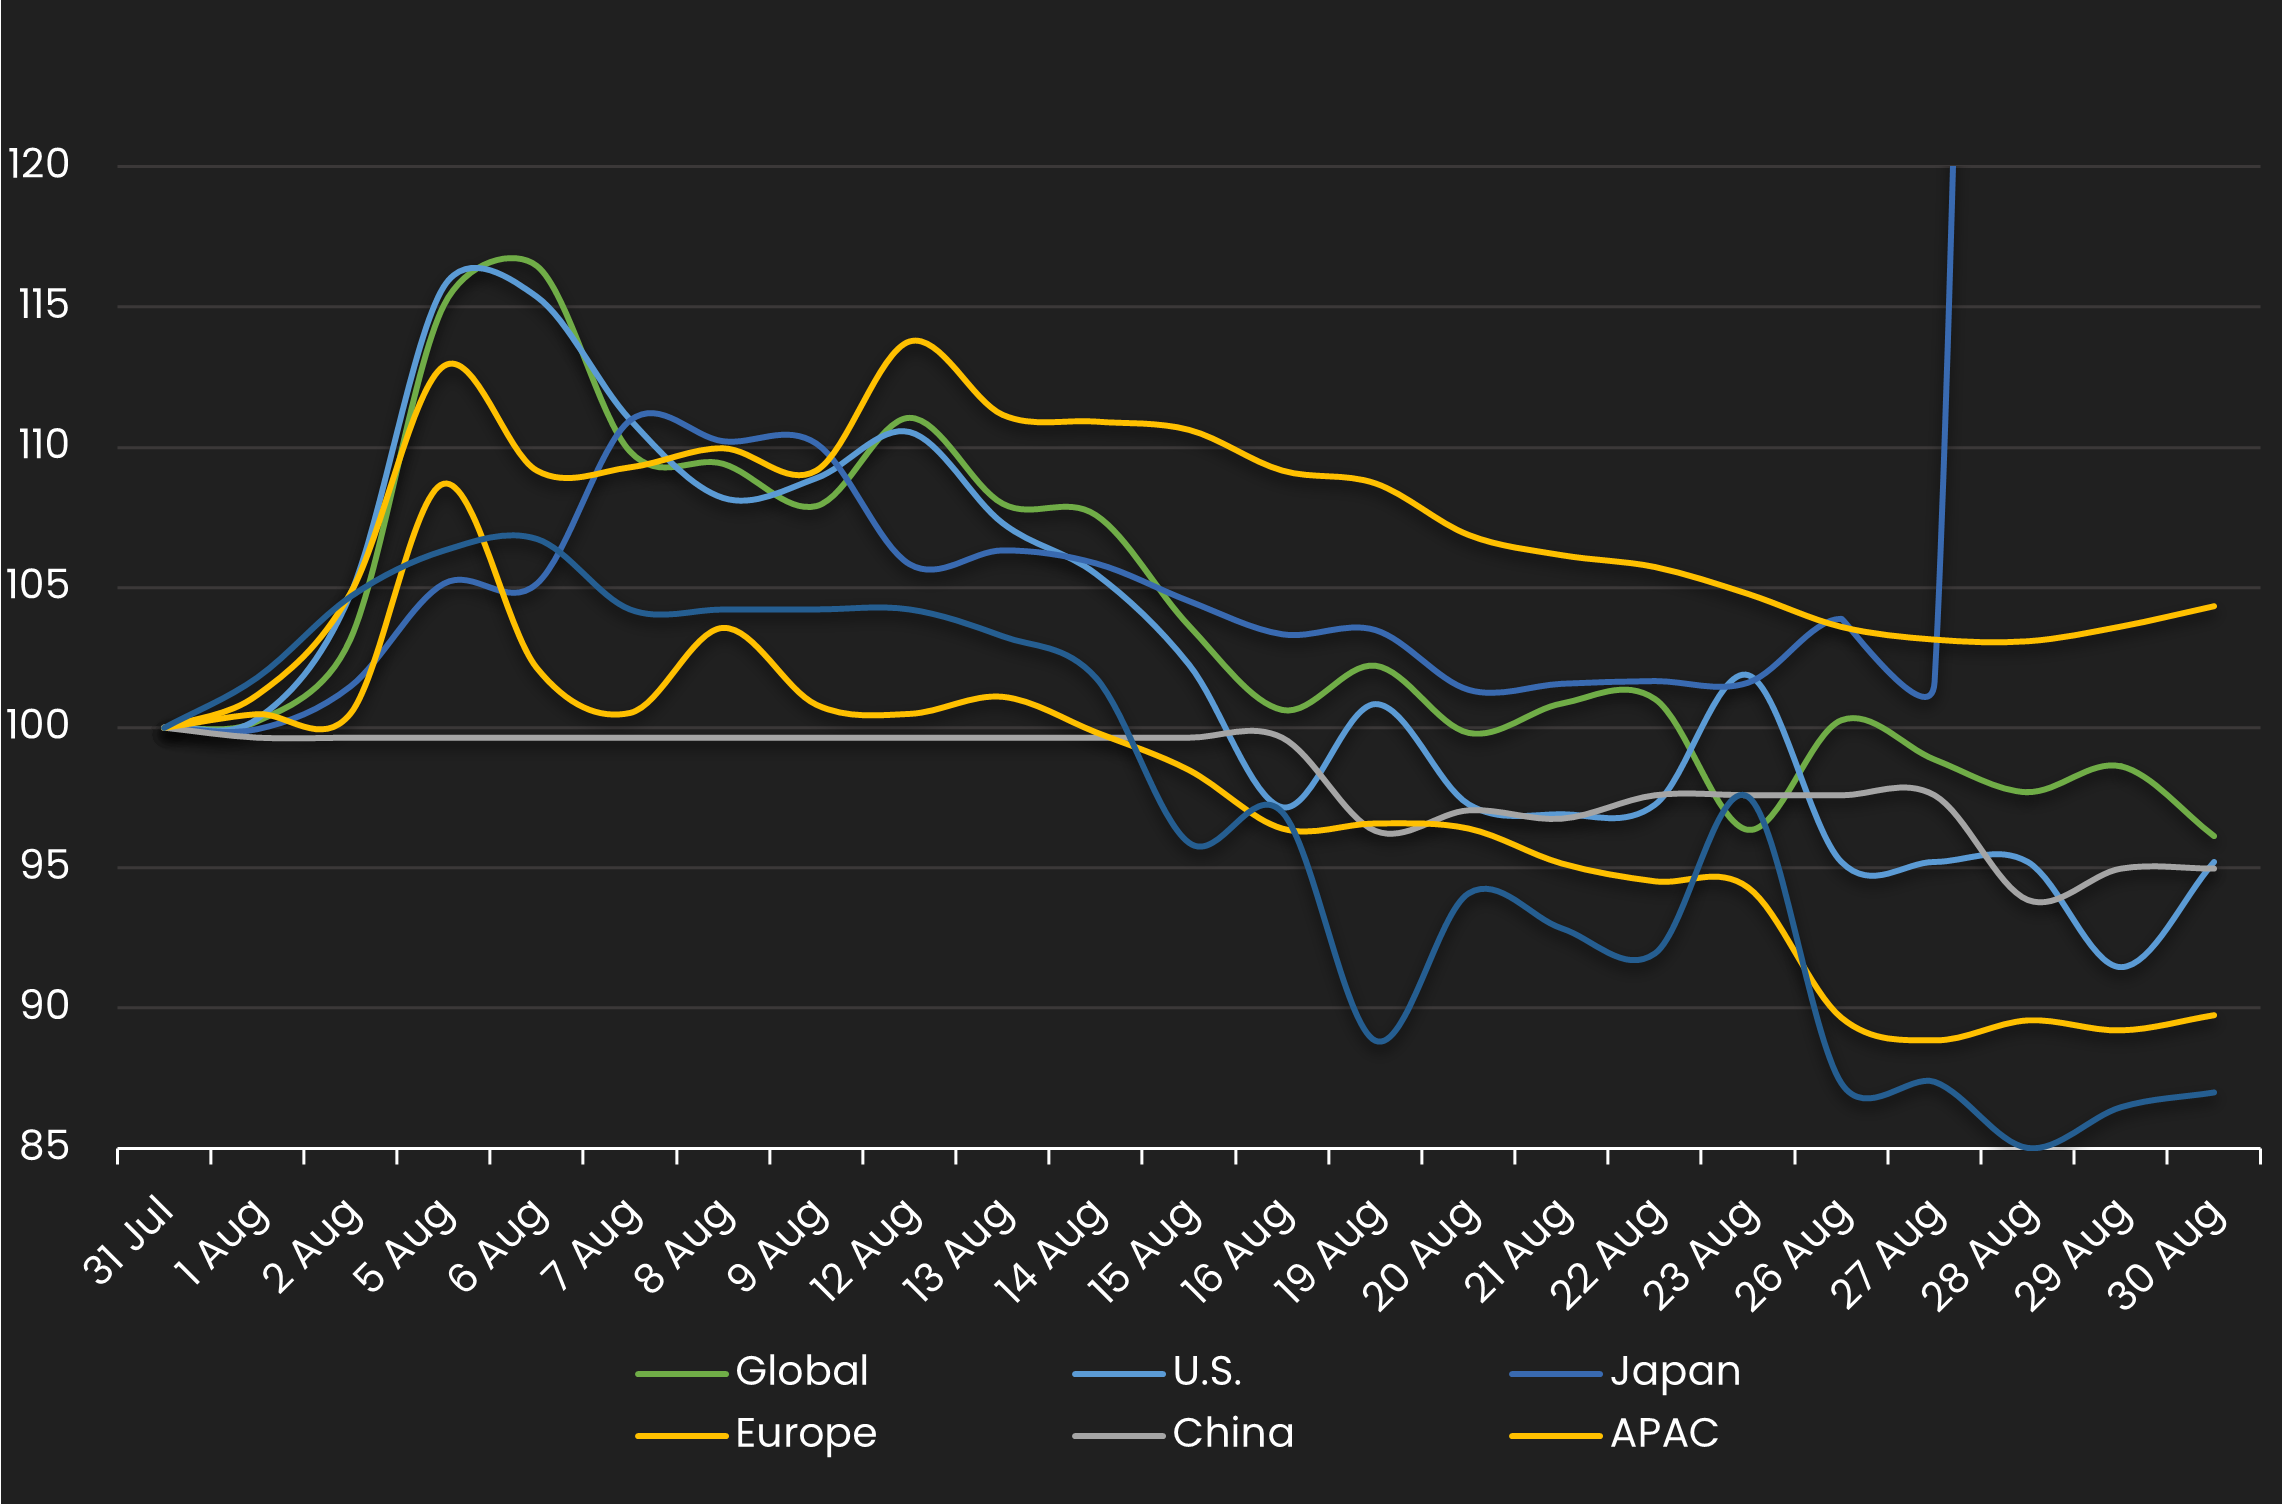
Normalized HY Spread by Region
Displays the HY CDS spread by region between 8/1/24 – 8/31/24 Results are based on 5 select regions, however, we offer data across 12 regions
HY Spread by Region – Monthly Comparison
Exhibits the HY mid spread by region for the month ending 7/31/24 vs. the month ending 8/31/24
| REGION | PREVIOUS SPREAD | CURRENT SPREAD | BPS CHANGE | MONTHLY PERFORMANCE | CDS COUNT |
|---|---|---|---|---|---|
| Global | 137 | 131 | -5 | Tighter | 192 |
| U.S. | 131 | 125 | -6 | Tighter | 103 |
| U.K. | 95 | 90 | -6 | Tighter | 17 |
| Canada | 75 | 65 | -11 | Tighter | 4 |
| China | 78 | 74 | -4 | Tighter | 1 |
| APAC | 111 | 100 | -11 | Tighter | 1 |
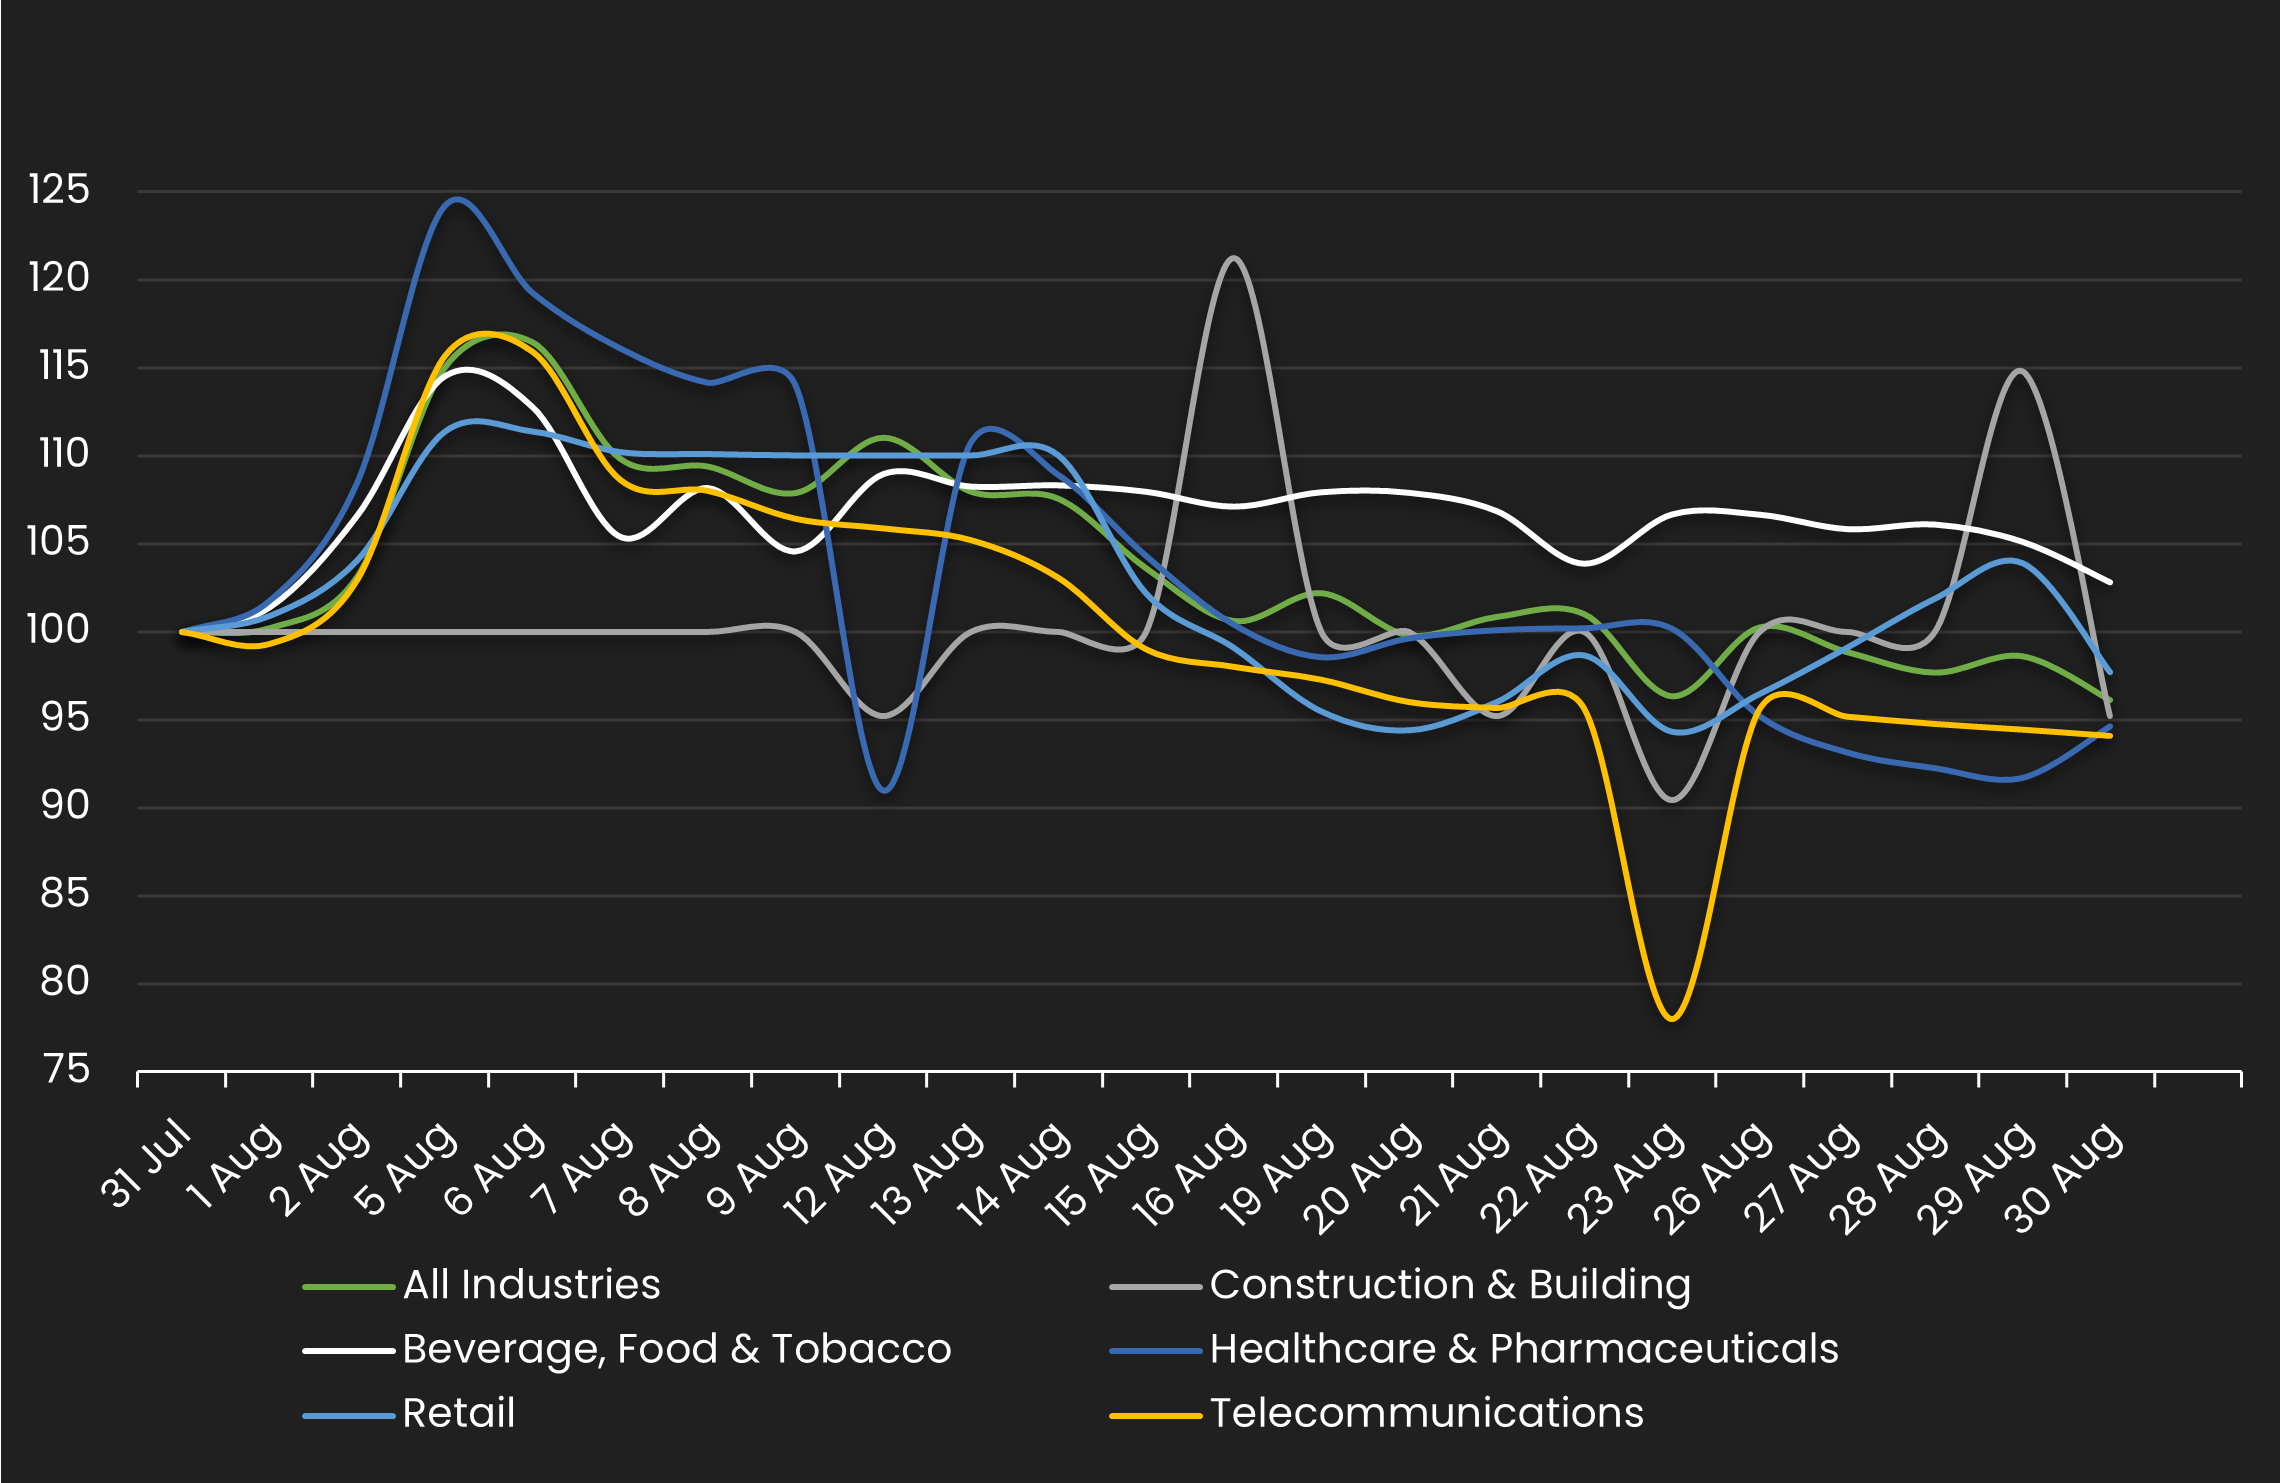
Normalized HY Spread by Industry
Displays the HY CDS spread by industry between 8/1/24 – 8/31/24 Results are based on 5 select industry sectors, however, we offer data across 36 sectors
HY Spread by Industries – Monthly Comparison
Exhibits the HY spread by industry for the month ending 7/31/24 vs. the month ending 8/31/24
| INDUSTRIES | PREVIOUS SPREAD | CURRENT SPREAD | BPS CHANGE | MONTHLY PERFORMANCE | CDS COUNT |
|---|---|---|---|---|---|
| All Industries | 137 | 131 | -5 | Tighter | 192.00 |
| Construction & Building | 199 | 190 | -10 | Tighter | 6.00 |
| Beverage, Food & Tobacco | 168 | 173 | 5 | Wider | 5.00 |
| Healthcare & Pharmaceuticals | 94 | 89 | -5 | Tighter | 8.00 |
| Retail | 182 | 178 | -4 | Tighter | 16.00 |
| Telecommunications | 197 | 185 | -12 | Tighter | 10.00 |
Stay up-to-date with monthly summaries.
Related Resources
About SOLVE
SOLVE is the leading market data platform provider for fixed-income securities, trusted by sophisticated buy-side and sell-side firms worldwide. Founded in 2011, SOLVE leverages its AI-driven technology and deep industry expertise to offer unparalleled transparency into markets, reduce risk, and save hundreds of hours across front-office workflows. With the largest real-time datasets for Securitized Products, Municipal Bonds, Corporate Bonds, Syndicated Bank Loans, Convertible Bonds, CDS, and Private Credit, SOLVE empowers clients to transform the way they bring new securities to market, trade on secondary markets, and value highly illiquid securities. Headquartered in Connecticut, with offices across the globe, SOLVE is the definitive source for market pricing in fixed-income markets.
