BDC Filing Season: Q4 2024 Week 8
BDC Filing Season Q4 2024 Week 8
BDC data provided by the Advantage Data Workstation, a SOLVE product. For more information about our BDC data or our other products please contact marketpulse@solvefixedincome.com.
Filing Recap
This report will analyze the 19 BDCs that filed this week. Aggregate Fair Value reported by these BDCs is 11.1 Billion USD which is approximately 2.9% of aggregate AUM of all BDCs.
| Name | Number of Investments | % Portfolio | Cost | % Gain/Loss | Principal Value | Fair Value | FV Yield | Filtered Yield | Cost Yield |
|---|---|---|---|---|---|---|---|---|---|
| MSC Income Fund Inc. | 436 | 100.00% | 1,138,745 | 3.404% | 979,307 | 1,177,507 | — | — | — |
| TCW Direct Lending VII LLC | 60 | 100.00% | 1,294,756 | -10.727% | 1,233,966 | 1,155,867 | — | — | — |
| Runway Growth Finance Corp. | 110 | 100.00% | 1,103,883 | -2.450% | 988,311 | 1,076,840 | — | — | — |
| TCW Direct Lending VIII LLC | 53 | 100.00% | 1,040,123 | -0.979% | 968,375 | 1,029,943 | — | — | — |
| Overland Advantage | 69 | 100.00% | 973,400 | 0.030% | 981,944 | 973,692 | — | — | — |
| Franklin BSP Real Estate Credit BDC | 40 | 100.00% | 834,884 | 0.955% | 842,850 | 842,856 | — | — | — |
| Varagon Capital Corp. | 319 | 100.00% | 823,217 | -2.320% | 641,945 | 804,115 | — | — | — |
| Kennedy Lewis Capital Co | 111 | 100.00% | 779,206 | 0.695% | 785,760 | 784,623 | — | — | — |
| Jefferies Credit Partners BDC Inc. | 135 | 100.00% | 773,069 | 0.686% | 775,384 | 778,371 | — | — | — |
| Brightwood Capital Corp I | 111 | 100.00% | 775,901 | 0.283% | 773,397 | 778,095 | — | — | — |
| Audax Credit BDC Inc. | 355 | 100.00% | 416,974 | -1.665% | 416,224 | 410,031 | — | — | — |
| AMG Comvest Senior Lending Fund | 123 | 100.00% | 407,214 | 0.374% | 407,685 | 408,739 | — | — | — |
| Senior Credit Investments LLC | 135 | 100.00% | 316,371 | 0.714% | 317,195 | 318,629 | — | — | — |
| Investcorp Credit Management BDC Inc. | 64 | 100.00% | 200,506 | -4.433% | 169,174 | 191,617 | — | — | — |
| TCW Star Direct Lending LLC | 40 | 100.00% | 159,410 | -0.294% | 162,257 | 158,941 | — | — | — |
| Steele Creek Capital Corp | 190 | 100.00% | 125,533 | -3.155% | 125,746 | 121,572 | — | — | — |
| BIP Ventures Evergreen BDC | 11 | 100.00% | 80,165 | 14.318% | 55,283 | 91,642 | — | — | — |
| Muzinich Corporate Lending Income Fund Inc. | 67 | 100.00% | 82,823 | 0.475% | 81,148 | 83,217 | — | — | — |
| Firsthand Technology Value Fund Inc. | 65 | 100.00% | 116,682 | -99.091% | 92,460 | 1,060 | — | — | — |
| Grand Total | 2,494 | 100% | 11,442,863 | -2.233% | 10,798,412 | 11,187,358 | — | — | — |
Non-Accruals
At least 4 BDCs that filed this week have reported Non–Accruals amounting to 85.7 Million USD at Cost. MSC Income Fund Inc. and Investcorp Credit Management BDC Inc. are leading the Non-Accruals list.
| Name | Number of Investments | % Portfolio | Cost | % Gain/Loss | Principal Value | Fair Value | FV Yield | Filtered Yield | Cost Yield |
|---|---|---|---|---|---|---|---|---|---|
| MSC Income Fund Inc. | 22 | 1.52% | 64,165 | -72.190% | 74,328 | 17,844 | — | — | — |
| Investcorp Credit Management BDC Inc. | 5 | 3.64% | 10,903 | -36.103% | 19,277 | 6,967 | — | — | — |
| Runway Growth Finance Corp. | 2 | 0.52% | 8,726 | -36.065% | 8,054 | 5,579 | — | — | — |
| AMG Comvest Senior Lending Fund | 1 | 0.36% | 1,918 | -22.680% | 1,918 | 1,483 | — | — | — |
| Grand Total | 30 | 1.12% | 85,712 | -62.81% | 103,577 | 31,873 | — | — | — |
PIK
BDCs are increasingly using payment-in-kind (PIK) as a credit management tool to preserve liquidity. In the filings from this week, PIK accounted for 14.7% of BDCs’ portfolios, amounting to 1.6 billion USD at Cost.
| Name | Number of Investments | % Portfolio | Cost | % Gain/Loss | Principal Value | Fair Value | FV Yield | Filtered Yield | Cost Yield |
|---|---|---|---|---|---|---|---|---|---|
| TCW Direct Lending VII LLC | 28 | 43.39% | 626,692 | -19.980% | 658,948 | 501,479 | — | — | — |
| Runway Growth Finance Corp. | 12 | 32.29% | 358,274 | -2.952% | 358,720 | 347,699 | — | — | — |
| TCW Direct Lending VIII LLC | 10 | 15.62% | 175,918 | -8.566% | 178,442 | 160,850 | — | — | — |
| MSC Income Fund Inc. | 63 | 10.00% | 160,973 | -26.875% | 161,836 | 117,712 | — | — | — |
| Kennedy Lewis Capital Co | 5 | 9.73% | 74,262 | 2.784% | 76,518 | 76,330 | — | — | — |
| Jefferies Credit Partners BDC Inc. | 6 | 8.00% | 62,536 | -0.371% | 63,224 | 62,304 | — | — | — |
| Investcorp Credit Management BDC Inc. | 14 | 24.27% | 47,398 | -1.882% | 39,356 | 46,506 | — | — | — |
| Brightwood Capital Corp I | 4 | 5.95% | 51,089 | -9.323% | 51,504 | 46,326 | — | — | — |
| Varagon Capital Corp. | 25 | 5.52% | 49,874 | -11.040% | 50,310 | 44,368 | — | — | — |
| Senior Credit Investments LLC | 6 | 8.08% | 25,833 | -0.395% | 26,122 | 25,731 | — | — | — |
| TCW Star Direct Lending LLC | 4 | 12.43% | 21,282 | -7.169% | 21,688 | 19,757 | — | — | — |
| Audax Credit BDC Inc. | 12 | 3.59% | 19,389 | -24.084% | 19,605 | 14,719 | — | — | — |
| Muzinich Corporate Lending Income Fund Inc. | 2 | 8.90% | 7,440 | -0.491% | 7,606 | 7,403 | — | — | — |
| AMG Comvest Senior Lending Fund | 6 | 1.50% | 6,132 | -0.326% | 1,246 | 6,112 | — | — | — |
| Grand Total | 197 | 16.13% | 1,687,092 | -12.44% | 1,715,125 | 1,477,296 | — | — | — |
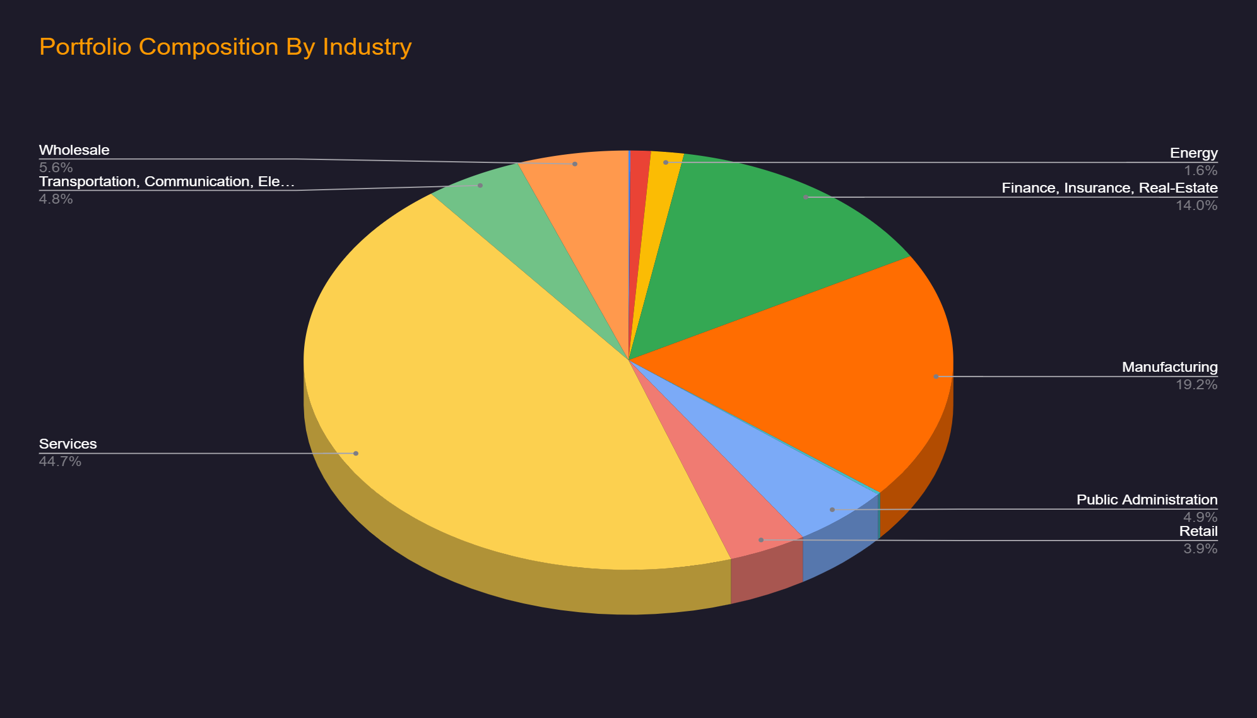
Portfolio Composition By Industry
The chart below is a bird’s-eye view of the BDCs aggregate Industry Diversification.
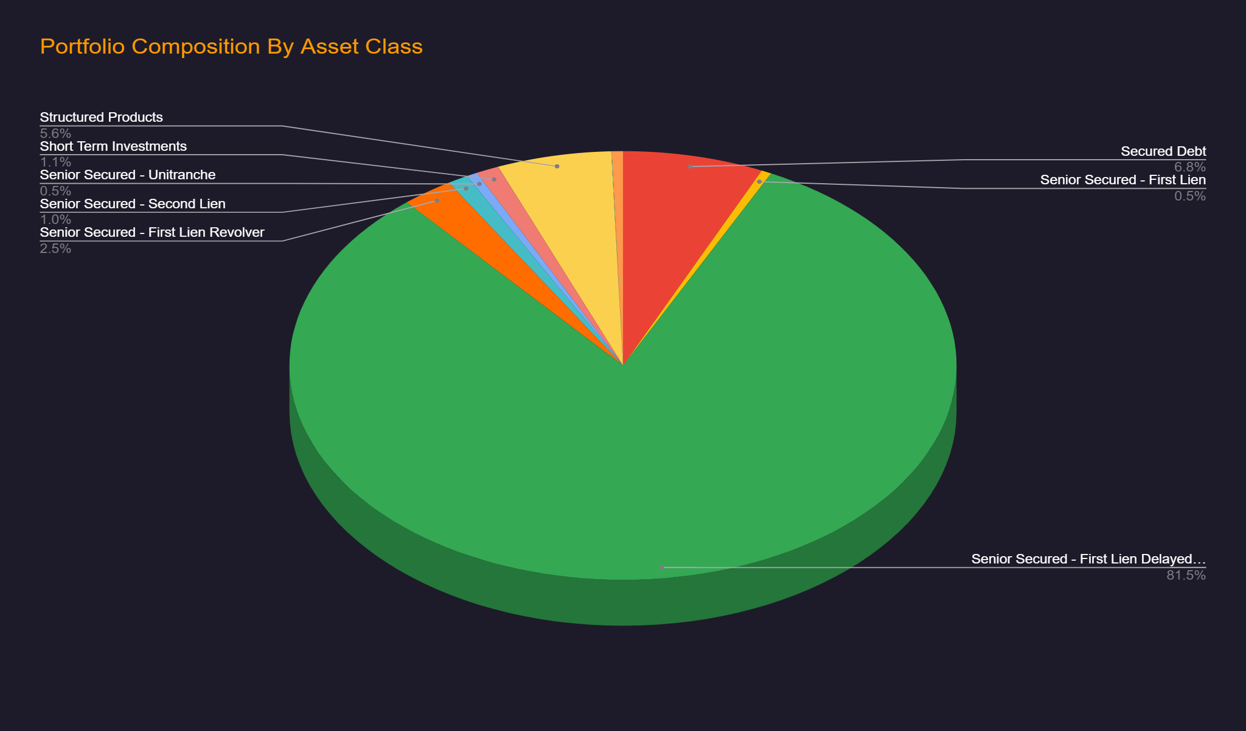
Portfolio Composition By Asset Class
The chart below is an overview of the BDCs aggregate Diversification by Asset Class.
BDC Investments Maturing in the next 12 Months
The table below summarizes aggregate investments of this week’s BDCs that are maturing in the next 12 months, which combined are worth more than 1.1 Billion USD at cost.
| BDC | Cost (1000) | FV (1000) |
|---|---|---|
| TCW Direct Lending VII LLC | 416,488 | 353,057 |
| Overland Advantage | 137,003 | 136,973 |
| TCW Direct Lending LLC | 162,347 | 117,754 |
| MSC Income Fund Inc. | 111,808 | 108,812 |
| Franklin BSP Real Estate Credit BDC | 80,848 | 81,577 |
| Varagon Capital Corp. | 71,775 | 70,370 |
| Runway Growth Finance Corp. | 43,949 | 38,440 |
| TCW Direct Lending VIII LLC | 36,797 | 36,504 |
| Investcorp Credit Management BDC Inc. | 9,679 | 10,180 |
| Brightwood Capital Corp I | 9,899 | 8,971 |
| Audax Credit BDC Inc. | 8,898 | 8,729 |
| Muzinich Corporate Lending Income Fund Inc. | 4,227 | 4,238 |
| Steele Creek Capital Corp | 1,682 | 1,601 |
| BIP Ventures Evergreen BDC | 1,000 | 1,000 |
| AMG Comvest Senior Lending Fund | 882 | 856 |
| Firsthand Technology Value Fund Inc. | 51,940 | 21 |
| Grand Total | 1,149,222 | 979,083 |
Sourav Srimal Senior Vice President ssrimal@solvefixedincome.com
Andrew Robartes Data Analyst arobartes@solvefixedincome.com
Ivan Chestaro Data Analyst ichestaro@solvefixedincome.com
SOLVE’s BDC Data & Analytics empowers businesses like yours with detailed and standardized BDC portfolio and position data within minutes of filing with the SEC. Why Choose SOLVE’s BDC Data & Analytics solution?
Stay up-to-date with weekly summaries.
Related Resources
About SOLVE
SOLVE is the leading market data platform provider for fixed-income securities, trusted by sophisticated buy-side and sell-side firms worldwide. Founded in 2011, SOLVE leverages its AI-driven technology and deep industry expertise to offer unparalleled transparency into markets, reduce risk, and save hundreds of hours across front-office workflows. With the largest real-time datasets for Securitized Products, Municipal Bonds, Corporate Bonds, Syndicated Bank Loans, Convertible Bonds, CDS, and Private Credit, SOLVE empowers clients to transform the way they bring new securities to market, trade on secondary markets, and value highly illiquid securities. Headquartered in Connecticut, with offices across the globe, SOLVE is the definitive source for market pricing in fixed-income markets.
