Syndicated Bank Loan Market Summary – August 2023
GET OUR BANK LOAN MARKET SUMMARIES STRAIGHT TO YOUR INBOX. LEARN MORE
Syndicated Bank Loan Market Summary: August 2023
Our newsletter presents key trends derived from observable Syndicated Bank Loan pricing data over a monthly period.
New Issues
Loans issued during the month ending 8/31/23
| ISSUER | AMOUNT (MM) | LOAN TYPE | MATURITY | RATE |
|---|---|---|---|---|
| Tecta America Corp. | 210 | Term Loan | 4/10/2028 | S+425 |
| Quikrete Holdings Inc. | 1679 | Term Loan | 3/18/2029 | S+275 |
| U.S. Foodservice | 722 | Term Loan | 11/22/2028 | S+250 |
| Playcore Inc. | 640 | Term Loan | 3/1/2027 | S+400 |
| Entegris Inc. | 2318 | Term Loan | 7/6/2029 | S+250 |
| DAE Aviation Hldg Inc. | 773 | Term Loan | 8/1/2028 | S+400 |
| DAE Aviation Hldg Inc. | 1803 | Term Loan | 8/1/2028 | S+400 |
| CHG Healthcare Services Inc. | 580 | Term Loan | 9/1/2028 | S+375 |
| Heartland Dental Care Inc. | 350 | Term Loan | 4/29/2028 | S+500 |
| Tenneco Inc. | 1243 | Term Loan | 11/1/2028 | S+510 |
| Epicor Software Corp. | 500 | Term Loan | N/A | S+375 |
| Asgn Incorporated | 500 | Term Loan | 8/2/2030 | S+225 |
| Access CIG LLC | 1125 | Term Loan | 7/31/2028 | S+500 |
| Open Text Corp. | 3567 | Term Loan | 1/31/2030 | S+275 |
| Northriver Midstream Finance LP | 850 | Term Loan | 8/2/2030 | S+300 |
| Installed Building Products Inc | 493 | Term Loan | 12/14/2028 | S+200 |
| Cushman & Wakefield Inc. | 1000 | Term Loan | 1/31/2030 | S+400 |
| Chemours Co. LLC | 415 | Term Loan | 7/31/2028 | L+400 |
| Chemours Co. LLC | 1070 | Term Loan | 7/31/2028 | S+350 |
| Barnes Group Inc. | 650 | Term Loan | 7/31/2030 | S+300 |
| Applovin Corp. | 1500 | Term Loan | 8/15/2030 | S+310 |
| AZZ Inc | 1030 | Term Loan | 5/13/2029 | S+375 |
| J & J Ventures Gaming LLC | 350 | Delayed-draw Term Loan | 4/26/2028 | S+425 |
| Four Seasons Hotels Inc. | 846 | Term Loan | 11/30/2029 | S+260 |
| H.B. Fuller Co. | 798 | Term Loan | 2/1/2030 | S+225 |
| Tronox Finance LLC | 350 | Term Loan | 8/7/2028 | S+350 |
| Greystar Real Estate Partners LLC | 450 | Term Loan | 8/1/2030 | S+375 |
| Generation Bridge LLC | 865 | Term Loan | 7/24/2029 | S+425 |
| Avient Corp | 732 | Term Loan | 8/29/2029 | S+250 |
| VT Topco Inc. | 940 | Term Loan | 7/25/2030 | S+425 |
| SonicWALL Inc. | 650 | Term Loan | 5/1/2028 | S+500 |
| Learning Care Group Inc. | 900 | Term Loan | 7/31/2028 | S+475 |
| Curium | 325 | Term Loan | 7/1/2029 | L+450 |
| Curium | 1070 | Term Loan | 7/1/2029 | S+450 |
| Crocs Inc. | 1180 | Term Loan | 2/19/2029 | S+300 |
| Axalta Coating Systems US Holdings Inc. | 1845 | Term Loan | 12/20/2029 | S+250 |
| EG America LLC | 963 | Term Loan | 2/7/2028 | L+550 |
| Software AG | 640 | Term Loan | 7/18/2030 | L+475 |
| Software AG | 405 | Term Loan | 7/18/2030 | S+475 |
| Advisor Group | 1448 | Term Loan | 8/1/2028 | S+450 |
Largest Loans
Highlights the monthly price movements and quote depth for the 20 largest bank loans between 8/1/23 – 8/31/23
| RANK | SIZE (MM) | NAME | CHANGE | PX | PX-1M | DEALERS |
|---|---|---|---|---|---|---|
| 1 | 8,572 | GEO GROUP TL1 | 0.05% | 101.56 | 101.52 | 11 |
| 2 | 7,270 | MEDLINE TL B | 1.01% | 99.90 | 98.90 | 11 |
| 3 | 5,000 | QWEST CORPORATION TL B | -5.50% | 65.77 | 69.60 | 12 |
| 4 | 5,000 | UNITED CONTINENTAL TL B | 0.13% | 100.16 | 100.03 | 13 |
| 5 | 4,750 | HUB INTL LTD TL B5 | -0.04% | 100.35 | 100.39 | 15 |
| 6 | 4,750 | ZAYO TL | 5.22% | 80.02 | 76.05 | 15 |
| 7 | 4,741 | INTERNET BRANDS TL B | -0.27% | 95.99 | 96.25 | 11 |
| 8 | 4,559 | TRANSDIGM INC. TL I | 0.02% | 100.05 | 100.03 | 21 |
| 9 | 4,463 | ULTIMATE SOFTWARE TL B | 0.52% | 99.89 | 99.38 | 11 |
| 10 | 3,900 | DIRECTV TL | -0.58% | 98.73 | 99.31 | 15 |
| 11 | 3,600 | CDK GLOBAL TL | 0.08% | 100.08 | 100.00 | 12 |
| 12 | 3,582 | MISYS TL B | 3.19% | 99.90 | 96.81 | 11 |
| 13 | 3,515 | LIFEPOINT HOSPITALS TL B | 0.87% | 99.01 | 98.16 | 11 |
| 14 | 3,500 | AMERICAN AIRLINES TL B | 0.36% | 103.82 | 103.44 | 12 |
| 15 | 3,500 | PILOT TRAVEL TL B | 0.08% | 99.90 | 99.82 | 11 |
| 16 | 3,450 | GOLDEN NUGGET INC TL B | 0.12% | 98.94 | 98.83 | 14 |
| 17 | 3,420 | RCN GRANDE TL | -2.73% | 81.71 | 84.01 | 13 |
| 18 | 3,380 | SOLERA TL B | 2.68% | 96.83 | 94.31 | 12 |
| 19 | 3,300 | NTL CABLE PLC TL N | -0.06% | 97.20 | 97.26 | 11 |
| 20 | 3,190 | INTELSAT EXIT TL B | 0.19% | 99.92 | 99.73 | 12 |
| AVERAGE | 4,372 | 0.27% | 95.99 | 95.69 | 12.7 |
Top 10 Outperformers
Showcases the top 10 loan “outperformers” based on the largest bid price increases between 8/1/23 – 8/31/23
| RANK | NAME | CHANGE | PX | PX-1M | DEALERS |
|---|---|---|---|---|---|
| 1 | TELESAT TL B5 | 17.08% | 71.52 | 61.08 | 7 |
| 2 | TEAM HEALTH EXT TL B | 16.69% | 79.75 | 68.35 | 8 |
| 3 | AIR MEDICAL TL B | 14.58% | 70.14 | 61.21 | 10 |
| 4 | GREENWAY MEDICAL TL | 10.12% | 84.50 | 76.74 | 6 |
| 5 | MISYS 2ND LIEN TL | 9.84% | 99.88 | 90.94 | 13 |
| 6 | NATIONAL MENTOR TL B | 9.23% | 86.74 | 79.41 | 7 |
| 7 | SECURUS TL | 9.20% | 87.21 | 79.87 | 7 |
| 8 | AT&T COLOCATION TL | 9.12% | 81.82 | 74.98 | 9 |
| 9 | EQUINOX HLDGS INC 2ND LIEN TL | 7.91% | 86.20 | 79.88 | 8 |
| 10 | S&S HOLDINGS TL | 7.68% | 94.74 | 87.98 | 7 |
Top 10 Underperformers
Showcases the top 10 loan “underperformers” based on the largest bid price decreases between 8/1/23 – 8/31/23
| RANK | NAME | CHANGE | PX | PX-1M | DEALERS |
|---|---|---|---|---|---|
| 1 | CANO HEALTH TL B | -25.62% | 62.72 | 84.33 | 10 |
| 2 | AIR METHODS TL | -18.43% | 27.90 | 34.21 | 7 |
| 3 | CBS RADIO INC TL B | -17.85% | 44.00 | 53.56 | 8 |
| 4 | SCIONHEALTH TL B | -15.23% | 32.65 | 38.51 | 3 |
| 5 | LERETA TL B | -12.57% | 80.00 | 91.50 | 3 |
| 6 | MOLD-RITE 2ND LIEN TL | -11.77% | 51.11 | 57.92 | 5 |
| 7 | OLAPLEX TL B | -11.50% | 82.93 | 93.71 | 8 |
| 8 | LEARFIELD TL B | -11.25% | 69.00 | 77.74 | 9 |
| 9 | SLV GROUP GMBH EUR TL B | -7.74% | 82.38 | 89.30 | 11 |
| 10 | SINCLAIR BROADCAST GROUP INC. TL B3 | -5.06% | 75.07 | 79.07 | 6 |
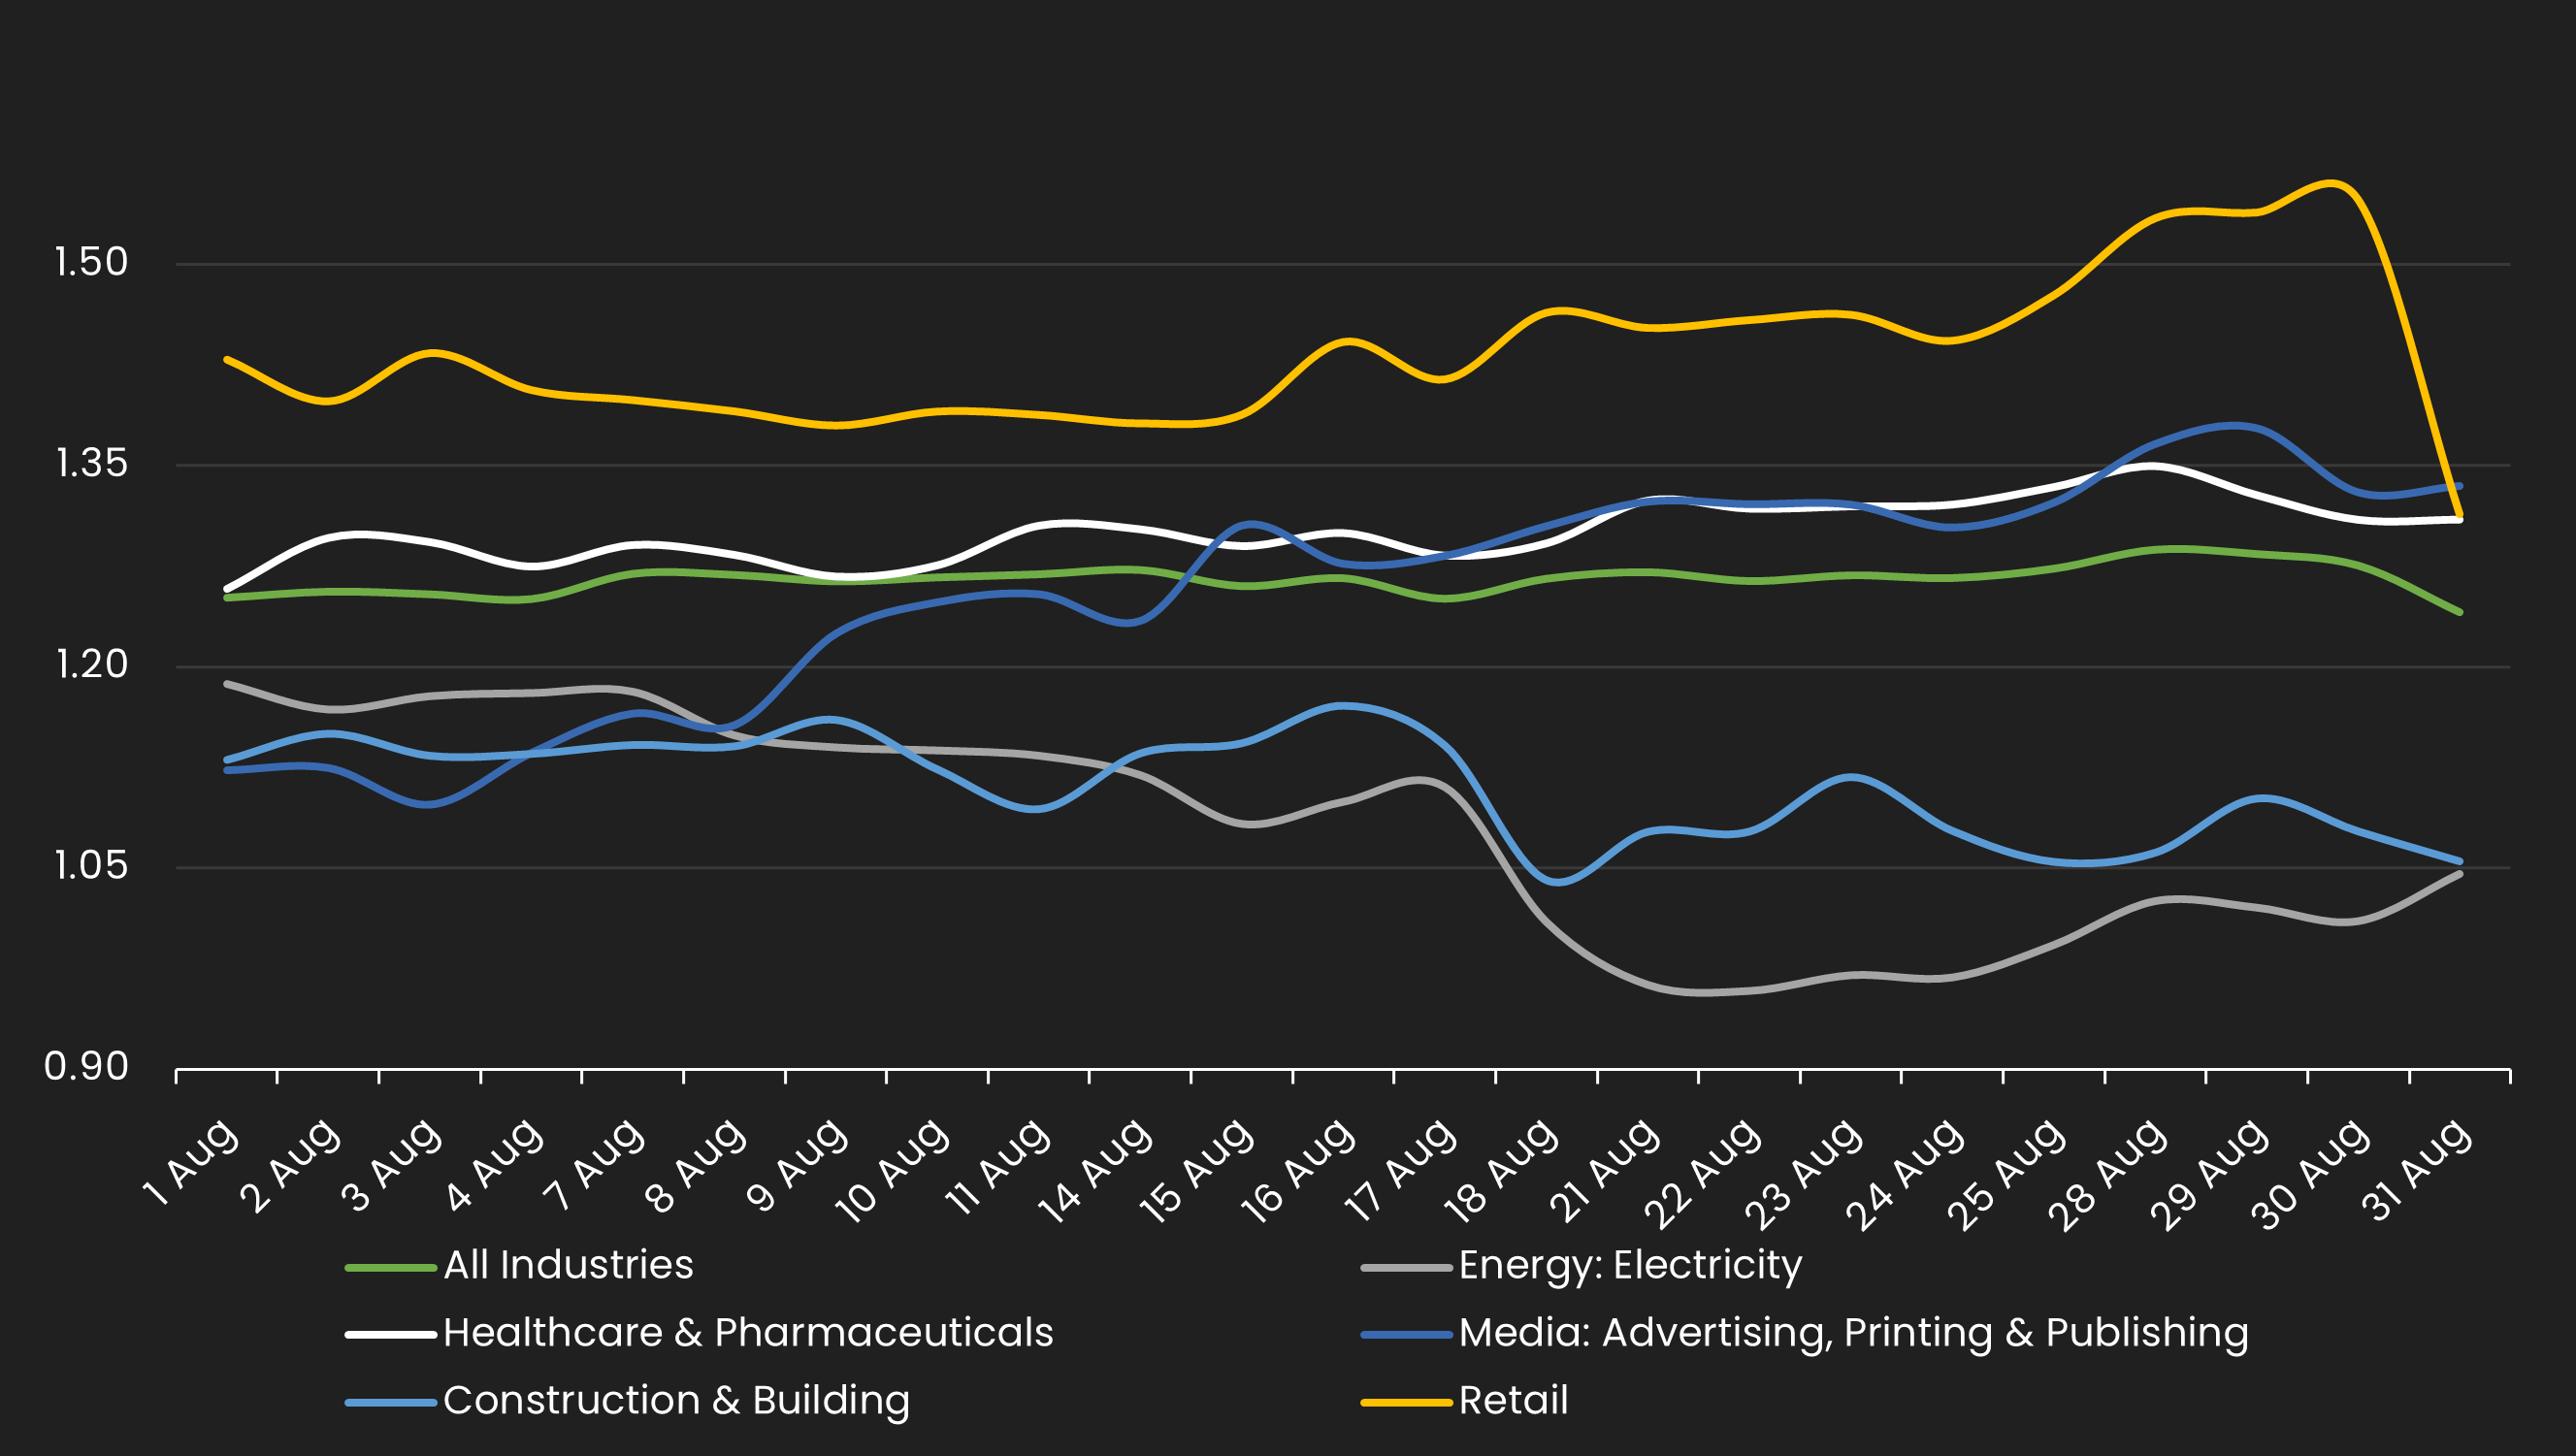
Avg Bid PX by Sector
Displays the average loan bid price by sector between 8/1/23 – 8/31/23 Results are based on 5 select industry sectors, however, we offer data across 36 sectors

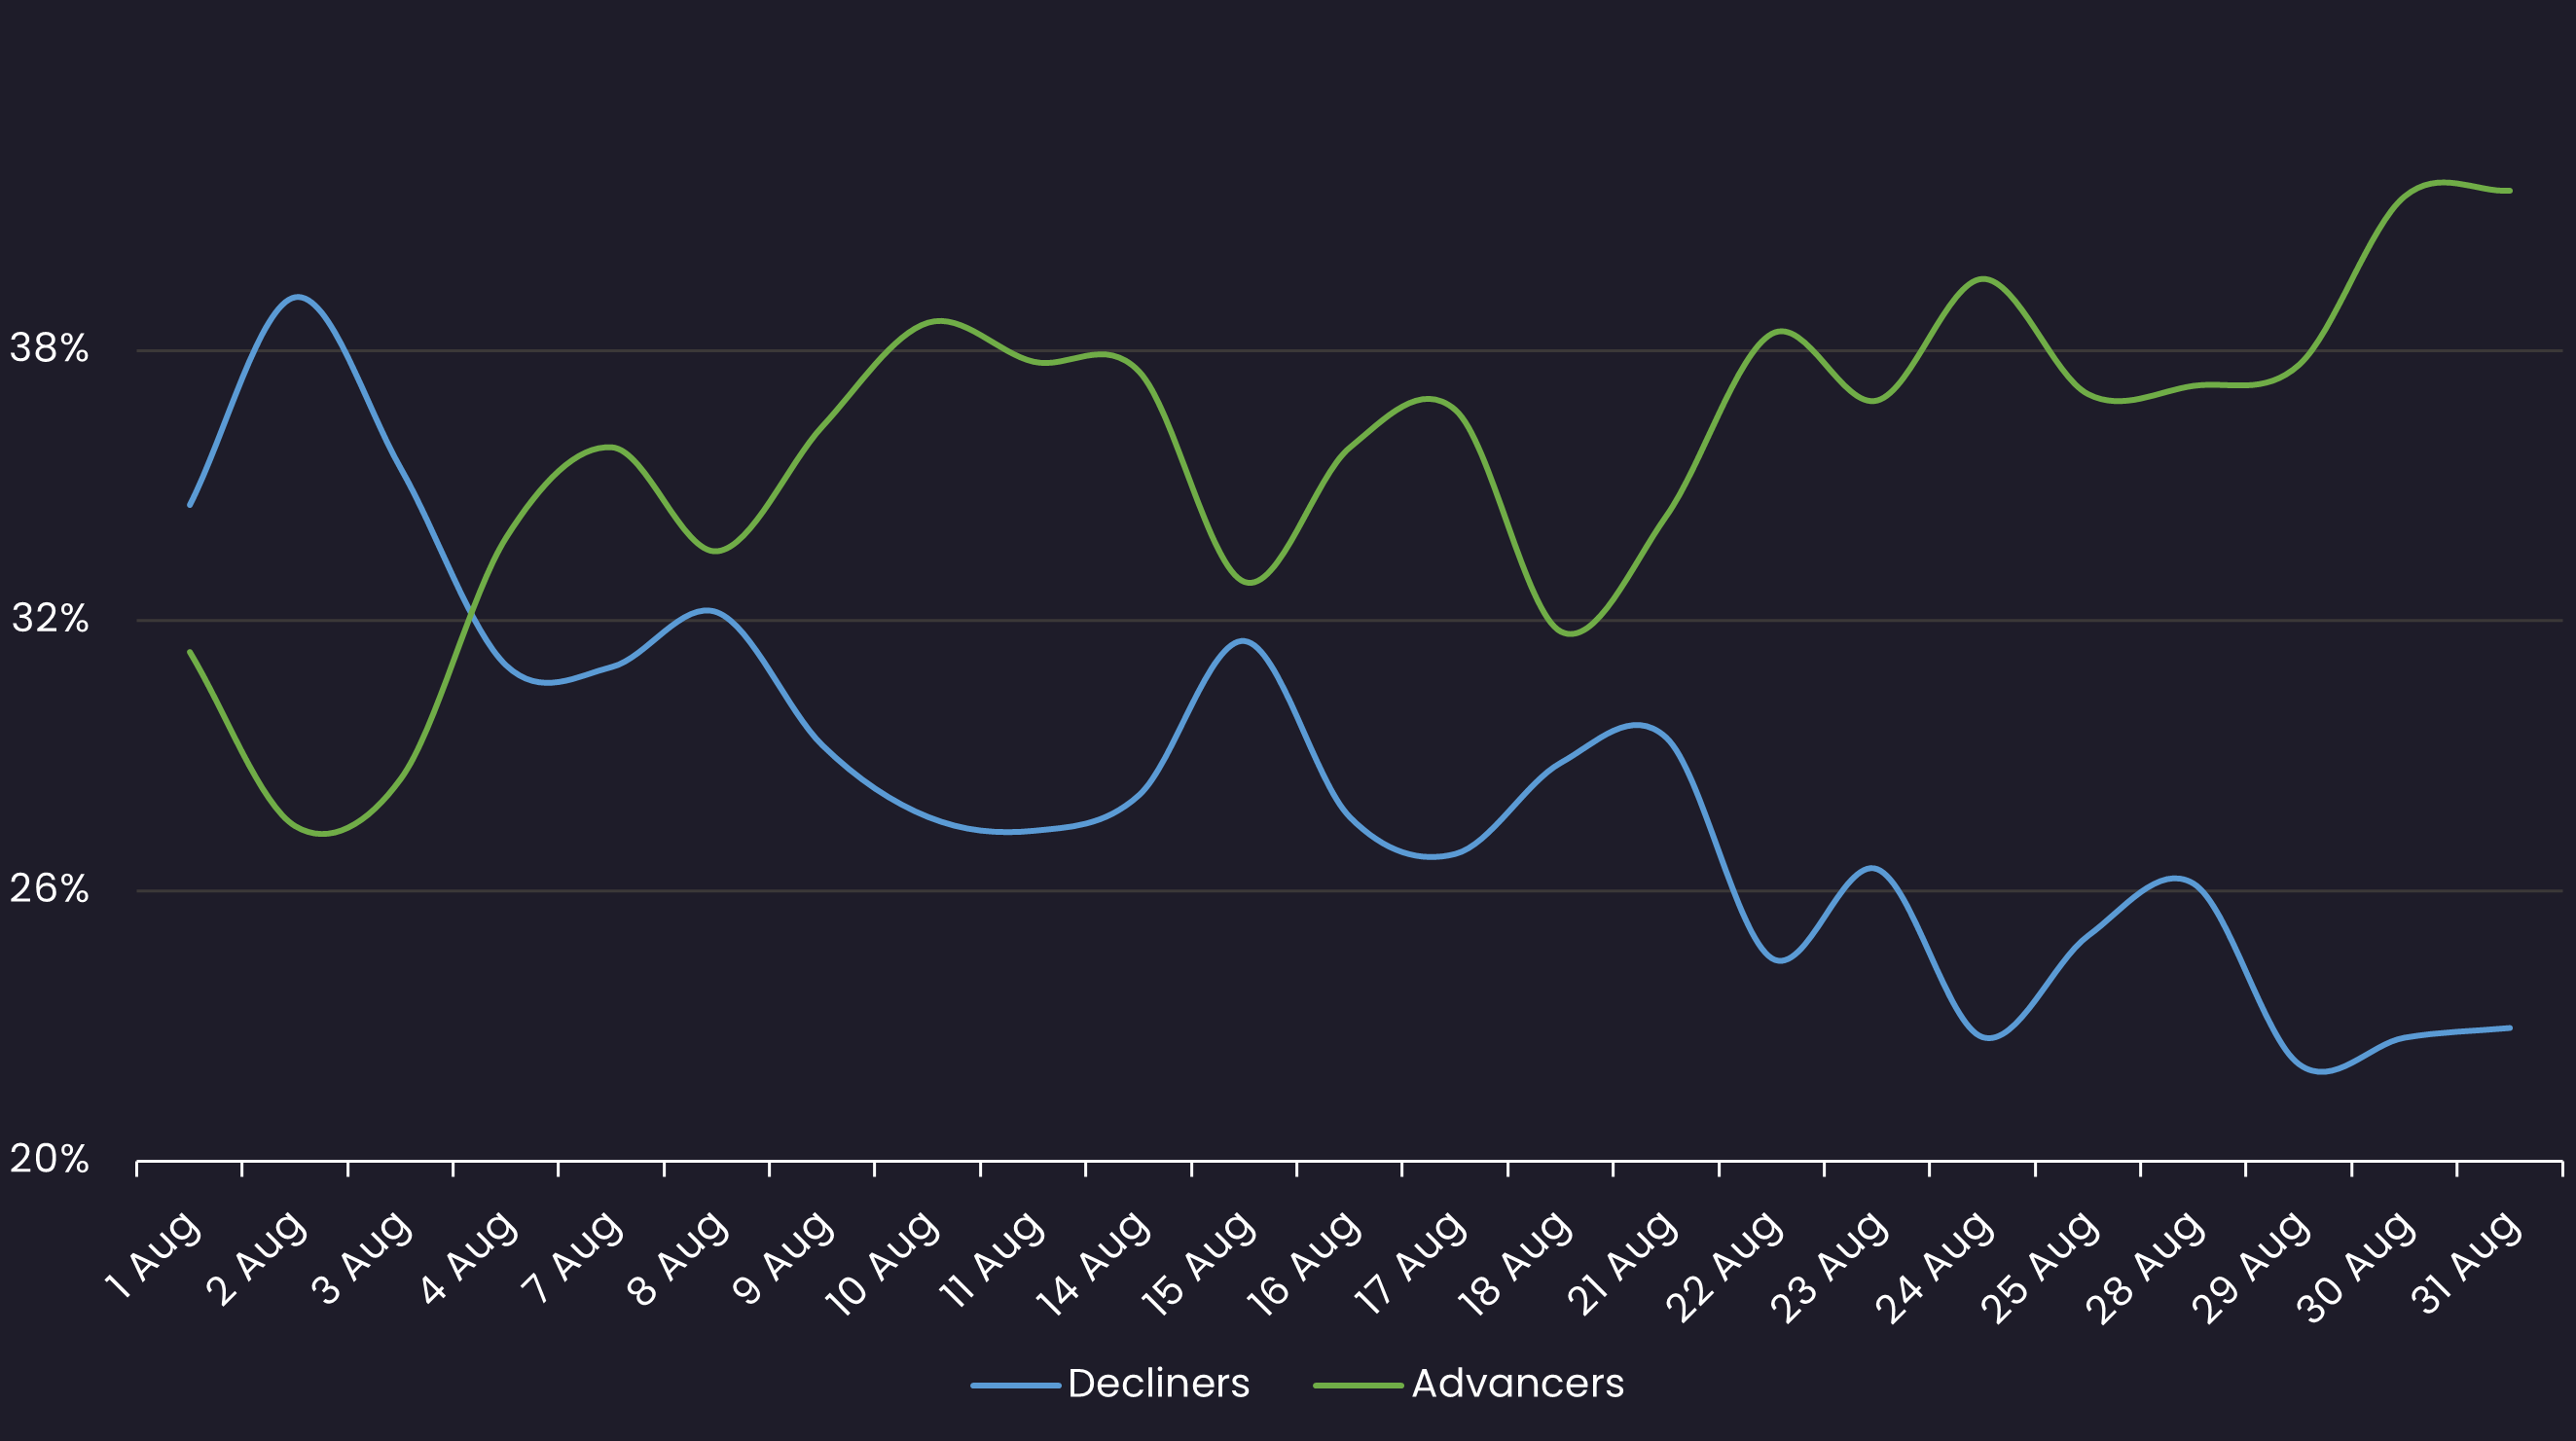
Sentiment
Reveals the percent of loans increasing in price (advancers) vs. loans decreasing in price (decliners) between 8/1/23 – 8/31/23
Top Quote Volume Movers: This Month vs Last Month
Exhibits the loans with the largest increase in quote volume for the month ending 7/31/23 vs. the month ending 8/31/23
| RANK | TRANCHE | PRIOR MONTH | THIS MONTH | INCREASE | % INCREASE |
|---|---|---|---|---|---|
| 1 | CINEWORLD EXIT TL | 48 | 272 | 224 | 467% |
| 2 | THERMA HOLDINGS TL B | 10 | 200 | 190 | 1900% |
| 3 | HELIX GENERATION TL B | 190 | 374 | 184 | 97% |
| 4 | WORLD KITCHEN TL | 28 | 170 | 142 | 507% |
| 5 | CYANCO TL B | 128 | 254 | 126 | 98% |
| 6 | ACCOLADE WINES GBP TL B | 97 | 221 | 124 | 128% |
| 7 | API TECHNOLOGIES TL | 21 | 141 | 120 | 571% |
| 8 | TALLGRASS TL B | 354 | 472 | 118 | 33% |
| 9 | COADVANTAGE TL B | 4 | 120 | 116 | 2900% |
| 10 | XPO LOGISTICS TL B | 205 | 311 | 106 | 52% |
Most Quoted Loans
Ranks the loans that were quoted by the highest number of dealers between 8/1/23 – 8/31/23
| RANK | TRANCHE | DEALERS |
|---|---|---|
| 1 | TRANSDIGM INC. TL I | 21 |
| 2 | ZIGGO EUR TL H | 18 |
| 3 | TELENET EUR TL | 17 |
| 4 | UPC HOLDING BV EUR TL | 17 |
| 5 | BELLIS ACQUISITION CO PLC EUR TL B | 17 |
| 6 | T-MOBILE NETHERLANDS EUR TL B | 16 |
| 7 | NTL CABLE PLC GBP TL M | 16 |
| 8 | KETER GROUP EUR TL B1 | 16 |
| 9 | CEVA SANTE ANIMALE EUR TL B | 16 |
| 10 | SECTOR ALARM HOLDING EUR TL B1 | 16 |
Bid and Offer Volume
Reveals the total number of quotes by bid and offer between 8/1/23 – 8/31/23

Sector Bid-Offer Spread
Displays the bid-offer spread by sector between 8/1/23 – 8/31/23 Results are based on 5 select industry sectors, however, we offer data across 36 sectors
Stay up-to-date with weekly summaries.
Related Resources
About SOLVE
SOLVE is the leading market data platform provider for fixed-income securities, trusted by sophisticated buy-side and sell-side firms worldwide. Founded in 2011, SOLVE leverages its AI-driven technology and deep industry expertise to offer unparalleled transparency into markets, reduce risk, and save hundreds of hours across front-office workflows. With the largest real-time datasets for Securitized Products, Municipal Bonds, Corporate Bonds, Syndicated Bank Loans, Convertible Bonds, CDS, and Private Credit, SOLVE empowers clients to transform the way they bring new securities to market, trade on secondary markets, and value highly illiquid securities. Headquartered in Connecticut, with offices across the globe, SOLVE is the definitive source for market pricing in fixed-income markets.
