Syndicated Bank Loan Market Summary – Week Ending 2/18/22
GET OUR BANK LOAN MARKET SUMMARIES STRAIGHT TO YOUR INBOX. LEARN MORE
Syndicated Bank Loan Market Summary: Week Ending 2/18/22
Our newsletter presents key trends derived from observable Syndicated Bank Loan pricing data over a weekly period.
Largest Loans
Highlights the weekly price movements and quote depth for the 20 largest bank loans between 2/11/22 – 2/18/22
| RANK | SIZE (MM) | NAME | CHANGE | PX | PX-1W | DEALERS |
|---|---|---|---|---|---|---|
| 1 | 7,270 | MEDLINE TL B | -0.57% | 98.88 | 99.45 | 13 |
| 2 | 5,450 | ENVISION HEALTHCARE TL B | -4.45% | 74.98 | 78.47 | 18 |
| 3 | 5,100 | CHANGE HEALTHCARE TL B | -0.42% | 99.39 | 99.81 | 12 |
| 4 | 4,750 | ZAYO TL | -0.97% | 97.44 | 98.38 | 18 |
| 5 | 4,700 | CAESARS RESORT COLLECTION TL B | -0.52% | 98.90 | 99.42 | 14 |
| 6 | 4,197 | AKZONOBEL TL B | -0.39% | 98.75 | 99.14 | 10 |
| 7 | 3,972 | POWER SOLUTIONS TL B | -0.37% | 98.77 | 99.13 | 11 |
| 8 | 3,900 | DIRECTV TL | -0.28% | 99.80 | 100.08 | 12 |
| 9 | 3,582 | MISYS TL B | -0.76% | 98.68 | 99.44 | 14 |
| 10 | 3,524 | TRANSDIGM INC. TL F | -0.39% | 98.40 | 98.79 | 16 |
| 11 | 3,515 | LIFEPOINT HOSPITALS TL B | -0.43% | 99.07 | 99.50 | 14 |
| 12 | 3,500 | AMERICAN AIRLINES TL B | -0.99% | 102.46 | 103.48 | 10 |
| 13 | 3,380 | SOLERA TL B | -0.26% | 99.53 | 99.79 | 16 |
| 14 | 3,325 | CINEWORLD TL B | 1.08% | 77.04 | 76.21 | 13 |
| 15 | 3,312 | HUB INTL LTD TL B | -0.27% | 98.85 | 99.12 | 18 |
| 16 | 3,300 | NTL CABLE PLC TL N | -0.62% | 98.33 | 98.94 | 12 |
| 17 | 3,300 | DIAMOND SPORTS TL B | -7.90% | 36.79 | 39.94 | 12 |
| 18 | 3,275 | SCIENTIFIC GAMES TL B5 | -0.25% | 99.25 | 99.50 | 14 |
| 19 | 3,100 | JAZZ PHARMA TL B | -0.30% | 99.69 | 99.98 | 12 |
| 20 | 3,100 | ASURION TL B8 | -0.46% | 98.68 | 99.13 | 10 |
| AVERAGE | 3,978 | -0.97% | 93.68 | 94.39 | 13.5 |
Top 10 Winners
Showcases the top 10 loan “winners” based on the largest bid price increases between 2/11/22 – 2/18/22
| RANK | NAME | CHANGE | PX | PX-1M |
|---|---|---|---|---|
| 1 | PGS TL B | 4.16% | 82.82 | 79.51 |
| 2 | THE NORDAM GROUP TL B | 3.35% | 87.52 | 84.69 |
| 3 | WYNN LAS VEGAS LLC / WYNN LAS TL | 1.73% | 99.41 | 97.72 |
| 4 | CINEWORLD TL B | 1.08% | 77.04 | 76.21 |
| 5 | CIBT HOLDINGS TL | 0.86% | 83.06 | 82.36 |
| 6 | NATIONAL CINEMEDIA TL B | 0.79% | 89.09 | 88.38 |
| 7 | SERVICE KING TL B | 0.78% | 93.21 | 92.49 |
| 8 | REFRESCO HOLDING EUR TL B1 | 0.71% | 98.97 | 98.27 |
| 9 | BUCCANEER 2ND LIEN TL | 0.67% | 95.59 | 94.96 |
| 10 | STEINHOFF EUROPE TL A2 | 0.62% | 84.56 | 84.04 |
Top 10 Losers
Showcases the top 10 loan “losers” based on the largest bid price decreases between 2/11/22 – 2/18/22
| RANK | NAME | CHANGE | PX | PX-1M |
|---|---|---|---|---|
| 1 | CONSTELLIS HOLDINGS LLC PIK 2ND LIEN TL | -28.51% | 43.07 | 60.25 |
| 2 | HERITAGE POWER TL B | -10.43% | 64.65 | 72.18 |
| 3 | TELESAT TL B | -8.40% | 71.27 | 77.81 |
| 4 | DIAMOND SPORTS TL B | -7.90% | 36.79 | 39.94 |
| 5 | GENESIS CARE EUR TL B | -6.98% | 88.40 | 95.03 |
| 6 | ENVISION HEALTHCARE TL B | -4.45% | 74.98 | 78.47 |
| 7 | 8TH AVENUE FOOD & PROVISIONS EXT TL B | -3.82% | 91.38 | 95.01 |
| 8 | GENESIS CARE TL B | -3.79% | 90.00 | 93.54 |
| 9 | 24 HOUR FITNESS EXIT TL | -2.65% | 70.75 | 72.67 |
| 10 | INTERIOR LOGIC TL B | -2.40% | 94.21 | 96.53 |
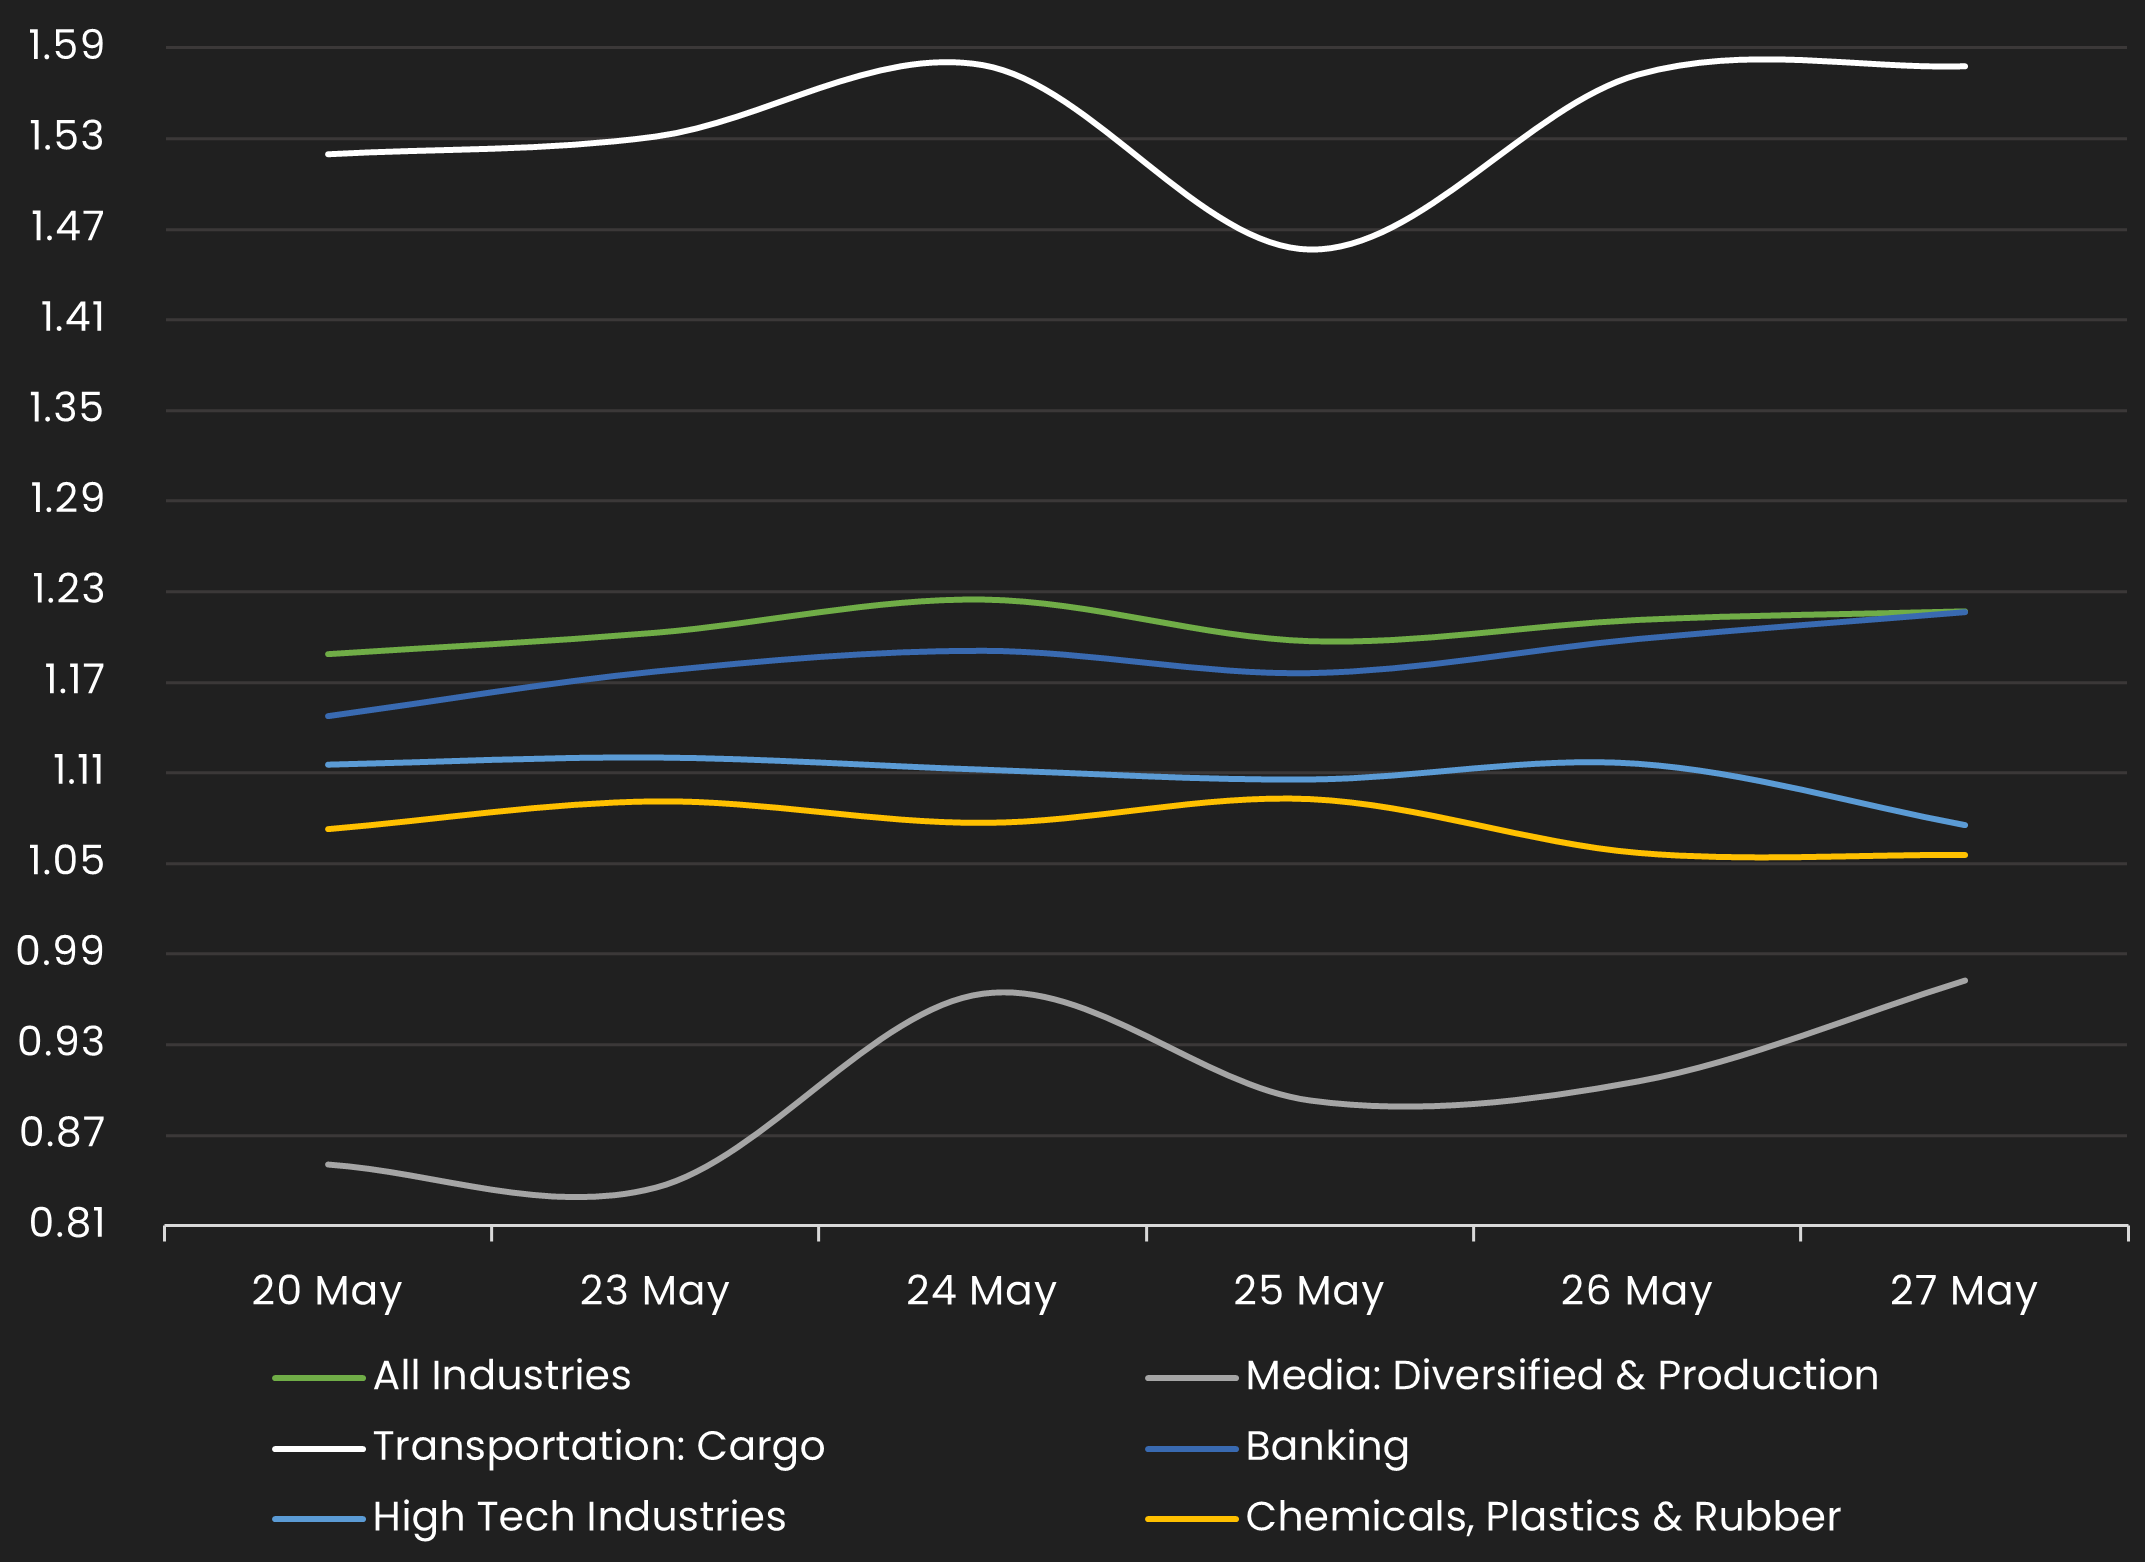
Avg Bid PX by Sector
Displays the average loan bid price by sector between 2/11/22 – 2/18/22 Results are based on 5 select industry sectors, however, we offer data across 36 sectors
Sentiment
Reveals the percent of loans increasing in price (advancers) vs. loans decreasing in price (decliners) between 2/11/22 – 2/18/22
Top Quote Volume Movers: This Week vs Last Week
Exhibits the loans with the largest increase in quote volume for the week ending 2/11/22 vs. the week ending 2/18/22
| RANK | TRANCHE | PRIOR WEEK | THIS WEEK | INCREASE | % INCREASE |
|---|---|---|---|---|---|
| 1 | TELESAT TL B | 38 | 62 | 24 | 63% |
| 2 | ADVISOR GROUP TL B | 52 | 74 | 22 | 42% |
| 3 | DEXKO DD TL | 0 | 20 | 20 | NA |
| 4 | SECTOR ALARM HOLDING EUR TL B1 | 36 | 56 | 20 | 56% |
| 5 | COGNITA FINANCING PLC EUR TL B1 | 24 | 43 | 19 | 79% |
| 6 | SEAWORLD TL B | 26 | 44 | 18 | 69% |
| 7 | MEHILAINEN EUR TL B2 | 44 | 62 | 18 | 41% |
| 8 | TRICO PRODUCTS TL B | 34 | 52 | 18 | 53% |
| 9 | INFORMATION RESOURCES TL B | 33 | 50 | 17 | 52% |
| 10 | 8TH AVENUE FOOD & PROVISIONS TL | 12 | 29 | 17 | 142% |
Most Quoted Loans
Ranks the loans that were quoted by the highest number of dealers between 2/11/22 – 2/18/22
| RANK | TRANCHE | DEALERS |
|---|---|---|
| 1 | ENVISION HEALTHCARE TL B | 19 |
| 2 | AMC ENTERTAINMENT TL B1 | 19 |
| 3 | DOUGLAS HOLDING EUR TL B | 19 |
| 4 | LUMILEDS TL B | 18 |
| 5 | HUB INTL LTD TL B | 18 |
| 6 | IFCO EUR TL B | 18 |
| 7 | ZAYO TL | 18 |
| 8 | ACTION NEDERLAND EUR TL B | 17 |
| 9 | GVC HOLDINGS EUR TL B3 | 17 |
| 10 | ZIGGO EUR TL H | 17 |
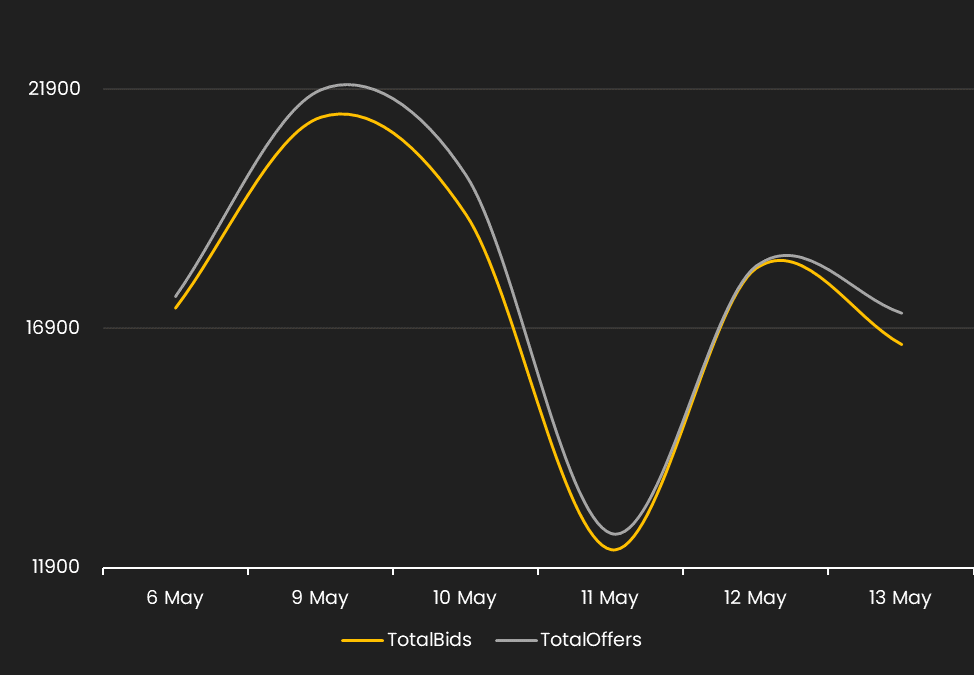
Bid and Offer Volume
Reveals the total number of quotes by bid and offer between 2/11/22 – 2/18/22

Sector Bid-Offer Spread
Displays the bid-offer spread by sector between 2/11/22 – 2/18/22 Results are based on 5 select industry sectors, however, we offer data across 36 sectors
Stay up-to-date with weekly summaries.
Related Resources
About SOLVE
SOLVE is the leading market data platform provider for fixed-income securities, trusted by sophisticated buy-side and sell-side firms worldwide. Founded in 2011, SOLVE leverages its AI-driven technology and deep industry expertise to offer unparalleled transparency into markets, reduce risk, and save hundreds of hours across front-office workflows. With the largest real-time datasets for Securitized Products, Municipal Bonds, Corporate Bonds, Syndicated Bank Loans, Convertible Bonds, CDS, and Private Credit, SOLVE empowers clients to transform the way they bring new securities to market, trade on secondary markets, and value highly illiquid securities. Headquartered in Connecticut, with offices across the globe, SOLVE is the definitive source for market pricing in fixed-income markets.
