Municipal Bond Market Summary – Week Ending 12/3/21
GET OUR MUNICIPAL BOND MARKET SUMMARIES STRAIGHT TO YOUR INBOX. LEARN MORE
Municipal Bond Market Summary: Week Ending 12/3/21
Our newsletter presents key trends derived from observable Municipal Bond pricing data over a weekly period.
Top 10 Winners
Showcases the top 10 Muni Bond “Winners” based on price movements between 11/26/21 – 12/3/21
| RANK | BOND NAME | COUPON | MATURITY | CHANGE | PX | PX-1W |
|---|---|---|---|---|---|---|
| 1 | OHIO ST UNIV-A-TXBL | 4.80% | 06/01/11 | 5.68% | 162.54 | 153.81 |
| 2 | MILWAUKEE REDEV-CAB-C | 0.00% | 04/01/40 | 4.78% | 54.93 | 52.42 |
| 3 | UNIV OF MICHIGAN MI | 2.56% | 04/01/50 | 4.61% | 104.27 | 99.68 |
| 4 | MO HLTH & EDU FACS-A | 3.65% | 08/15/57 | 3.96% | 129.30 | 124.38 |
| 5 | DASNY-A-TXBL-REF | 2.97% | 07/01/48 | 3.77% | 104.67 | 100.86 |
| 6 | NASHVILLE ETC-B-REV | 3.24% | 07/01/52 | 3.76% | 104.75 | 100.95 |
| 7 | RUTGERS UNIV-P-TXBL | 3.92% | 05/01/19 | 3.67% | 123.37 | 119.00 |
| 8 | SD HLTH & ED SANFORD | 3.17% | 11/01/52 | 3.28% | 104.76 | 101.43 |
| 9 | NEW ORLEANS LA WTR RE | 2.34% | 12/01/36 | 3.07% | 98.14 | 95.22 |
| 10 | UNIV OF TEXAS SYS BRD | 3.35% | 08/15/47 | 3.02% | 118.54 | 115.06 |
Top 10 Losers
Showcases the top 10 Muni Bond “Losers” based on price movements between 11/26/21 – 12/3/21
| RANK | BOND NAME | COUPON | MATURITY | CHANGE | PX | PX-1W |
|---|---|---|---|---|---|---|
| 1 | PA DEV WST MGMT PJ | 1.55% | 12/01/33 | -2.50% | 97.50 | 100.00 |
| 2 | HOUSTON-A-AMT-REV | 4.00% | 07/01/38 | -1.96% | 119.37 | 121.75 |
| 3 | INDIANA ST HSG & CMNT | 2.00% | 01/01/30 | -1.91% | 100.38 | 102.33 |
| 4 | CMFA SPL FIN AGY CA E | 4.00% | 12/01/45 | -1.59% | 98.41 | 100.00 |
| 5 | HARVEY CO UNIF SD#439 | 2.00% | 09/01/39 | -1.46% | 97.08 | 98.52 |
| 6 | BAYONNE-REF-IMPT | 5.00% | 07/01/26 | -1.42% | 118.61 | 120.31 |
| 7 | WASHINGTON CMNTY SD | 2.00% | 06/01/41 | -1.32% | 97.94 | 99.25 |
| 8 | EL DORADO -A -REF | 4.00% | 11/01/31 | -1.23% | 123.93 | 125.48 |
| 9 | COAST CMNTY CLG DT | 2.89% | 08/01/35 | -1.12% | 105.20 | 106.39 |
| 10 | BOLINGBROOK-A-REF | 5.00% | 01/01/29 | -1.11% | 121.31 | 122.68 |
Top 10 State Winners
Showcases the top 10 Muni State “Winners” based on yield movements between 11/26/21 – 12/3/21
| RANK | STATE | CHANGE | YLD | YLD-1W |
|---|---|---|---|---|
| 1 | AZ | -30 bps | 1.52% | 1.82% |
| 2 | WA | -23 bps | 2.16% | 2.39% |
| 3 | IL | -20 bps | 2.29% | 2.50% |
| 4 | MO | -12 bps | 2.11% | 2.23% |
| 5 | OR | -11 bps | 1.87% | 1.98% |
| 6 | NY | -9 bps | 2.13% | 2.23% |
| 7 | TX | -9 bps | 2.27% | 2.36% |
| 8 | NC | -8 bps | 1.39% | 1.47% |
| 9 | MS | -6 bps | 1.87% | 1.93% |
| 10 | CO | -6 bps | 1.65% | 1.71% |
Top 10 State Losers
Showcases the top 10 Muni State “Losers” based on yield movements between 11/26/21 – 12/3/21
| RANK | STATE | CHANGE | YLD | YLD-1W |
|---|---|---|---|---|
| 1 | IA | 24 bps | 1.88% | 1.65% |
| 2 | PA | 22 bps | 2.40% | 2.18% |
| 3 | AL | 19 bps | 2.10% | 1.91% |
| 4 | FL | 19 bps | 1.95% | 1.76% |
| 5 | MN | 17 bps | 1.92% | 1.76% |
| 6 | MA | 16 bps | 2.32% | 2.15% |
| 7 | MD | 16 bps | 1.49% | 1.33% |
| 8 | KS | 16 bps | 2.06% | 1.91% |
| 9 | HI | 15 bps | 2.04% | 1.89% |
| 10 | OH | 9 bps | 2.17% | 2.08% |
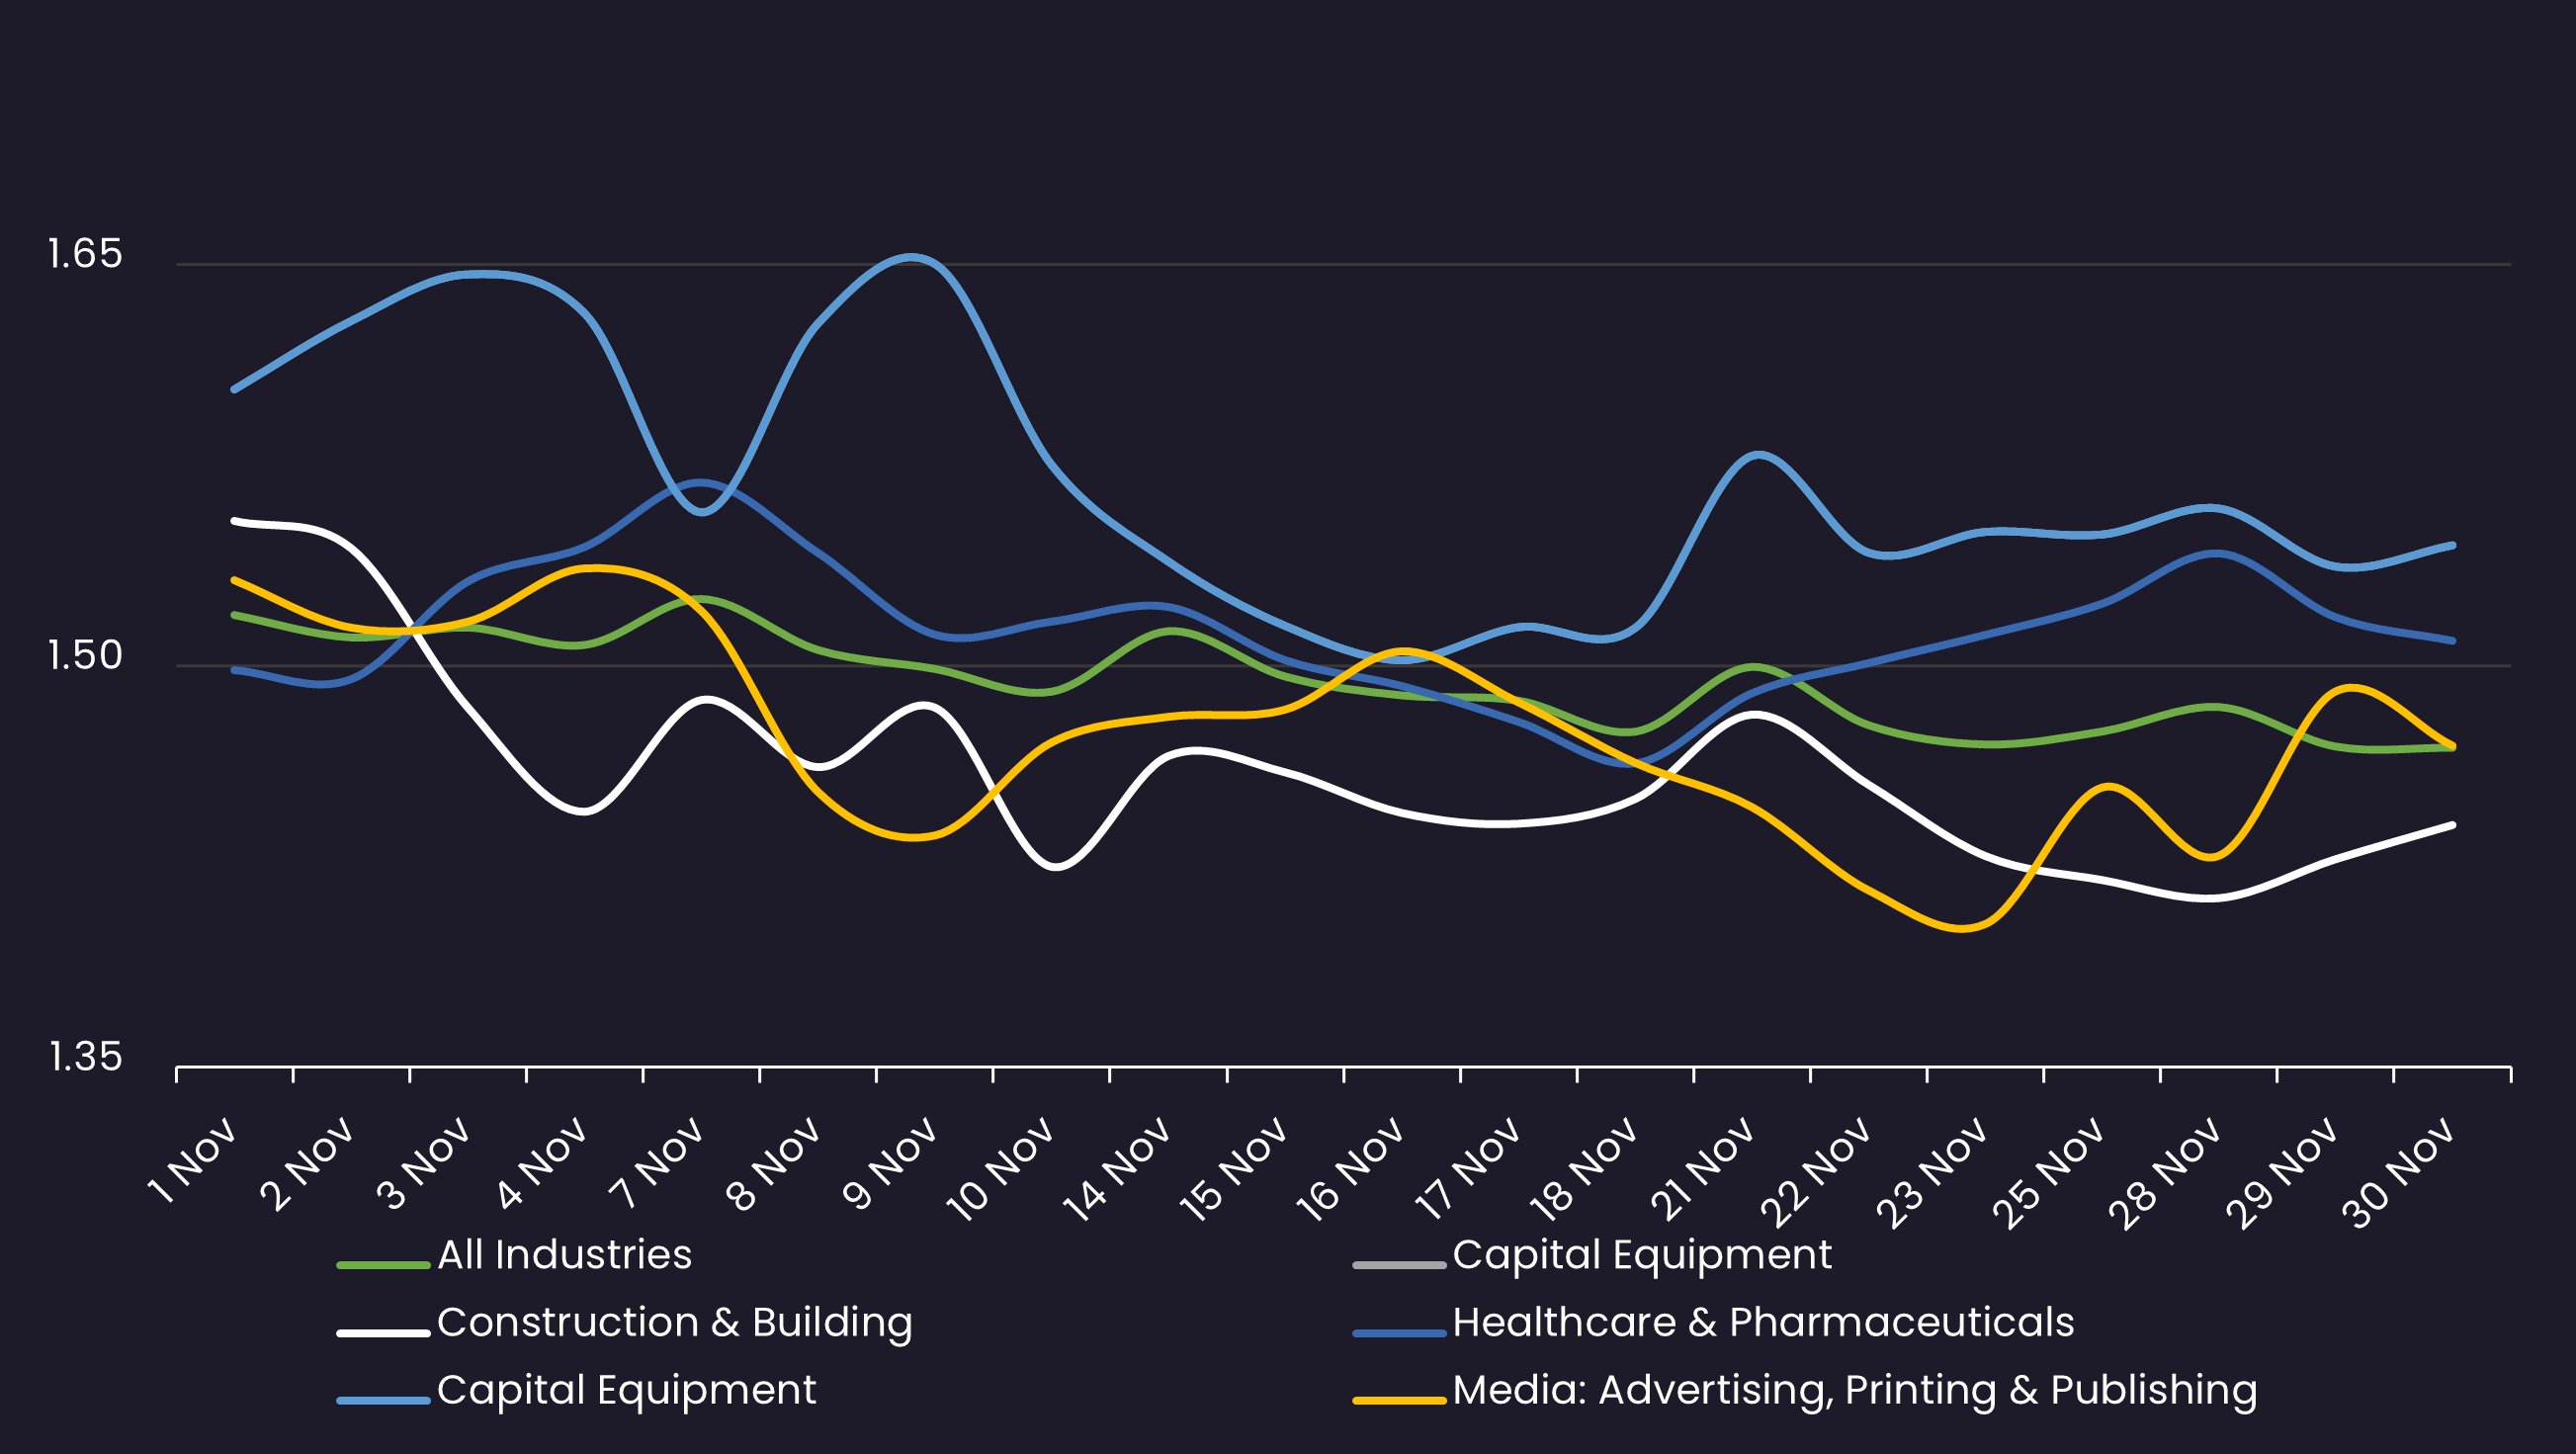
10 Year Yield by State – All
Displays the average Muni 10 year yield by state between 11/26/21 – 12/3/21 (General Obligation and Revenue Bonds) Results are based on 5 select states, however, we offer data across all 50 states and U.S. territories
10 Year Yield by State – GO Only
Displays the average Muni 10 year yield by state between 11/26/21 – 12/3/21 (General Obligation Bonds only) Results are based on 5 select states, however, we offer data across all 50 states and U.S. territories
10 Year Yield by State – Rev Only
Displays the average Muni 10 year yield by state between 11/26/21 – 12/3/21 (Revenue Bonds only) Results are based on 5 select states, however, we offer data across all 50 states and U.S. territories
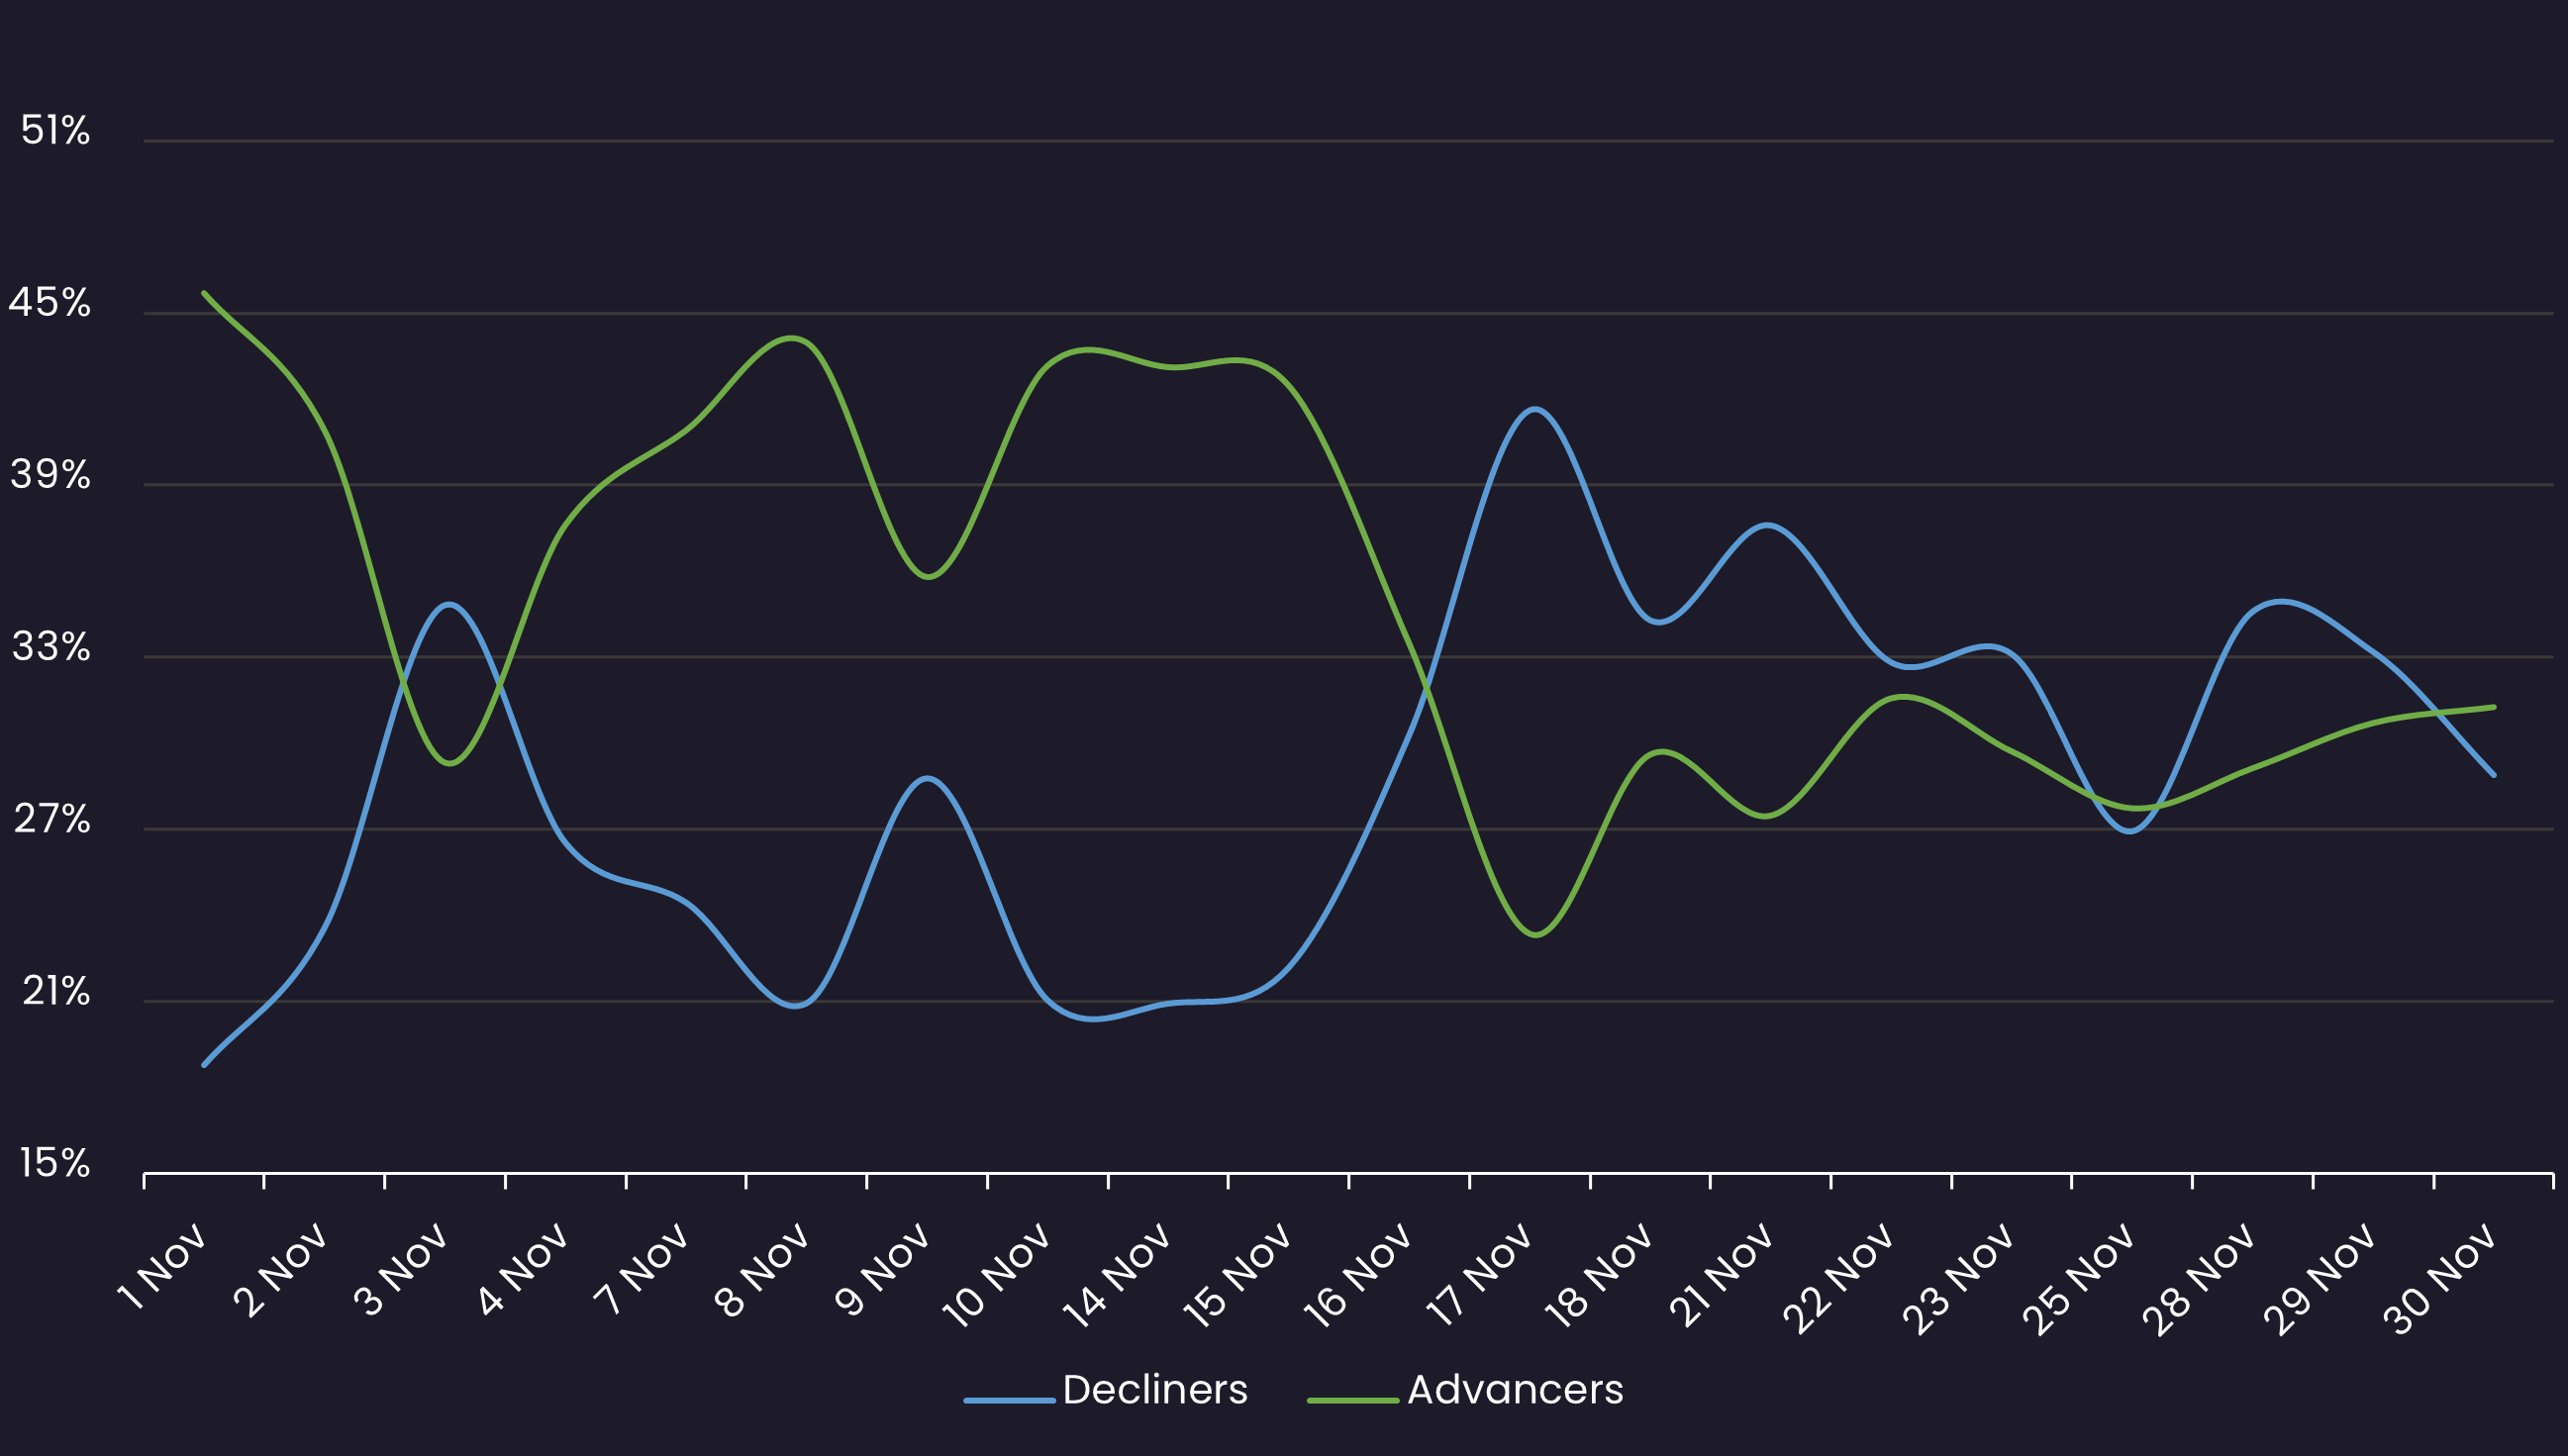
Sentiment
Reveals the percent of Muni bonds increasing in price (advancers) vs. decreasing in price (decliners) between 11/26/21 – 12/3/21

Top Quote Volume Movers: This Week vs Last Week
Exhibits the Munis with the largest increase in quote volume for the week ending 11/26/21 vs. the week ending 12/3/21
| RANK | TRANCHE | COUPON | MATURITY | PRIOR WEEK | THIS WEEK | INCREASE | % INCREASE |
|---|---|---|---|---|---|---|---|
| 1 | PHILADELPHIA PA WTR & | 5.00% | 10/01/46 | 33 | 100 | 67 | 203% |
| 2 | SAN DIEGO UNIF SD -D2 | 4.00% | 07/01/50 | 17 | 75 | 58 | 341% |
| 3 | NJ TRN FD CAB-SER C | 0.00% | 12/15/33 | 70 | 118 | 48 | 69% |
| 4 | UNIV OF TEXAS TX-BOR | 5.00% | 08/15/49 | 45 | 92 | 47 | 104% |
| 5 | NY MUNI WTR FIN -BB2 | 4.00% | 06/15/42 | 45 | 89 | 44 | 98% |
| 6 | CHARLESTON CO -A | 5.00% | 11/01/29 | 6 | 49 | 43 | 717% |
| 7 | CLARKE CO CLASSIC CTR | 3.00% | 05/01/61 | 26 | 68 | 42 | 162% |
| 8 | MET WASHINGTON DC ARP | 4.00% | 10/01/51 | 69 | 111 | 42 | 61% |
| 9 | LOS ANGELES CO METRO | 5.00% | 07/01/39 | 10 | 51 | 41 | 410% |
| 10 | LYNCHBURG ECON DEV | 4.00% | 01/01/47 | 10 | 50 | 40 | 400% |
Most Quoted Munis
Ranks the Munis that were quoted by the highest number of dealers between 11/26/21 – 12/3/21
| RANK | TRANCHE | COUPON | MATURITY | DEALERS |
|---|---|---|---|---|
| 1 | NYC MUNI WTR FIN-BB-1 | 4.00% | 06/15/45 | 30 |
| 2 | NYC MUNI WTR FIN-AA-1 | 4.00% | 06/15/51 | 27 |
| 3 | NJ TRN FD CAB-SER C | 0.00% | 12/15/33 | 26 |
| 4 | NEW YORK ST DORM AUTH | 5.00% | 10/01/50 | 26 |
| 5 | MARYLAND STADIUM AUTH | 2.75% | 06/01/51 | 25 |
| 6 | OAKLAND USD-A | 4.00% | 08/01/46 | 25 |
| 7 | CONNECTICUT ST -D | 4.00% | 11/01/40 | 25 |
| 8 | SALT LAKE-A-AMT | 5.00% | 07/01/46 | 24 |
| 9 | CONNECTICUT ST -D | 4.00% | 11/01/39 | 24 |
| 10 | TEXAS ST-A-REF-TRNSPR | 5.00% | 10/01/24 | 23 |
Stay up-to-date with weekly summaries.
Related Resources
About SOLVE
SOLVE is the leading market data platform provider for fixed-income securities, trusted by sophisticated buy-side and sell-side firms worldwide. Founded in 2011, SOLVE leverages its AI-driven technology and deep industry expertise to offer unparalleled transparency into markets, reduce risk, and save hundreds of hours across front-office workflows. With the largest real-time datasets for Securitized Products, Municipal Bonds, Corporate Bonds, Syndicated Bank Loans, Convertible Bonds, CDS, and Private Credit, SOLVE empowers clients to transform the way they bring new securities to market, trade on secondary markets, and value highly illiquid securities. Headquartered in Connecticut, with offices across the globe, SOLVE is the definitive source for market pricing in fixed-income markets.
