Municipal Bond Market Summary – Week Ending 10/29/21
GET OUR MUNICIPAL BOND MARKET SUMMARIES STRAIGHT TO YOUR INBOX. LEARN MORE
Municipal Bond Market Summary: Week Ending 10/29/21
Our newsletter presents key trends derived from observable Municipal Bond pricing data over a weekly period.
Top 10 Winners
Showcases the top 10 Muni Bond “Winners” based on price movements between 10/22/21 – 10/29/21
| RANK | BOND NAME | COUPON | MATURITY | CHANGE | PX | PX-1W |
|---|---|---|---|---|---|---|
| 1 | PUB IMPT-SER A-PSA | 5.75% | 07/01/41 | 6.76% | 98.03 | 91.82 |
| 2 | DC WTR & SWR-A-TXBL | 4.81% | 10/01/14 | 5.62% | 150.09 | 142.11 |
| 3 | OHIO ST UNIV-A-TXBL | 4.80% | 06/01/11 | 4.12% | 150.36 | 144.42 |
| 4 | PA TPK-BABS-B | 5.51% | 12/01/45 | 2.70% | 144.26 | 140.47 |
| 5 | LOS ANGELES CMNTY CL | 6.75% | 08/01/49 | 2.67% | 173.63 | 169.11 |
| 6 | UNIV OF TEXAS SYS BRD | 3.35% | 08/15/47 | 2.36% | 115.31 | 112.65 |
| 7 | SIENNA MUD#5 | 2.13% | 11/01/36 | 2.31% | 95.26 | 93.11 |
| 8 | AMERN MUN PWR-B-BABS | 7.83% | 02/15/41 | 2.30% | 166.19 | 162.44 |
| 9 | ROWLAND CA WTR DIST W | 2.71% | 12/01/38 | 2.27% | 101.05 | 98.80 |
| 10 | HIGHLAND LOCAL SD-CAB | 0.00% | 12/01/37 | 2.15% | 63.86 | 62.52 |
Top 10 Losers
Showcases the top 10 Muni Bond “Losers” based on price movements between 10/22/21 – 10/29/21
| RANK | BOND NAME | COUPON | MATURITY | CHANGE | PX | PX-1W |
|---|---|---|---|---|---|---|
| 1 | BROOKLYN CENTR-A | 5.50% | 11/01/35 | -7.97% | 88.35 | 96.00 |
| 2 | PFLUGERVILLE-B-CTFS | 3.00% | 08/01/41 | -3.50% | 105.71 | 109.54 |
| 3 | GRAND RVR DAM AUTH-B | 6.93% | 06/01/30 | -3.30% | 119.74 | 123.83 |
| 4 | MERIDEN-C-REF | 2.00% | 02/15/31 | -3.18% | 101.19 | 104.51 |
| 5 | RIO HONDO CLG-CABS-B | 0.00% | 08/01/33 | -2.82% | 77.71 | 79.97 |
| 6 | MULTNOMAH SD #1J-TXBL | 2.35% | 06/30/37 | -2.72% | 92.57 | 95.16 |
| 7 | WAYNE CNTY MI ARPT AU | 5.00% | 12/01/36 | -2.56% | 129.74 | 133.16 |
| 8 | STHRN CA | 5.00% | 11/01/33 | -2.37% | 128.70 | 131.82 |
| 9 | SALISBURY -REF | 1.00% | 09/01/31 | -2.22% | 95.53 | 97.70 |
| 10 | MET TRANSPRTN AUTH NY | 5.00% | 11/15/34 | -2.18% | 116.30 | 118.89 |
Top 10 State Winners
Showcases the top 10 Muni State “Winners” based on yield movements between 10/22/21 – 10/29/21
| RANK | STATE | CHANGE | YLD | YLD-1W |
|---|---|---|---|---|
| 1 | MI | -44 bps | 1.76% | 2.20% |
| 2 | MS | -42 bps | 1.85% | 2.27% |
| 3 | VA | -38 bps | 1.51% | 1.88% |
| 4 | OR | -28 bps | 1.85% | 2.13% |
| 5 | NC | -27 bps | 1.52% | 1.79% |
| 6 | AL | -27 bps | 1.85% | 2.12% |
| 7 | LA | -26 bps | 2.28% | 2.54% |
| 8 | CO | -22 bps | 1.60% | 1.82% |
| 9 | PA | -19 bps | 2.08% | 2.26% |
| 10 | IA | -17 bps | 1.85% | 2.02% |
Top 10 State Losers
Showcases the top 10 Muni State “Losers” based on yield movements between 10/22/21 – 10/29/21
| RANK | STATE | CHANGE | YLD | YLD-1W |
|---|---|---|---|---|
| 1 | NJ | 21 bps | 2.10% | 1.89% |
| 2 | WV | 16 bps | 1.77% | 1.61% |
| 3 | UT | 13 bps | 1.83% | 1.70% |
| 4 | CT | 9 bps | 2.47% | 2.38% |
| 5 | HI | 9 bps | 2.49% | 2.40% |
| 6 | WI | 9 bps | 2.24% | 2.15% |
| 7 | CA | 5 bps | 2.31% | 2.26% |
| 8 | TX | 5 bps | 2.36% | 2.31% |
| 9 | NY | 2 bps | 2.31% | 2.29% |
| 10 | MO | 0 bps | 2.48% | 2.47% |
10 Year Yield by State – All
Displays the average Muni 10 year yield by state between 10/22/21 – 10/29/21 (General Obligation and Revenue Bonds) Results are based on 5 select states, however, we offer data across all 50 states and U.S. territories

10 Year Yield by State – GO Only
Displays the average Muni 10 year yield by state between 10/22/21 – 10/29/21 (General Obligation Bonds only) Results are based on 5 select states, however, we offer data across all 50 states and U.S. territories

10 Year Yield by State – Rev Only
Displays the average Muni 10 year yield by state between 10/22/21 – 10/29/21 (Revenue Bonds only) Results are based on 5 select states, however, we offer data across all 50 states and U.S. territories

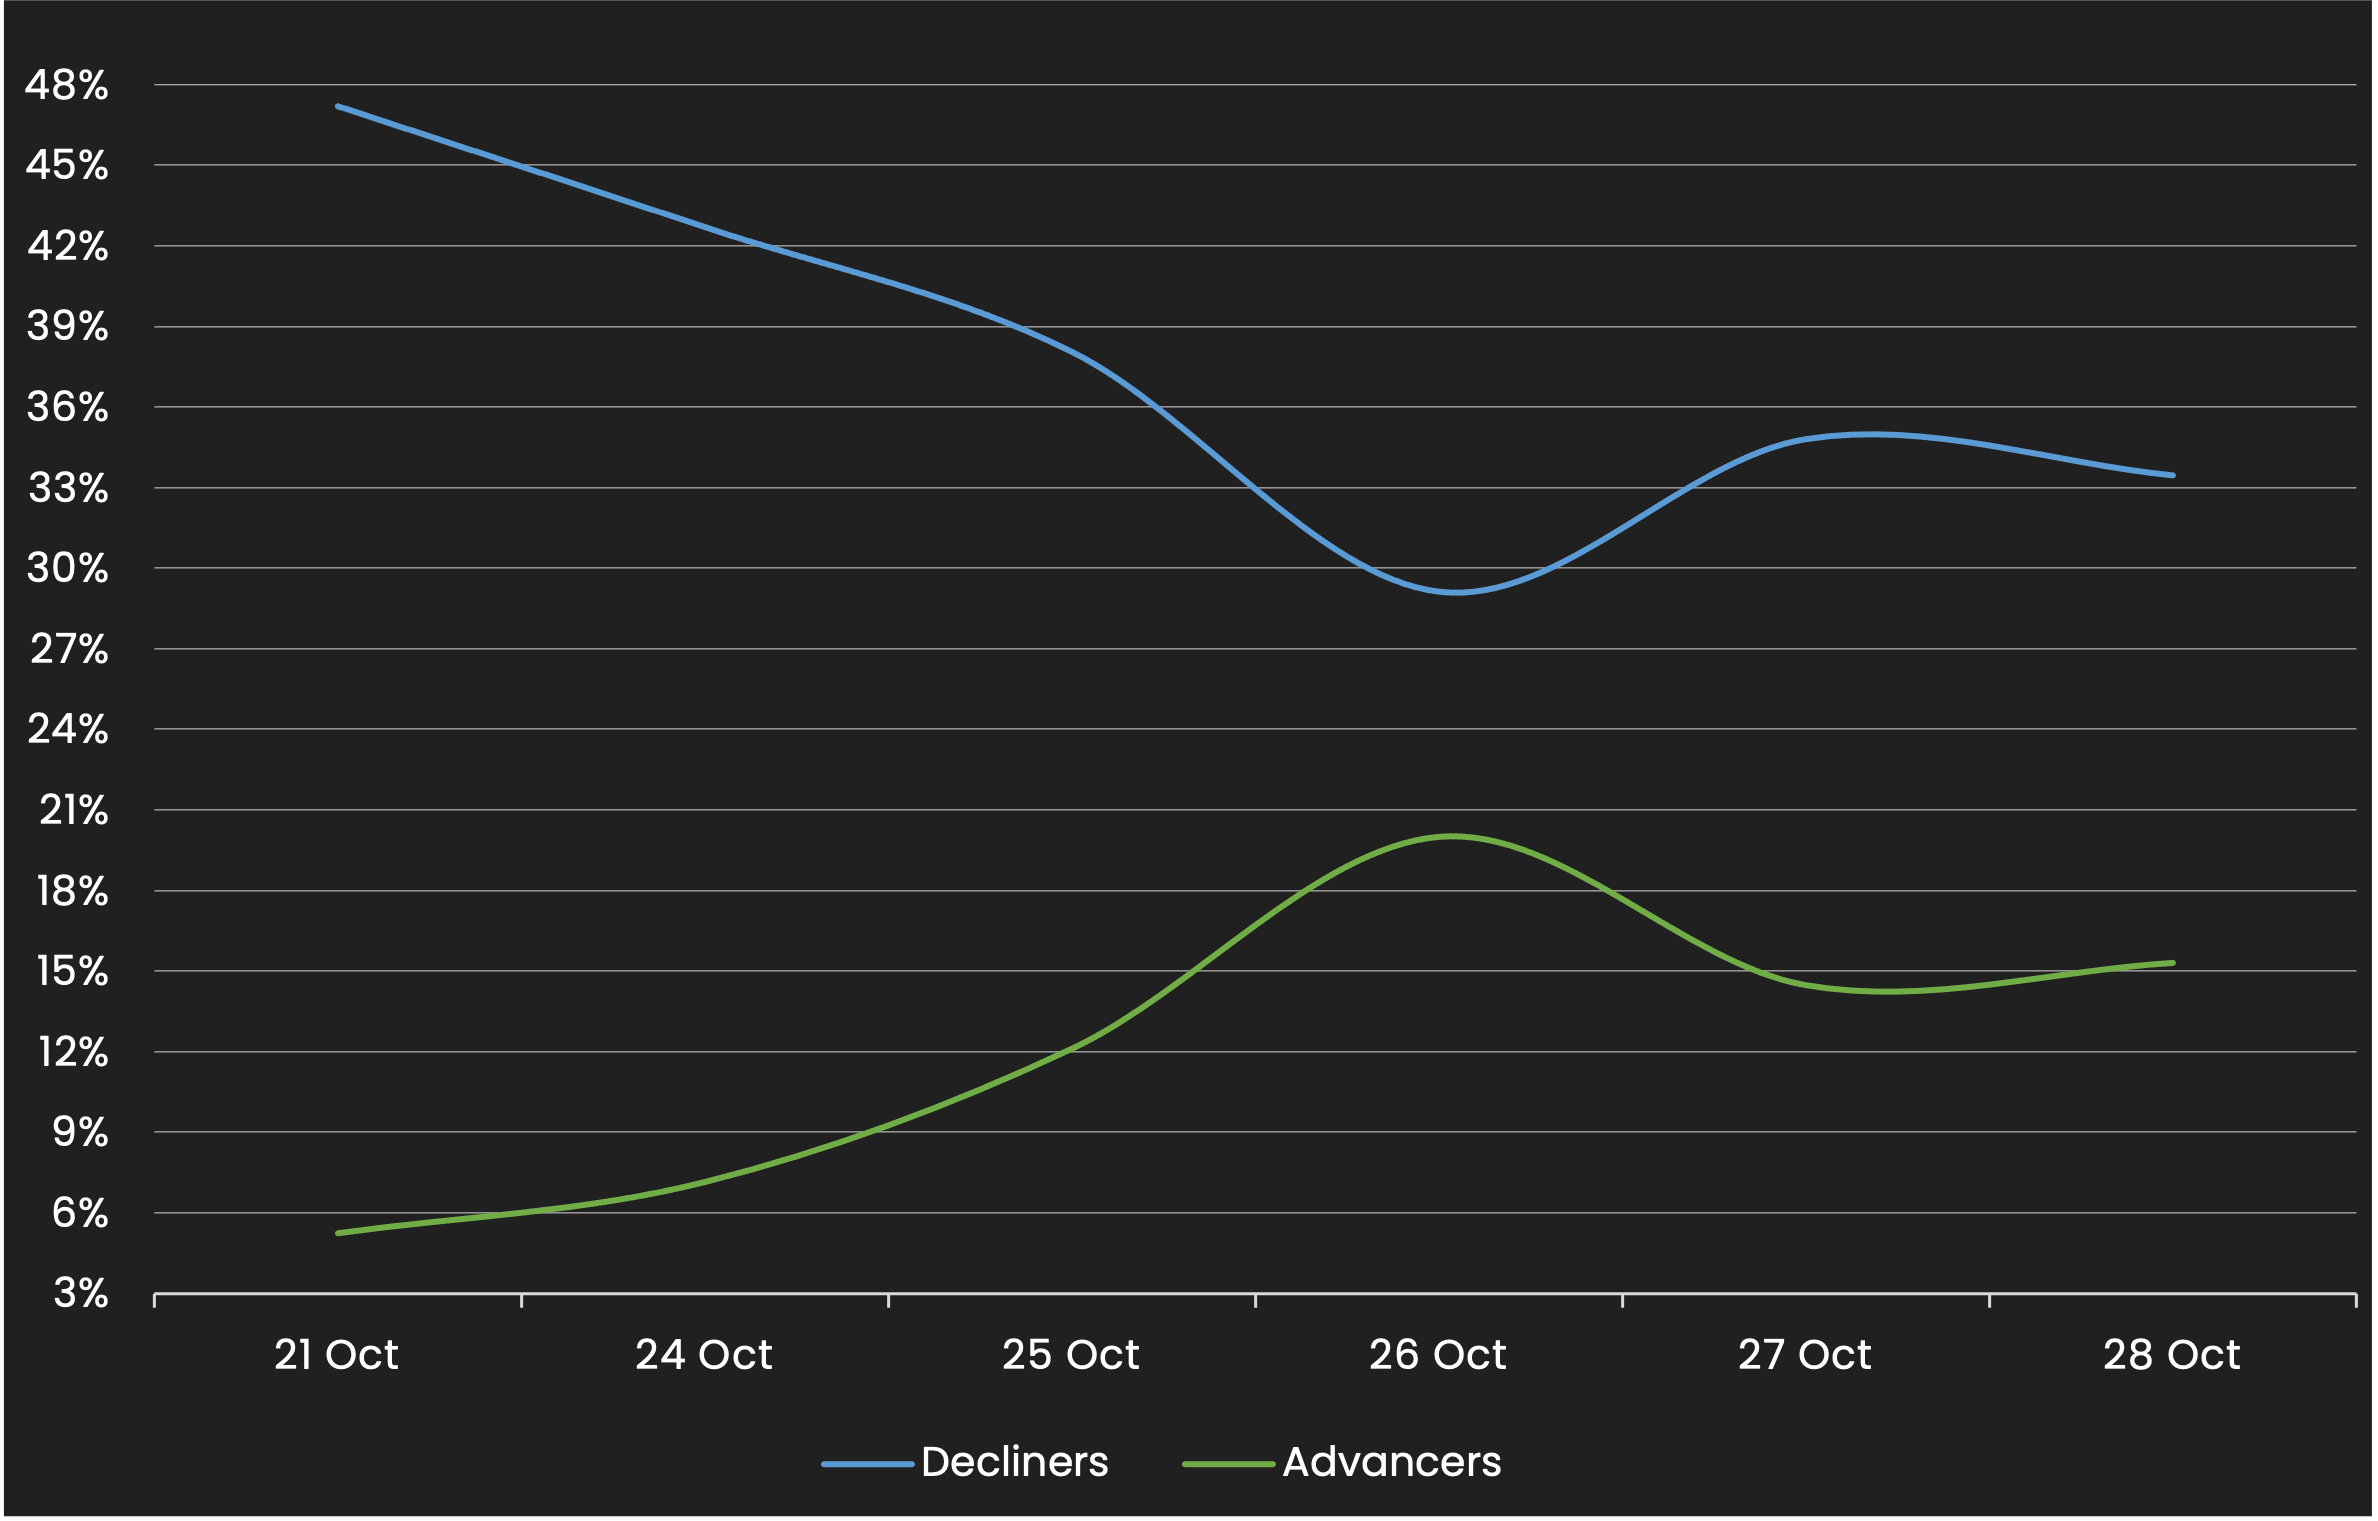
Sentiment
Reveals the percent of Muni bonds increasing in price (advancers) vs. decreasing in price (decliners) between 10/22/21 – 10/29/21
Top Quote Volume Movers: This Week vs Last Week
Exhibits the Munis with the largest increase in quote volume for the week ending 10/22/21 vs. the week ending 10/29/21
| RANK | TRANCHE | COUPON | MATURITY | PRIOR WEEK | THIS WEEK | INCREASE | % INCREASE |
|---|---|---|---|---|---|---|---|
| 1 | LOS ANGELES CO MTA -A | 4.00% | 06/01/37 | 9 | 86 | 77 | 856% |
| 2 | LOS ANGELES DEPT AIRP | 5.00% | 05/15/31 | 6 | 55 | 49 | 817% |
| 3 | MORENO VLY UNIF SD-C | 3.00% | 08/01/50 | 6 | 53 | 47 | 783% |
| 4 | NEW YORK ST THRUWAY-A | 4.00% | 03/15/39 | 6 | 50 | 44 | 733% |
| 5 | GEISINGER PA AUTH HLT | 4.00% | 04/01/39 | 20 | 62 | 42 | 210% |
| 6 | CALIFORNIA STWD CMNTY | 3.00% | 04/01/46 | 15 | 55 | 40 | 267% |
| 7 | CONNECTICUT ST -A | 5.00% | 01/15/41 | 4 | 43 | 39 | 975% |
| 8 | NEW HAMPSHIRE ST-C | 5.00% | 12/01/38 | 3 | 41 | 38 | 1267% |
| 9 | NEW YORK ST DORM AUTH | 5.00% | 10/01/50 | 75 | 113 | 38 | 51% |
| 10 | ALABAMA FEDERAL AID | 1.86% | 09/01/29 | 42 | 80 | 38 | 90% |
Most Quoted Munis
Ranks the Munis that were quoted by the highest number of dealers between 10/22/21 – 10/29/21
| RANK | TRANCHE | COUPON | MATURITY | DEALERS |
|---|---|---|---|---|
| 1 | CALIFORNIA ST-REF | 5.00% | 09/01/29 | 29 |
| 2 | CALIFORNIA ST | 4.00% | 10/01/37 | 28 |
| 3 | NYC MUNI WTR FIN-BB-1 | 4.00% | 06/15/45 | 28 |
| 4 | NYC MUNI WTR FIN-AA-1 | 4.00% | 06/15/51 | 27 |
| 5 | NEW YORK -A-1 | 5.00% | 08/01/47 | 26 |
| 6 | CALIFORNIA ST | 4.00% | 10/01/36 | 26 |
| 7 | SALT LAKE-A-AMT | 5.00% | 07/01/46 | 25 |
| 8 | TN ENERGY ACQ CORP-A | 5.00% | 05/01/52 | 25 |
| 9 | CALIFORNIA ST | 4.00% | 10/01/39 | 25 |
| 10 | CALIFORNIA CMNTY CHOI | 4.00% | 02/01/52 | 25 |
Stay up-to-date with weekly summaries.
Related Resources
About SOLVE
SOLVE is the leading market data platform provider for fixed-income securities, trusted by sophisticated buy-side and sell-side firms worldwide. Founded in 2011, SOLVE leverages its AI-driven technology and deep industry expertise to offer unparalleled transparency into markets, reduce risk, and save hundreds of hours across front-office workflows. With the largest real-time datasets for Securitized Products, Municipal Bonds, Corporate Bonds, Syndicated Bank Loans, Convertible Bonds, CDS, and Private Credit, SOLVE empowers clients to transform the way they bring new securities to market, trade on secondary markets, and value highly illiquid securities. Headquartered in Connecticut, with offices across the globe, SOLVE is the definitive source for market pricing in fixed-income markets.
