Investment Grade CDS Market Summary – September 2023
GET OUR CDS MARKET SUMMARIES STRAIGHT TO YOUR INBOX. LEARN MORE
Investment Grade CDS Market Summary:september 2023
Our newsletter presents key trends derived from observable Credit Default Swaps pricing data over a monthly period.
Top 10 Outperformers
Showcases the top 10 IG CDS “outperformers” based on the largest mid spread decreases between 9/1/23 – 9/30/23
| RANK | BOND NAME | ISSUER | % CHANGE | BPS CHANGE | SPRD | SPRD-1 MONTH | DEALERS |
|---|---|---|---|---|---|---|---|
| 1 | SHIMIZ 5Y | SHIMIZU CORP | -14.5% | -3 | 18 | 21 | 3 |
| 2 | LOUDRE 5Y | LOUIS DREYFUS CO BV | -10.6% | -17 | 141 | 158 | 4 |
| 3 | AMZN 5Y | AMAZON.COM INC | -10.5% | -4 | 35 | 39 | 3 |
| 4 | RELIN 5Y | RELIANCE HLDG USA INC | -6.5% | -5 | 68 | 73 | 3 |
| 5 | RTN 5Y | RAYTHEON CO | -5.4% | -1 | 12 | 13 | 3 |
| 6 | BABA 5Y | ALIBABA GROUP HOLDING | -5.3% | -7 | 121 | 128 | 3 |
| 7 | RENTOKIL 5Y | RENTOKIL GROUP PLC | -4.8% | -3 | 57 | 60 | 3 |
| 8 | BOCAVI 5Y CDS | BOC AVIATION LTD | -4.2% | -6 | 143 | 150 | 3 |
| 9 | EJRAIL 5Y | EAST JAPAN RAILWAY COMPANY | -3.5% | -1 | 26 | 27 | 3 |
| 10 | GE 5Y | GENERAL ELEC CAP CORP MEDIUM | -2.4% | -2 | 65 | 67 | 4 |
Top 10 Underperformers
Showcases the top 10 IG CDS “underperformers” based on the largest mid spread increases between 9/1/23 – 9/30/23
| RANK | BOND NAME | ISSUER | % CHANGE | BPS CHANGE | SPRD | SPRD-1 MONTH | DEALERS |
|---|---|---|---|---|---|---|---|
| 1 | ACE 5Y | ACE INA HLDG INC | 69.7% | 17 | 42 | 25 | 4 |
| 2 | CB 5Y | CHUBB CORP | 60.5% | 15 | 40 | 25 | 6 |
| 3 | NMAC 5Y | NISSAN MTR ACCEP CORP | 35.2% | 35 | 134 | 99 | 3 |
| 4 | BASGR 5Y | ENGELHARD CORP | 35.1% | 21 | 80 | 59 | 4 |
| 5 | AUCHAN 5Y | AUCHAN SA | 32.7% | 52 | 212 | 159 | 4 |
| 6 | ORCL 5Y | ORACLE CORP | 31.8% | 17 | 71 | 54 | 4 |
| 7 | AIRFP 5Y | AIRBUS SE | 28.6% | 18 | 79 | 62 | 4 |
| 8 | CARLB 5Y | CARLSBERG AS | 28.5% | 9 | 41 | 32 | 4 |
| 9 | MOT 5Y | MOTOROLA INC | 27.8% | 11 | 50 | 39 | 4 |
| 10 | RTX 5Y | UNITED TECHNOLOGIES CORP | 26.0% | 11.5 | 56 | 44 | 5 |
Normalized IG Spread by Region
Displays the IG CDS spread by region between 9/1/23 – 9/30/23 Results are based on 5 select regions, however, we offer data across 12 regions

IG Spread by Region – Monthly Comparison
Exhibits the IG mid spread by region for the month ending 8/31/23 vs. the month ending 9/30/23
| REGION | PREVIOUS SPREAD | CURRENT SPREAD | BPS CHANGE | MONTHLY PERFORMANCE | CDS COUNT |
|---|---|---|---|---|---|
| Global | 61 | 66 | 6 | Wider | 529 |
| U.S. | 59 | 65 | 6 | Wider | 190 |
| Japan | 35 | 40 | 4 | Wider | 43 |
| Europe | 62 | 70 | 8 | Wider | 148 |
| APAC | 55 | 59 | 4 | Wider | 41 |
| Latin America | 74 | 85 | 11 | Wider | 9 |
Normalized IG Spread by Industry
Displays the IG CDS spread by industry between 9/1/23 – 9/30/23 Results are based on 5 select industry sectors, however, we offer data across 36 sectors
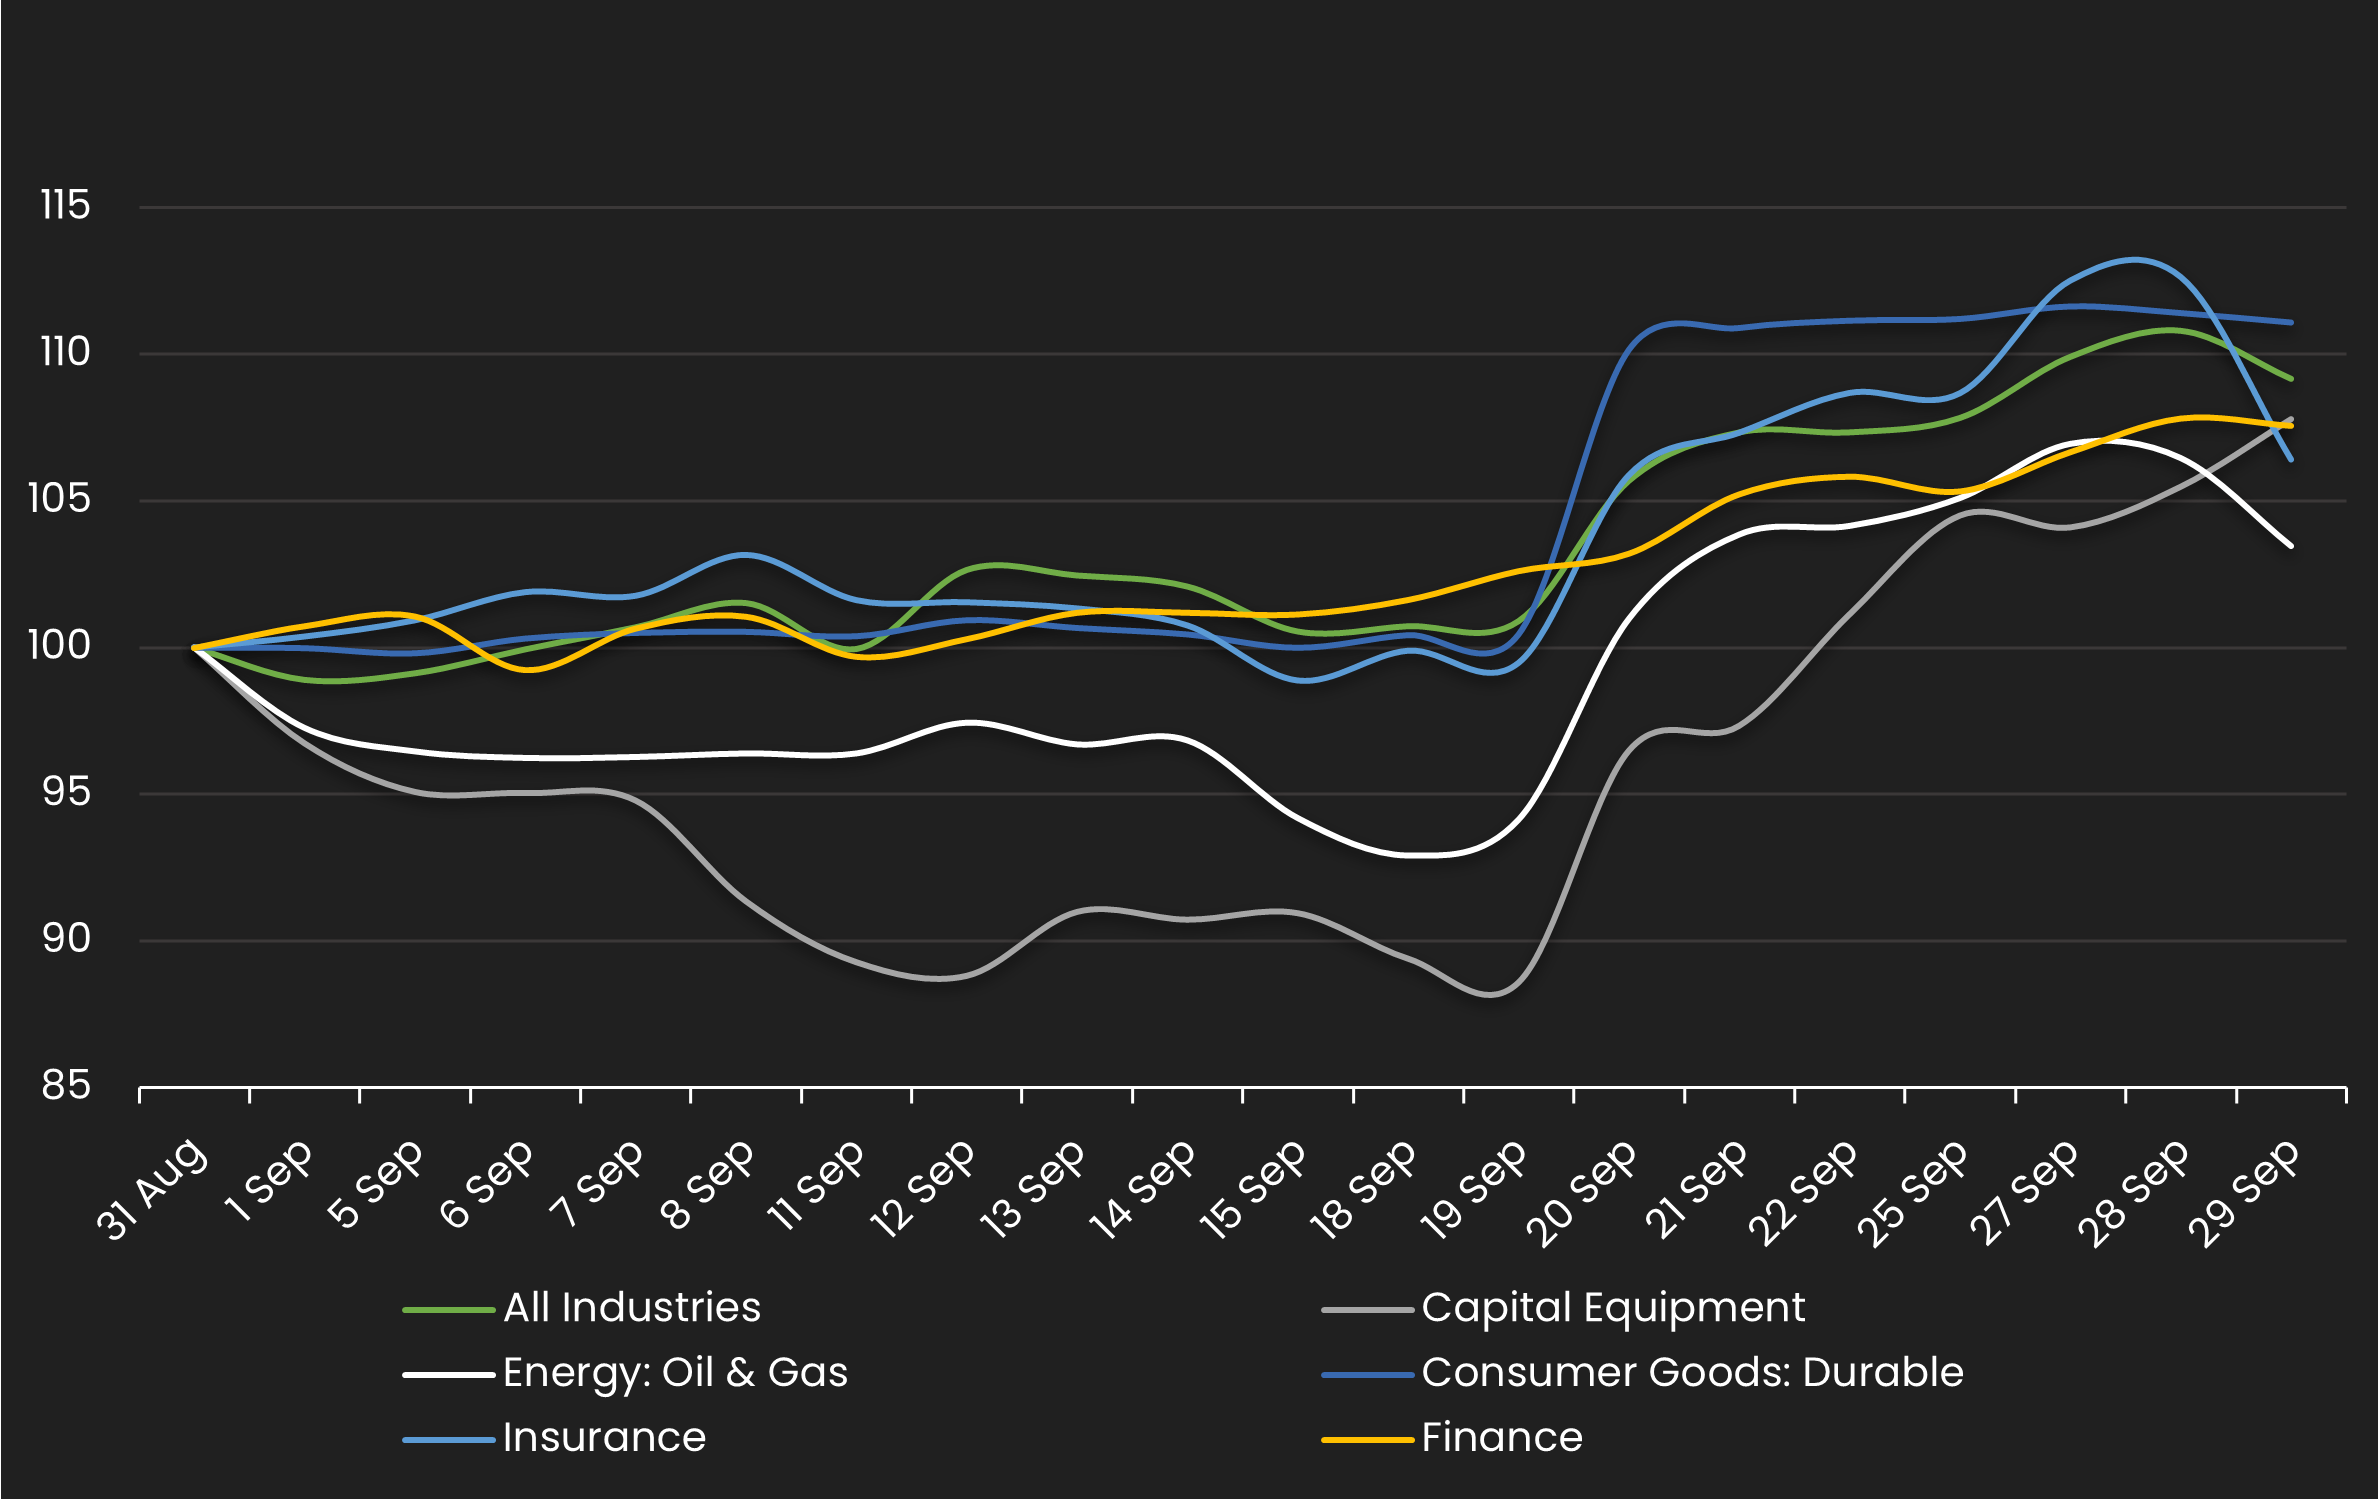
IG Spread by Industries – Monthly Comparison
Exhibits the IG spread by industry for the month ending 8/31/23 vs. the month ending 9/30/23
| INDUSTRIES | PREVIOUS SPREAD | CURRENT SPREAD | BPS CHANGE | MONTHLY PERFORMANCE | CDS COUNT |
|---|---|---|---|---|---|
| All Industries | 61 | 66 | 6 | Wider | 530 |
| Capital Equipment | 71 | 76 | 5 | Wider | 11 |
| Energy: Oil & Gas | 71 | 73 | 2 | Wider | 29 |
| Consumer Goods: Durable | 49 | 55 | 5 | Wider | 6 |
| Insurance | 50 | 53 | 3 | Wider | 27 |
| Finance | 69 | 74 | 5 | Wider | 42 |
Stay up-to-date with monthly summaries.
Related Resources
About SOLVE
SOLVE is the leading market data platform provider for fixed-income securities, trusted by sophisticated buy-side and sell-side firms worldwide. Founded in 2011, SOLVE leverages its AI-driven technology and deep industry expertise to offer unparalleled transparency into markets, reduce risk, and save hundreds of hours across front-office workflows. With the largest real-time datasets for Securitized Products, Municipal Bonds, Corporate Bonds, Syndicated Bank Loans, Convertible Bonds, CDS, and Private Credit, SOLVE empowers clients to transform the way they bring new securities to market, trade on secondary markets, and value highly illiquid securities. Headquartered in Connecticut, with offices across the globe, SOLVE is the definitive source for market pricing in fixed-income markets.
