Investment Grade CDS Market Summary – October 2024
GET OUR CDS MARKET SUMMARIES STRAIGHT TO YOUR INBOX. LEARN MORE
Investment Grade CDS Market October 2024
Our newsletter presents key trends derived from observable Credit Default Swaps pricing data over a monthly period.
Top 10 Outperformers
Showcases the top 10 IG CDS “outperformers” based on the largest mid spread decreases between 10/1/24 – 10/31/24
| RANK | BOND NAME | ISSUER | % CHANGE | BPS CHANGE | SPRD | SPRD-1 MONTH | DEALERS |
|---|---|---|---|---|---|---|---|
| 1 | UUW 5Y | UNITED UTILS PLC | -28.4% | -20 | 51 | 71 | 5 |
| 2 | HMSOLN 5Y | HAMMERSON PLC | -21.1% | -12 | 47 | 59 | 3 |
| 3 | ERICB 5Y | TELEFONAKTIEBOLAGET LM ERICSSON | -19.3% | -16 | 65 | 81 | 4 |
| 4 | COFF 5Y | CAPITAL ONE FINL CORP | -14.9% | -14 | 79 | 93 | 5 |
| 5 | TJX 5Y | TJX COS INC NEW | -12.3% | -7 | 50 | 57 | 2 |
| 6 | EXPE 5Y | EXPEDIA INC | -11.6% | -9 | 65 | 74 | 5 |
| 7 | FREGR 5Y | FRESENIUS SE & CO KGAA | -11.5% | -6 | 48 | 54 | 2 |
| 8 | BHP 5Y | BHP BILLITON PLC | -11.2% | -9 | 70 | 79 | 2 |
| 9 | DB 5Y | DEUTSCHE BK AG GLOBAL MEDIUM | -10.8% | -8 | 64 | 72 | 5 |
| 10 | UCGIM 5Y | UNICREDIT LUXEMBOURG FIN SA | -10.7% | -7 | 55 | 62 | 6 |
Top 10 Underperformers
Showcases the top 10 IG CDS “underperformers” based on the largest mid spread increases between 10/1/24 – 10/31/24
| RANK | BOND NAME | ISSUER | % CHANGE | BPS CHANGE | SPRD | SPRD-1 MONTH | DEALERS |
|---|---|---|---|---|---|---|---|
| 1 | VIVFP 5Y | SEAGRAM CO LTD | 47.2% | 30 | 92 | 63 | 5 |
| 2 | BBY 5Y | BEST BUY INC | 34.4% | 13 | 49 | 37 | 6 |
| 3 | INTC 5Y | INTEL | 20.3% | 13 | 80 | 66 | 6 |
| 4 | BAYGR 5Y | BAYER CORP | 19.7% | 15 | 91 | 76 | 5 |
| 5 | CAG 5Y | CONAGRA FOODS INC | 18.9% | 8 | 52 | 44 | 6 |
| 6 | SZUGR 5Y | SUEDZUCKER AG | 17.4% | 15 | 98 | 84 | 5 |
| 7 | CVS 5Y | CVS CAREMARK CORP | 17.3% | 10 | 70 | 60 | 6 |
| 8 | STERV 5Y | STORA ENSO CORP | 16.5% | 11 | 78 | 67 | 5 |
| 9 | DHI 5Y | D R HORTON INC | 16.4% | 8 | 56 | 48 | 4 |
| 10 | UHS 5Y | UNIVERSAL HEALTH SERVICES INC | 16.3% | 9.3 | 66 | 57 | 4 |
Normalized IG Spread by Region
Displays the IG CDS spread by region between 10/1/24 – 10/31/24 Results are based on 5 select regions, however, we offer data across 12 regions
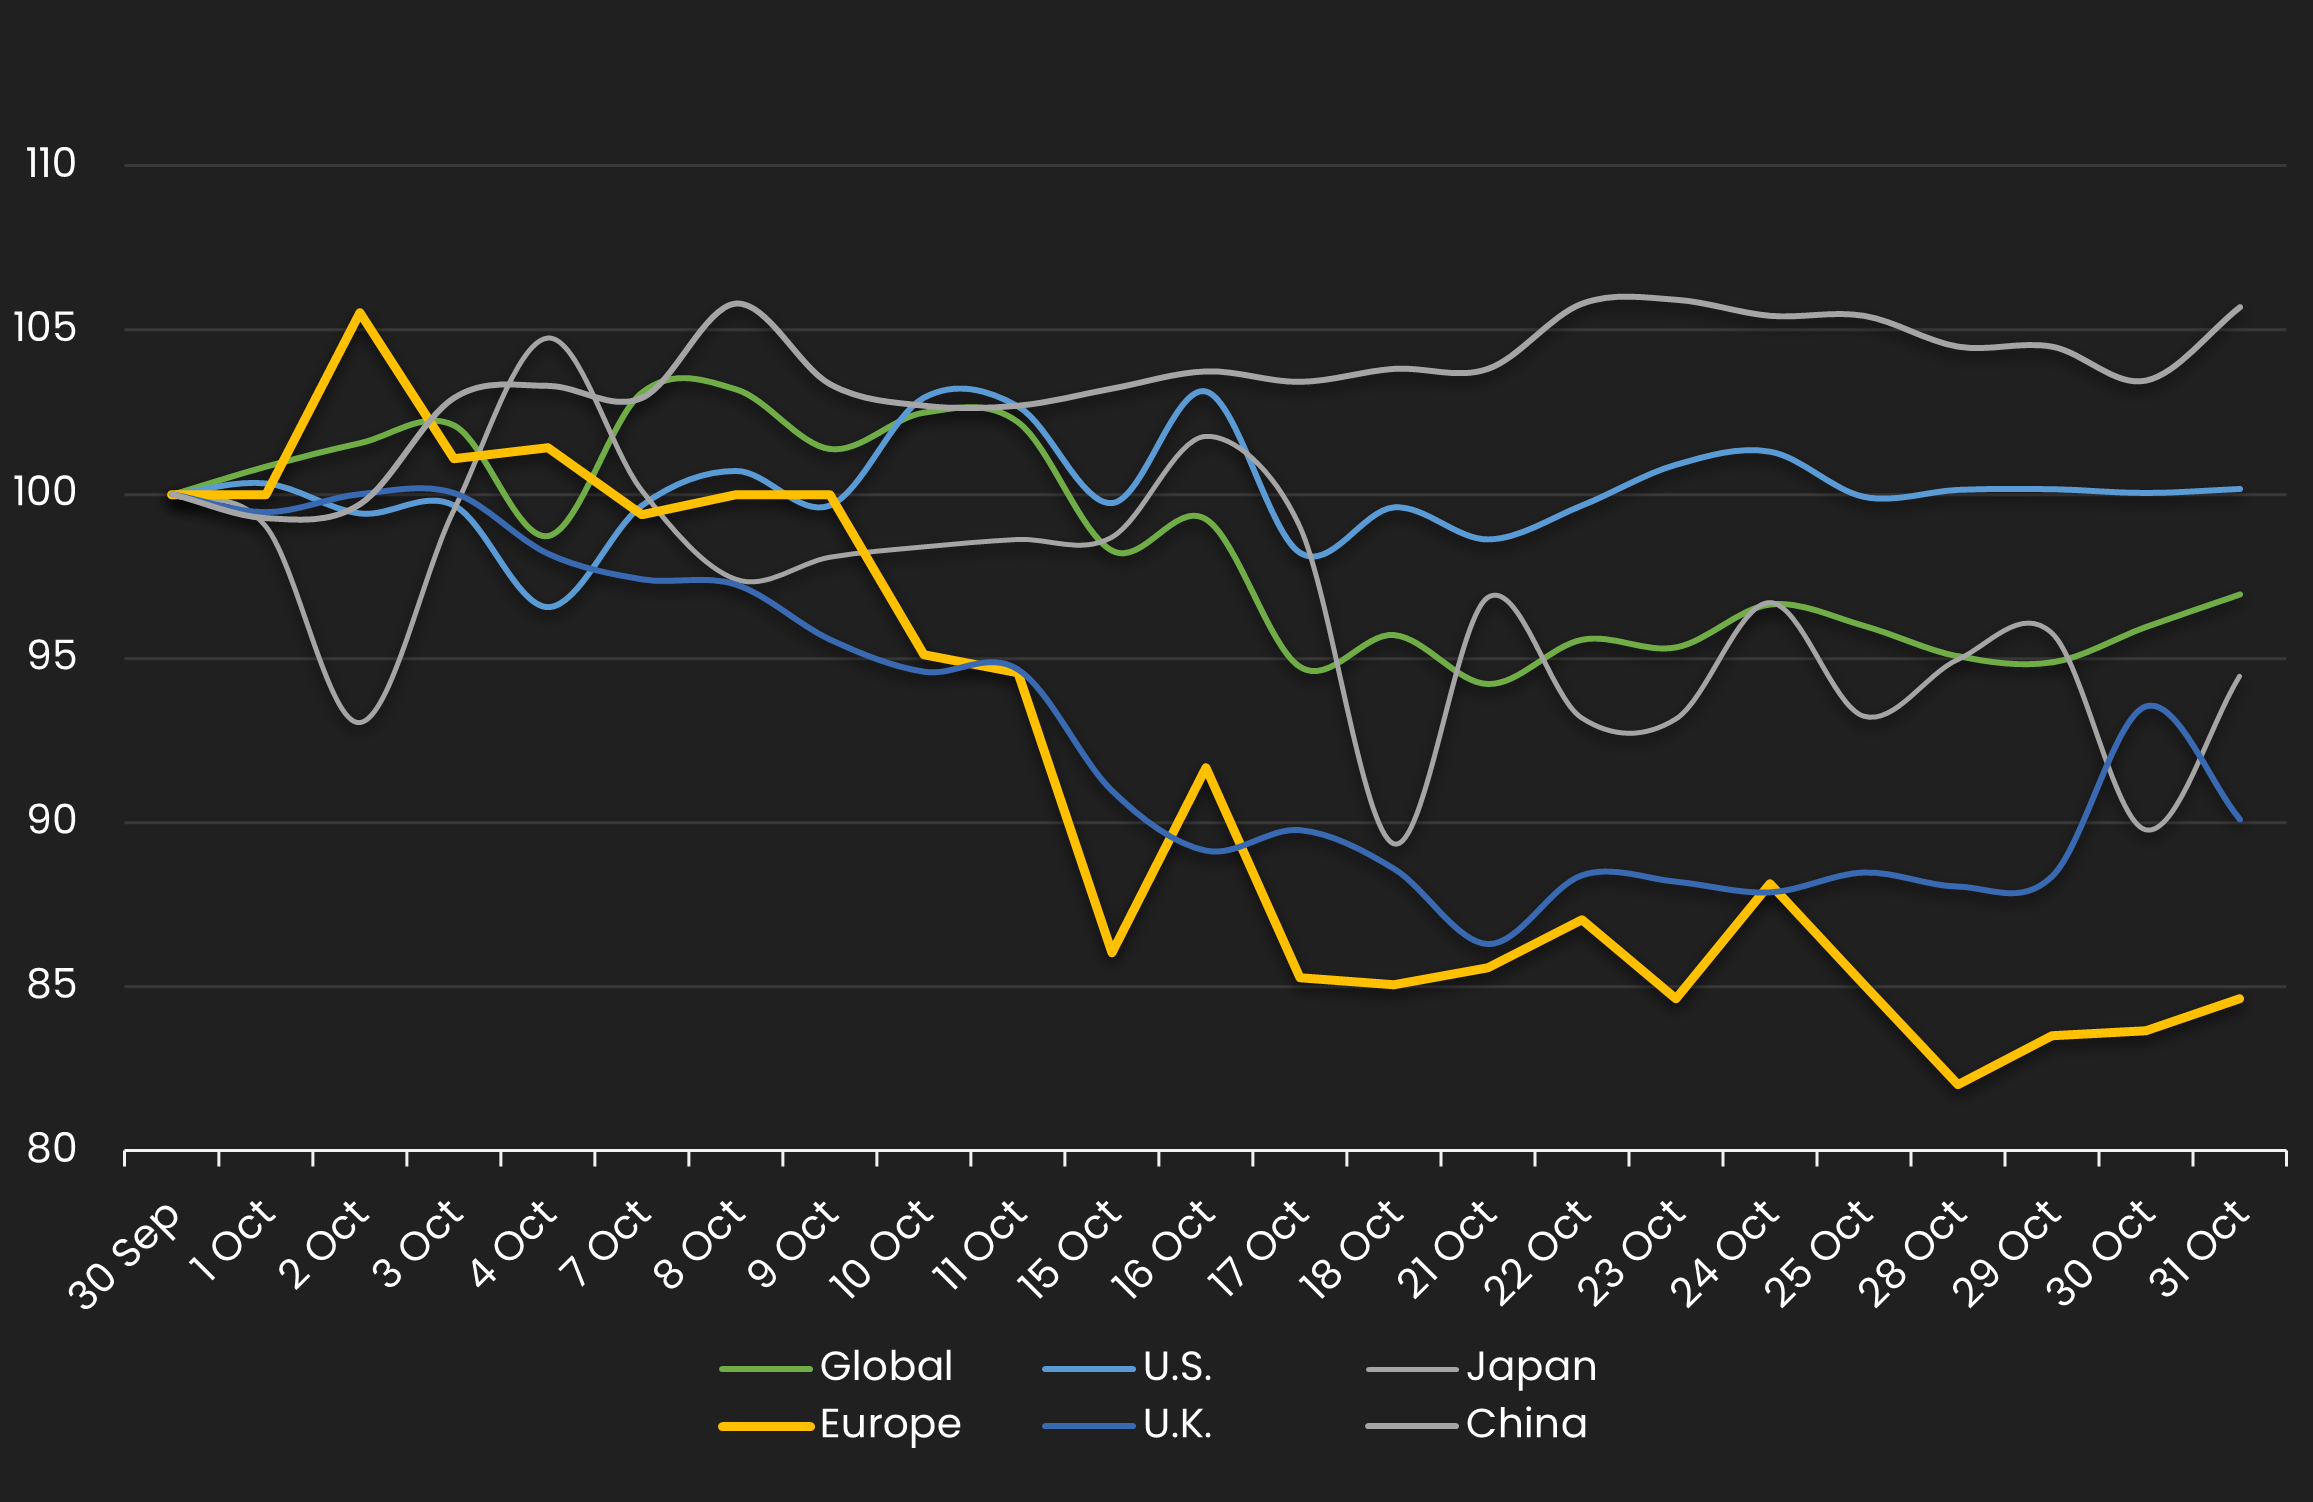
IG Spread by Region – Monthly Comparison
Exhibits the IG mid spread by region for the month ending 9/30/23 vs. the month ending 10/31/24
| REGION | PREVIOUS SPREAD | CURRENT SPREAD | BPS CHANGE | MONTHLY PERFORMANCE | CDS COUNT |
|---|---|---|---|---|---|
| Global | 51 | 49 | -2 | Tighter | 574 |
| U.S. | 48 | 48 | 0 | Wider | 237 |
| U.K. | 59 | 53 | -6 | Tighter | 41 |
| Canada | 60 | 61 | 1 | Wider | 12 |
| China | 61 | 65 | 4 | Wider | 9 |
| APAC | 47 | 50 | 3 | Wider | 42 |
Normalized IG Spread by Industry
Displays the IG CDS spread by industry between 10/1/24 – 10/31/24 Results are based on 5 select industry sectors, however, we offer data across 36 sectors
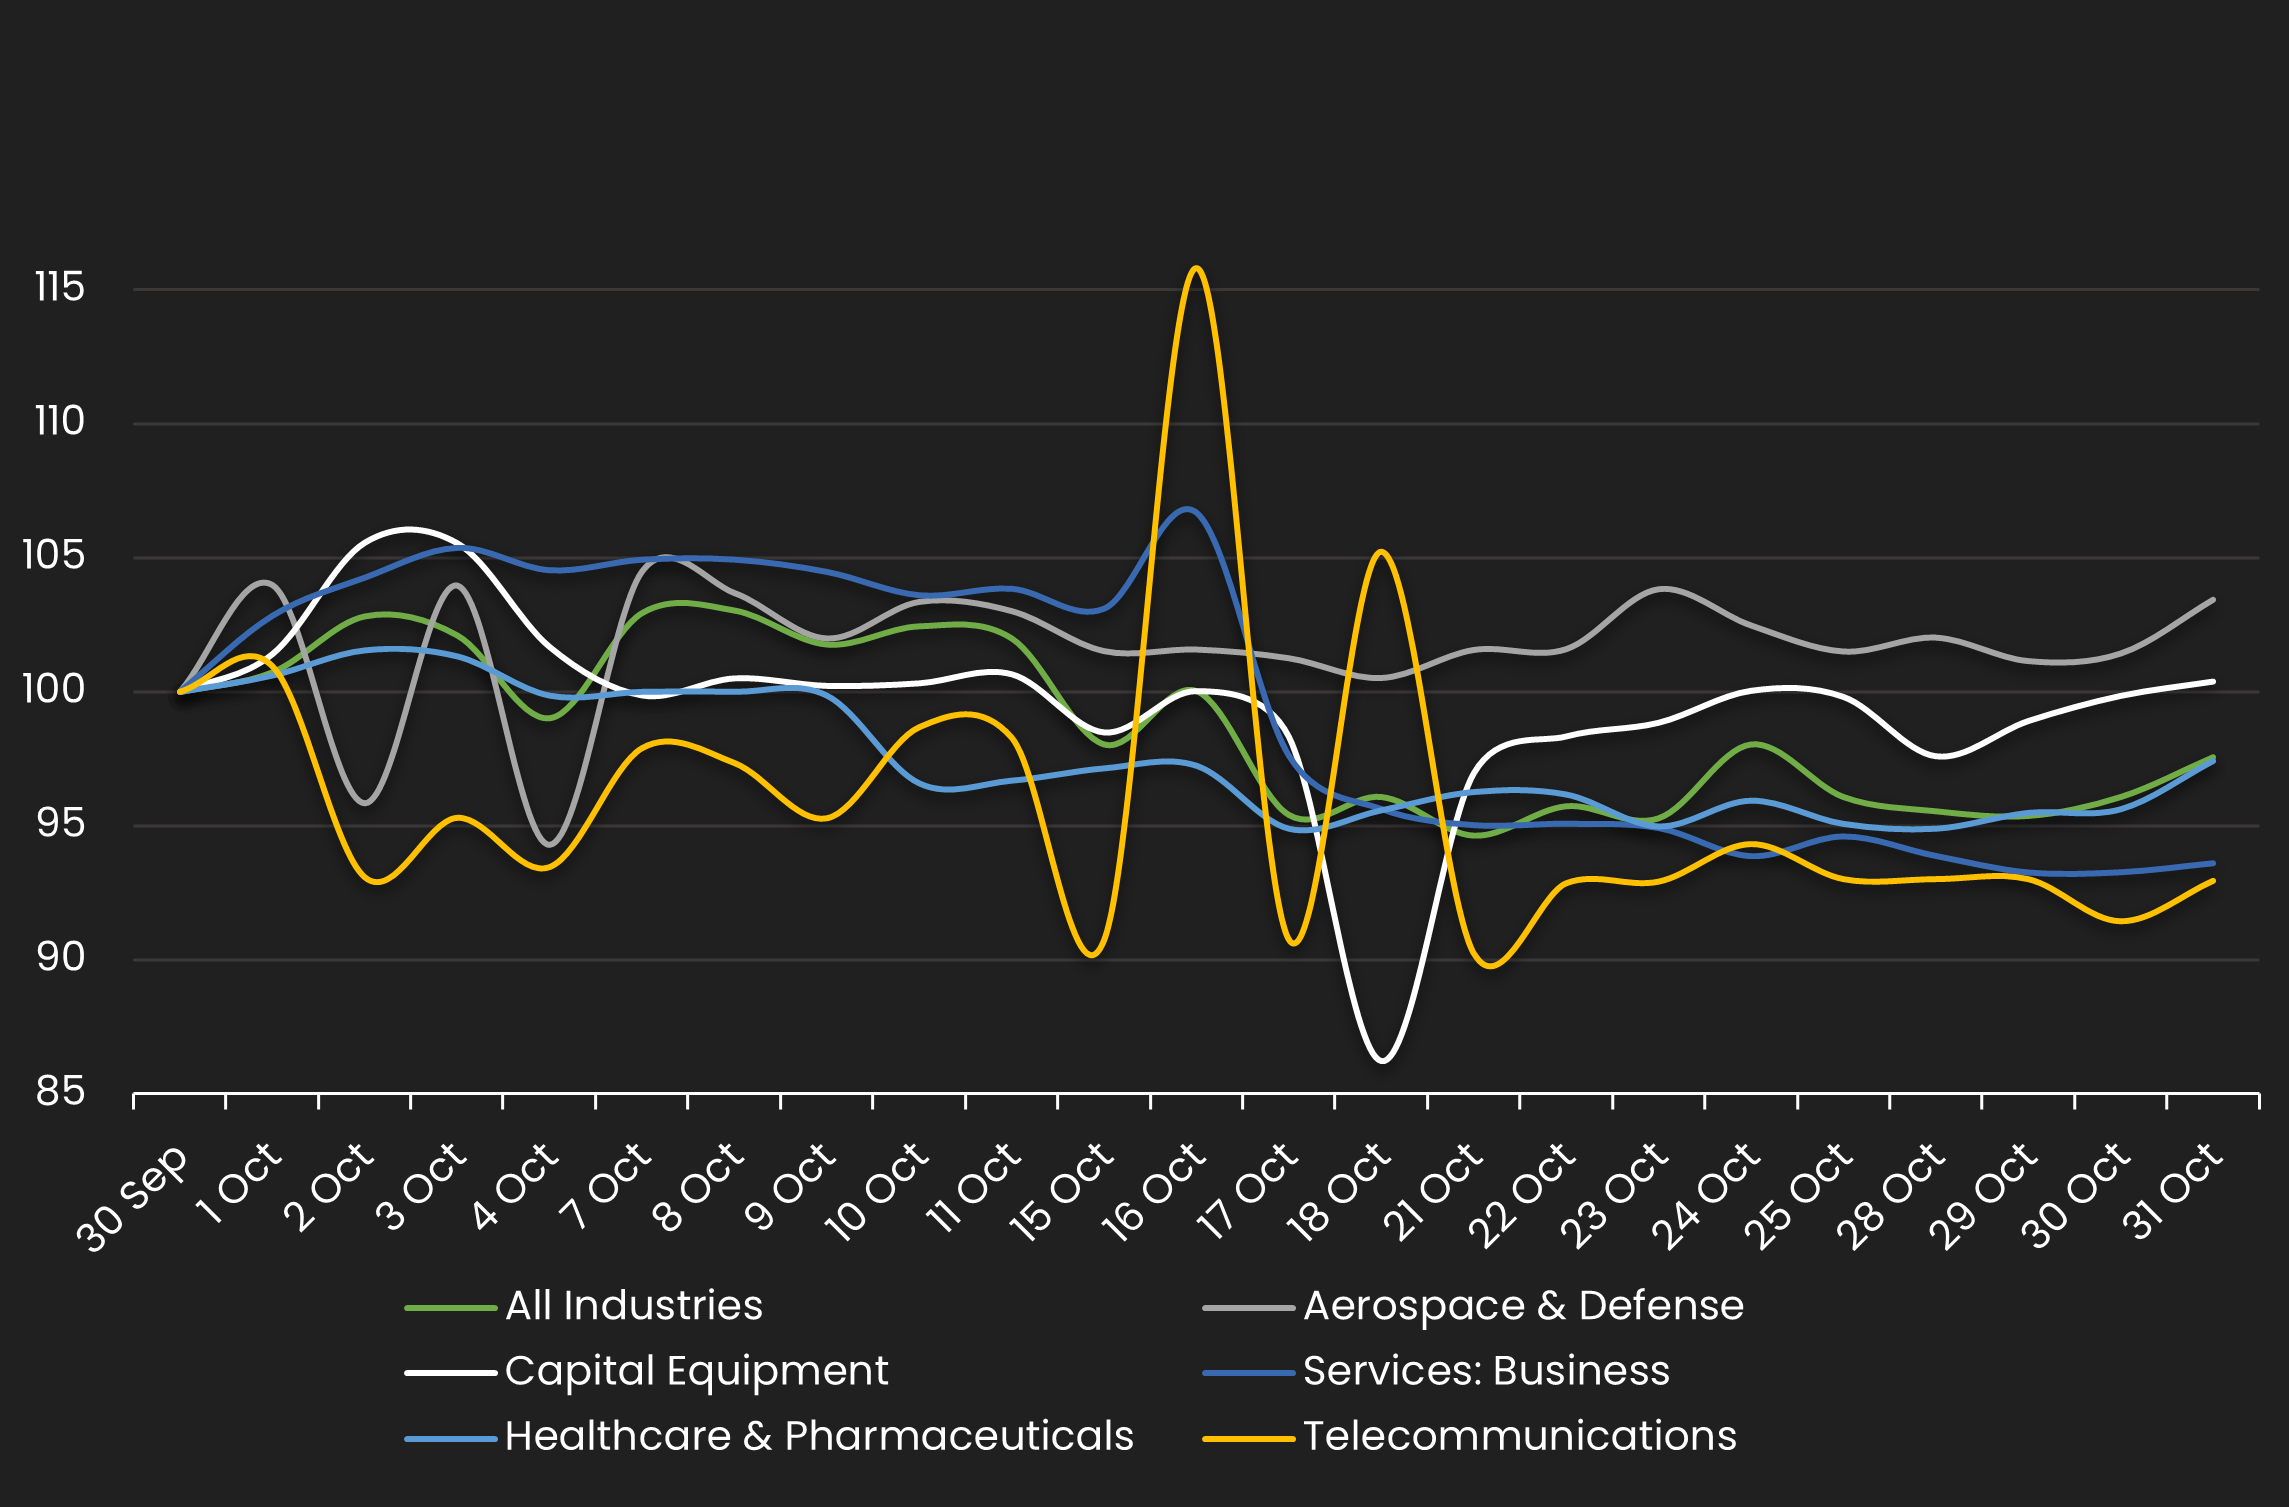
IG Spread by Industries – Monthly Comparison
Exhibits the IG spread by industry for the month ending 9/30/23 vs. the month ending 10/31/24
| INDUSTRIES | PREVIOUS SPREAD | CURRENT SPREAD | BPS CHANGE | MONTHLY PERFORMANCE | CDS COUNT |
|---|---|---|---|---|---|
| All Industries | 51 | 50 | -1 | Tighter | 577 |
| Aerospace & Defense | 36 | 38 | 1 | Wider | 11 |
| Capital Equipment | 59 | 60 | 0 | Wider | 11 |
| Services: Business | 83 | 77 | -5 | Tighter | 3 |
| Healthcare & Pharmaceuticals | 39 | 38 | -1 | Tighter | 31 |
| Telecommunications | 44 | 41 | -3 | Tighter | 32 |
Stay up-to-date with monthly summaries.
Related Resources
About SOLVE
SOLVE is the leading market data platform provider for fixed-income securities, trusted by sophisticated buy-side and sell-side firms worldwide. Founded in 2011, SOLVE leverages its AI-driven technology and deep industry expertise to offer unparalleled transparency into markets, reduce risk, and save hundreds of hours across front-office workflows. With the largest real-time datasets for Securitized Products, Municipal Bonds, Corporate Bonds, Syndicated Bank Loans, Convertible Bonds, CDS, and Private Credit, SOLVE empowers clients to transform the way they bring new securities to market, trade on secondary markets, and value highly illiquid securities. Headquartered in Connecticut, with offices across the globe, SOLVE is the definitive source for market pricing in fixed-income markets.
