Investment Grade CDS Market Summary – May 2023
GET OUR CDS MARKET SUMMARIES STRAIGHT TO YOUR INBOX. LEARN MORE
Investment Grade CDS Market Summary:May 2023
Our newsletter presents key trends derived from observable Credit Default Swaps pricing data over a monthly period.
Top 10 Outperformers
Showcases the top 10 IG CDS “outperformers” based on the largest mid spread decreases between 5/1/23 – 5/31/23
| RANK | BOND NAME | ISSUER | % CHANGE | BPS CHANGE | SPRD | SPRD-1 MONTH | DEALERS |
|---|---|---|---|---|---|---|---|
| 1 | KAWHI 5Y | KAWASAKI HEAVY INDUSTRIES LTD | -34.5% | -20 | 38 | 58 | 4 |
| 2 | CA 5Y | CA INC | -31.1% | -30 | 66 | 97 | 2 |
| 3 | ALOFP 5Y | ALSTOM SA | -29.4% | -53 | 128 | 182 | 7 |
| 4 | KOBSTL 5Y | KOBE STEEL LTD | -28.6% | -36 | 90 | 126 | 5 |
| 5 | CS 5Y | CREDIT SUISSE AG NEW YORK BRH | -26.9% | -46 | 124 | 169 | 3 |
| 6 | NIPSTL 5Y | SUMITOMO METAL INDUSTRIES LTD | -26.7% | -16 | 43 | 59 | 5 |
| 7 | JFEHLD 5Y | JFE HOLDINGS INC | -25.5% | -16 | 47 | 63 | 4 |
| 8 | VIVFP 5Y | SEAGRAM CO LTD | -21.8% | -28 | 101 | 130 | 7 |
| 9 | UBS HOLDCO 5Y | UBS AG LONDON BRH | -20.6% | -27 | 106 | 133 | 6 |
| 10 | MARSPE 5Y | MARKS & SPENCER PLC | -19.8% | -54 | 219 | 274 | 7 |
Top 10 Underperformers
Showcases the top 10 IG CDS “underperformers” based on the largest mid spread increases between 5/1/23 – 5/31/23
| RANK | BOND NAME | ISSUER | % CHANGE | BPS CHANGE | SPRD | SPRD-1 MONTH | DEALERS |
|---|---|---|---|---|---|---|---|
| 1 | LNGFOR 5Y | LONGFOR PPTYS CO LTD | 38.6% | 270 | 970 | 699 | 3 |
| 2 | NEM 5Y | NEWMONT MNG CORP | 28.2% | 13 | 61 | 48 | 3 |
| 3 | ASH 5Y | ASHLAND GLOBAL HOLDINGS | 28.2% | 28 | 129 | 101 | 4 |
| 4 | NWL 5Y | NEWELL RUBBERMAID INC MEDIUM | 28.2% | 108 | 492 | 384 | 3 |
| 5 | CBS 5Y | CBS INC | 23.2% | 49 | 263 | 213 | 5 |
| 6 | AZO 5Y | AUTOZONE INC | 19.7% | 8 | 48 | 40 | 5 |
| 7 | HRB 5Y | BLOCK FINL LLC | 18.0% | 19 | 122 | 103 | 3 |
| 8 | BAYGR 5Y | BAYER CORP | 16.0% | 12 | 84 | 72 | 7 |
| 9 | HON 5Y | ALLIED SIGNAL INC | 14.2% | 4 | 35 | 31 | 5 |
| 10 | ZIGGO 5Y | ZIGGO HOLDING BV | 13.5% | 59.8 | 502 | 442 | 4 |
Normalized IG Spread by Region
Displays the IG CDS spread by region between 5/1/23 – 5/31/23 Results are based on 5 select regions, however, we offer data across 12 regions
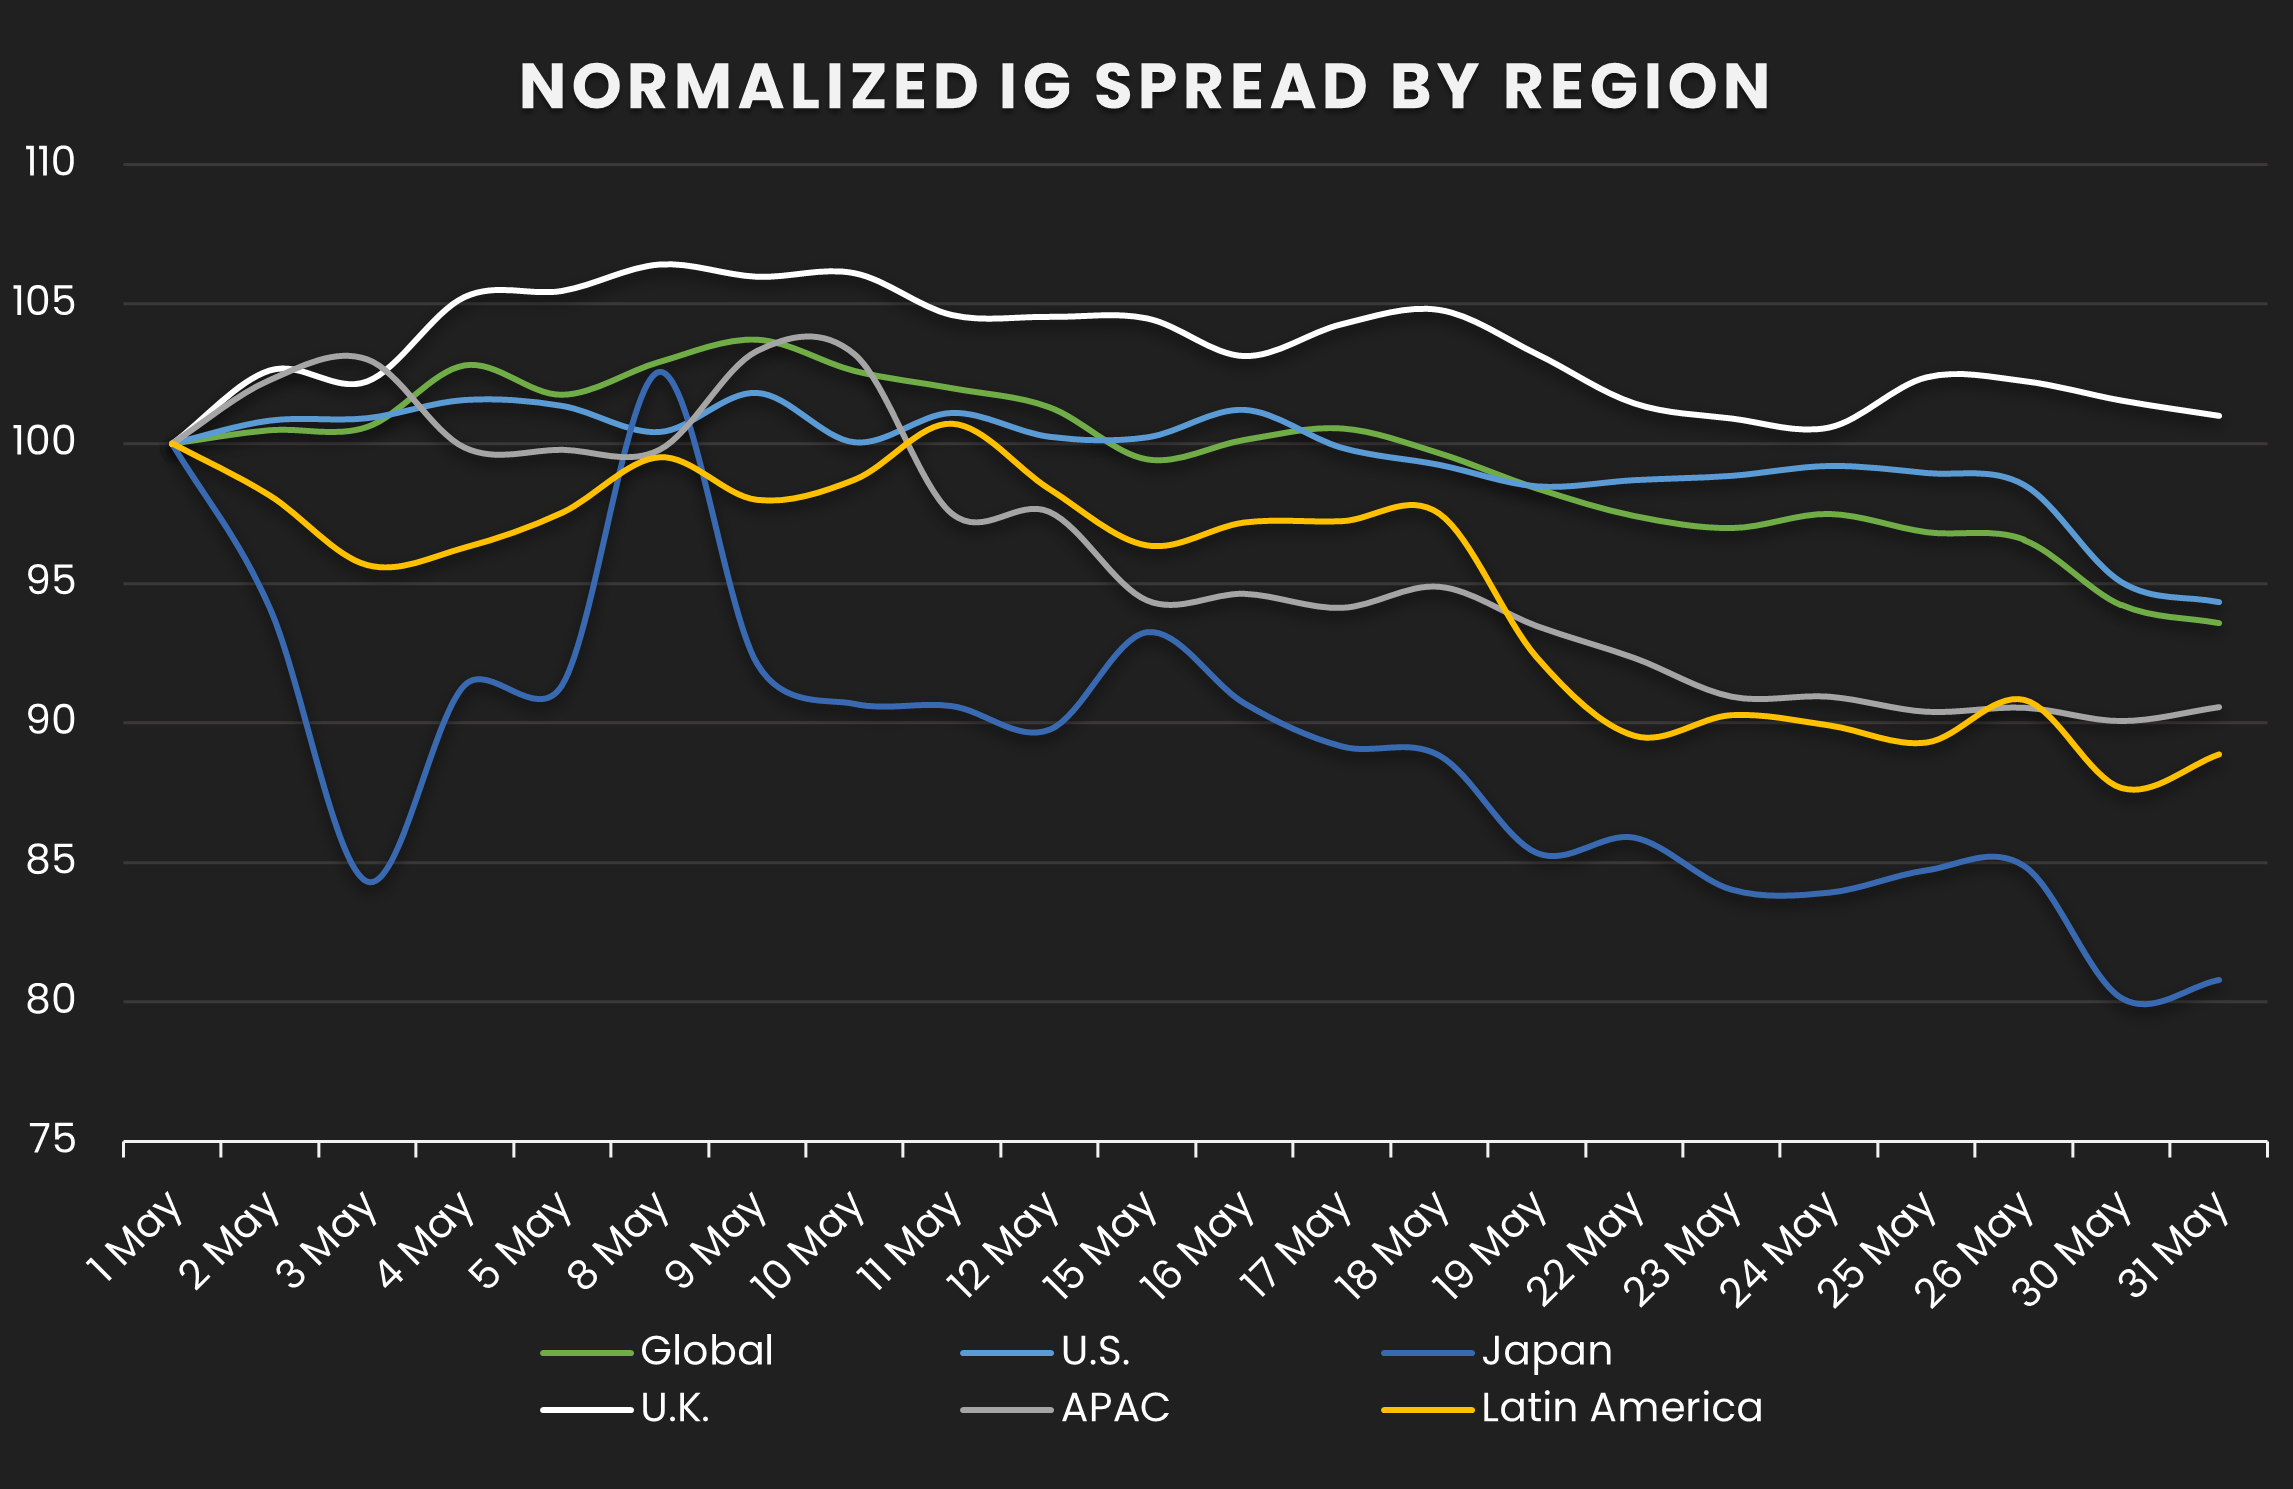
IG Spread by Region – Monthly Comparison
Exhibits the IG mid spread by region for the month ending 4/30/23 vs. the month ending 5/31/23
| REGION | PREVIOUS SPREAD | CURRENT SPREAD | BPS CHANGE | MONTHLY PERFORMANCE | CDS COUNT |
|---|---|---|---|---|---|
| Global | 72 | 68 | -5 | Tighter | 499 |
| U.S. | 71 | 67 | -4 | Tighter | 183 |
| Japan | 46 | 37 | -9 | Tighter | 38 |
| U.K. | 86 | 87 | 1 | Wider | 39 |
| APAC | 71 | 64 | -7 | Tighter | 38 |
| Latin America | 101 | 90 | -11 | Tighter | 10 |
Normalized IG Spread by Industry
Displays the IG CDS spread by industry between 5/1/23 – 5/31/23 Results are based on 5 select industry sectors, however, we offer data across 36 sectors
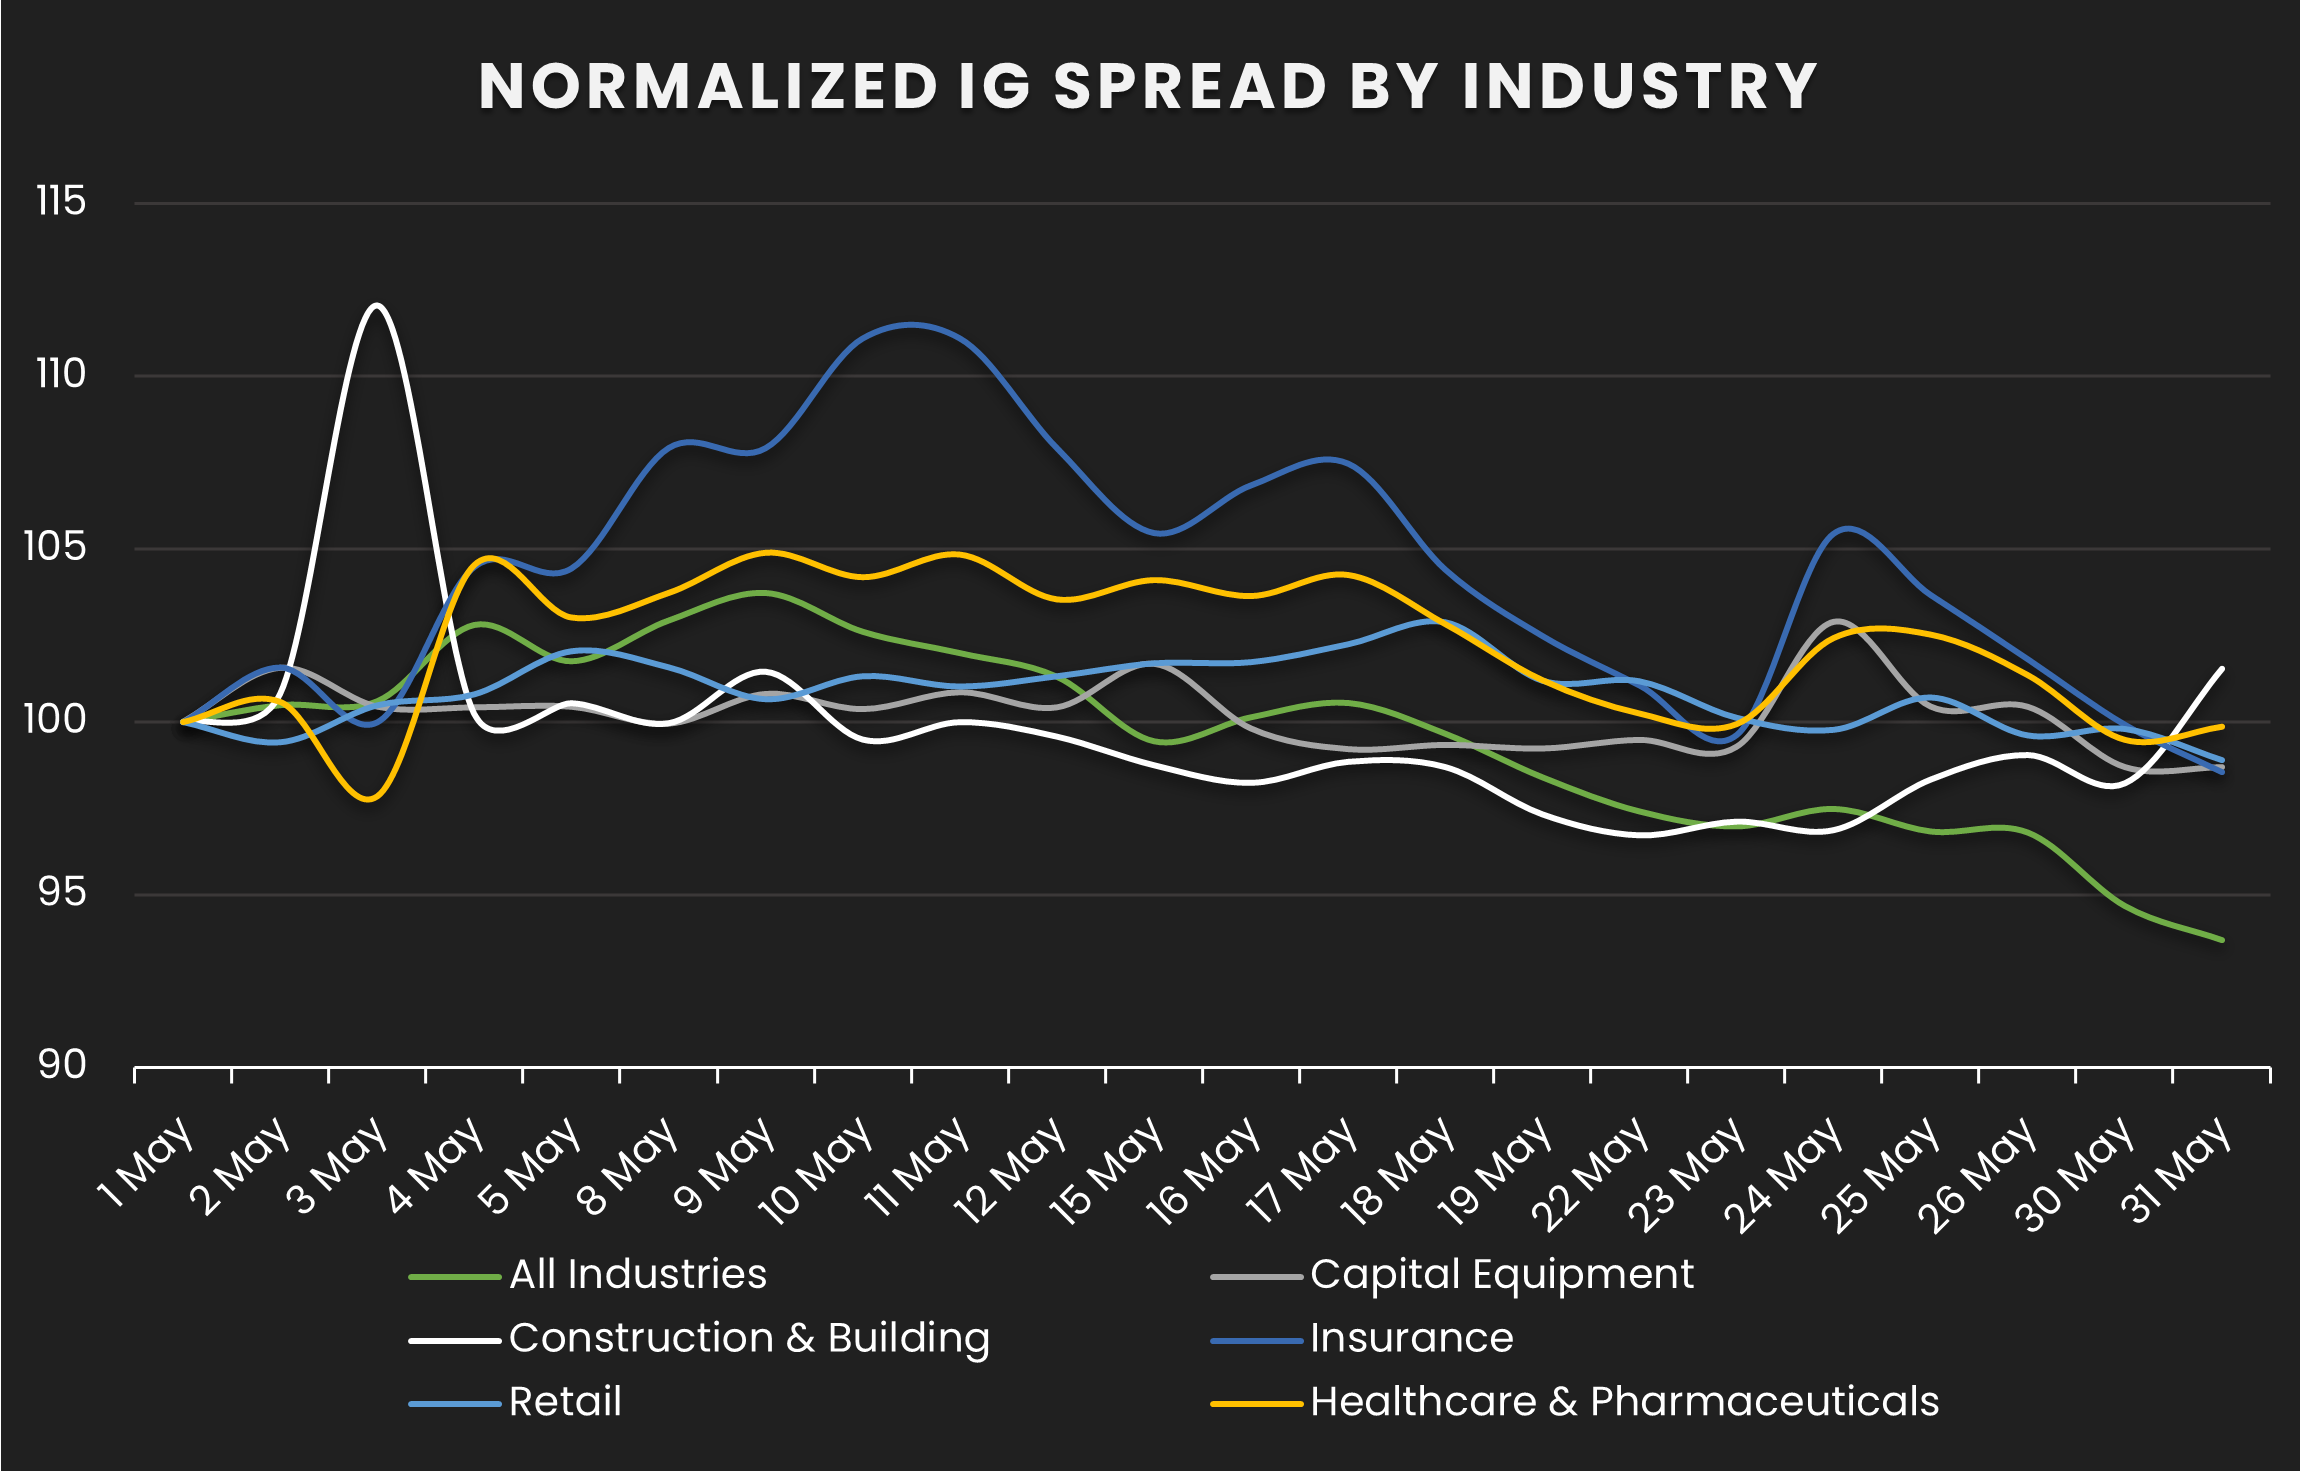
IG Spread by Industries – Monthly Comparison
Exhibits the IG spread by industry for the month ending 4/30/23 vs. the month ending 5/31/23
| INDUSTRIES | PREVIOUS SPREAD | CURRENT SPREAD | BPS CHANGE | MONTHLY PERFORMANCE | CDS COUNT |
|---|---|---|---|---|---|
| All Industries | 72 | 68 | -5 | Tighter | 500.00 |
| Capital Equipment | 71 | 70 | -1 | Tighter | 11.00 |
| Construction & Building | 62 | 63 | 1 | Wider | 10.00 |
| Insurance | 63 | 62 | -1 | Tighter | 25.00 |
| Retail | 54 | 53 | -1 | Tighter | 22.00 |
| Healthcare & Pharmaceuticals | 45 | 44 | -1 | Tighter | 25.00 |
Stay up-to-date with monthly summaries.
Related Resources
About SOLVE
SOLVE is the leading market data platform provider for fixed-income securities, trusted by sophisticated buy-side and sell-side firms worldwide. Founded in 2011, SOLVE leverages its AI-driven technology and deep industry expertise to offer unparalleled transparency into markets, reduce risk, and save hundreds of hours across front-office workflows. With the largest real-time datasets for Securitized Products, Municipal Bonds, Corporate Bonds, Syndicated Bank Loans, Convertible Bonds, CDS, and Private Credit, SOLVE empowers clients to transform the way they bring new securities to market, trade on secondary markets, and value highly illiquid securities. Headquartered in Connecticut, with offices across the globe, SOLVE is the definitive source for market pricing in fixed-income markets.
