Investment Grade CDS Market Summary – March 2026
GET OUR CDS MARKET SUMMARIES STRAIGHT TO YOUR INBOX. LEARN MORE
Investment Grade CDS Market March 2026
Our newsletter presents key trends derived from observable Credit Default Swaps pricing data over a monthly period.
Top 10 Outperformers
Showcases the top 10 IG CDS “outperformers” based on the largest mid spread decreases between 3/1/26 – 3/31/26
| RANK | BOND NAME | ISSUER | % CHANGE | BPS CHANGE | SPRD | SPRD-1 MONTH | DEALERS |
|---|---|---|---|---|---|---|---|
| 1 | APA 5Y | APACHE CORP | -8.7% | -6 | 67 | 74 | 3 |
| 2 | DOW 5Y | DOW CAP B V | -8.6% | -10 | 103 | 112 | 4 |
| 3 | HRB 5Y | BLOCK FINL LLC | -8.3% | -12 | 131 | 143 | 6 |
| 4 | CE 5Y | CELANESE CORP | -7.7% | -21 | 253 | 274 | 2 |
| 5 | TJX 5Y | TJX COS INC NEW | -6.6% | -3 | 48 | 51 | 2 |
| 6 | SWIRE 5Y | SWIRE PACIFIC LTD | -6.3% | -5 | 82 | 88 | 3 |
| 7 | LNC 5Y | JEFFERSON-PILOT CAP TR B | -3.0% | -5 | 165 | 170 | 5 |
| 8 | SWEMAT 5Y | SWEDISH MATCH AB | -2.6% | -2 | 88 | 90 | 2 |
| 9 | SZUGR 5Y | SUEDZUCKER AG | -2.4% | -4 | 161 | 165 | 4 |
| 10 | CMS 5Y | CMS ENERGY CORP | -1.9% | -1 | 52 | 53 | 2 |
Top 10 Underperformers
Showcases the top 10 IG CDS “underperformers” based on the largest mid spread increases between 3/1/26 – 3/31/26
| RANK | BOND NAME | ISSUER | % CHANGE | BPS CHANGE | SPRD | SPRD-1 MONTH | DEALERS |
|---|---|---|---|---|---|---|---|
| 1 | MITTOA 5Y | MITSUI CHEMICALS INC | 73.2% | 22 | 52 | 30 | 4 |
| 2 | SUMICH 5Y | SUMITOMO CHEMICAL CO LTD | 71.9% | 23 | 56 | 32 | 3 |
| 3 | BASGR 5Y | ENGELHARD CORP | 51.7% | 22 | 65 | 43 | 4 |
| 4 | HENKEL 5Y | HENKEL AG & CO KGAA | 45.4% | 12 | 38 | 26 | 4 |
| 5 | KOREAT 5Y | KT CORP MEDIUM TERM NTS BOOK | 44.5% | 12 | 39 | 27 | 2 |
| 6 | HEIGR 5Y | STARDUST FINANCE HOLDINGS INC | 43.5% | 28 | 92 | 64 | 3 |
| 7 | GIS 5Y | GENERAL MLS INC | 42.0% | 21 | 72 | 51 | 5 |
| 8 | FRTUM 5Y | FORTUM OYJ | 41.0% | 16 | 55 | 39 | 3 |
| 9 | CONTI 5Y | CONTI-GUMMI FIN B V | 40.6% | 26 | 91 | 65 | 3 |
| 10 | CNALN 5Y | CENTRICA PLC | 37.9% | 16.5 | 60 | 44 | 4 |
Normalized IG Spread by Region
Displays the IG CDS spread by region between 3/1/26 – 3/31/26 Results are based on select regions, however, we offer data across 12 regions
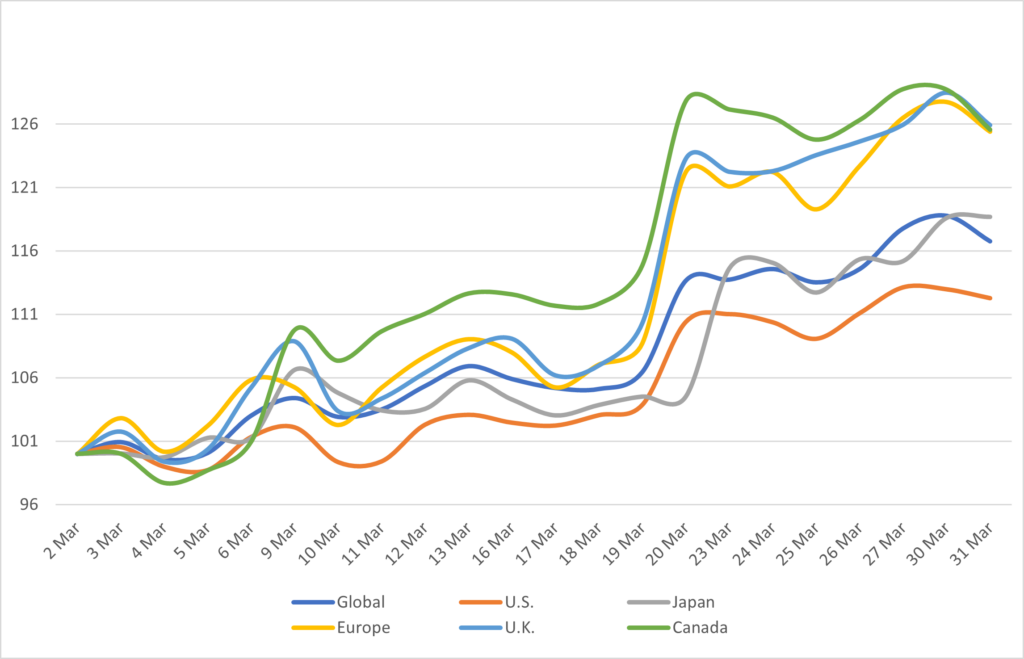
IG Spread by Region – Monthly Comparison
Exhibits the IG mid spread by region for the month ending 2/28/26 vs. the month ending 3/31/26
| REGION | PREVIOUS SPREAD | CURRENT SPREAD | BPS CHANGE | MONTHLY PERFORMANCE | CDS COUNT |
|---|---|---|---|---|---|
| Global | 48 | 56 | 8 | Wider | 623 |
| U.S. | 49 | 55 | 6 | Wider | 258 |
| Japan | 34 | 40 | 6 | Wider | 39 |
| Europe | 45 | 56 | 11 | Wider | 157 |
| U.K. | 51 | 64 | 13 | Wider | 42 |
| Canada | 48 | 60 | 12 | Wider | 10 |
Normalized IG Spread by Industry
Displays the IG CDS spread by industry between 3/1/26 – 3/31/26 Results are based on select industry sectors, however, we offer data across 36 sectors
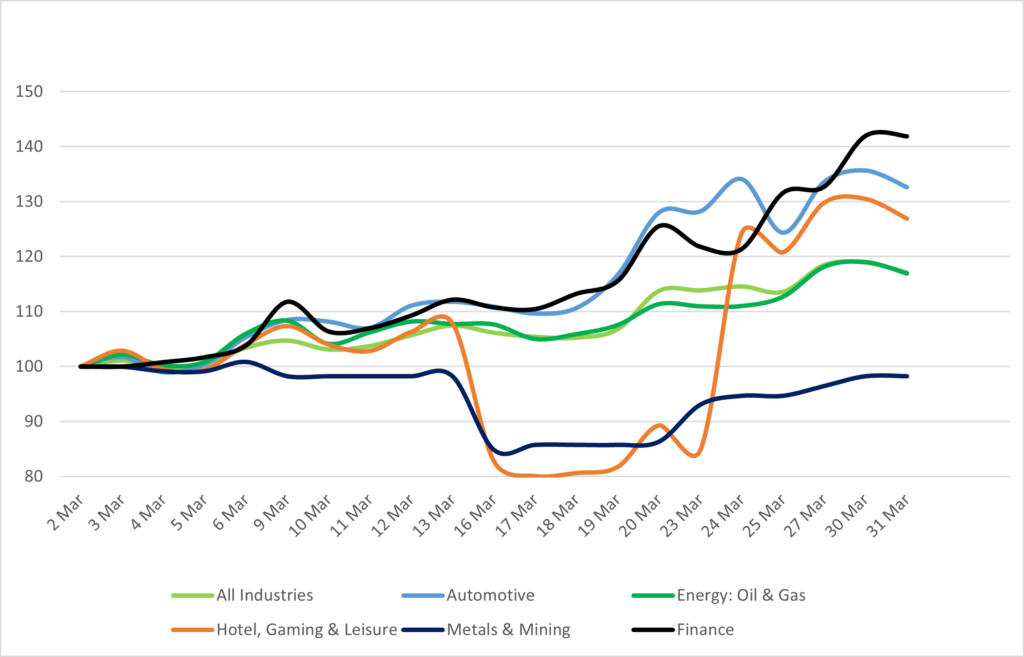
IG Spread by Industries – Monthly Comparison
Exhibits the IG spread by industry for the month ending 2/28/26 vs. the month ending 3/31/26
| INDUSTRIES | PREVIOUS SPREAD | CURRENT SPREAD | BPS CHANGE | MONTHLY PERFORMANCE | CDS COUNT |
|---|---|---|---|---|---|
| All Industries | 48 | 56 | 8 | Wider | 628.00 |
| Automotive | 50 | 66 | 16 | Wider | 12.00 |
| Energy: Oil & Gas | 50 | 59 | 8 | Wider | 36.00 |
| Hotel, Gaming & Leisure | 61 | 77 | 16 | Wider | 6.00 |
| Metals & Mining | 56 | 55 | -1 | Tighter | 22.00 |
| Finance | 48 | 67 | 20 | Wider | 48.00 |
Stay up-to-date with monthly summaries.
Related Resources
About SOLVE
SOLVE is the leading market data platform provider for fixed-income securities, trusted by sophisticated buy-side and sell-side firms worldwide. Founded in 2011, SOLVE leverages its AI-driven technology and deep industry expertise to offer unparalleled transparency into markets, reduce risk, and save hundreds of hours across front-office workflows. With the largest real-time datasets for Securitized Products, Municipal Bonds, Corporate Bonds, Syndicated Bank Loans, Convertible Bonds, CDS, and Private Credit, SOLVE empowers clients to transform the way they bring new securities to market, trade on secondary markets, and value highly illiquid securities. Headquartered in Connecticut, with offices across the globe, SOLVE is the definitive source for market pricing in fixed-income markets.
