Investment Grade CDS Market Summary – June 2025
GET OUR CDS MARKET SUMMARIES STRAIGHT TO YOUR INBOX. LEARN MORE
Investment Grade CDS Market June 2025
Our newsletter presents key trends derived from observable Credit Default Swaps pricing data over a monthly period.
Top 10 Outperformers
Showcases the top 10 IG CDS “outperformers” based on the largest mid spread decreases between 6/1/25 – 6/30/25
| RANK | BOND NAME | ISSUER | % CHANGE | BPS CHANGE | SPRD | SPRD-1 MONTH | DEALERS |
|---|---|---|---|---|---|---|---|
| 1 | EQH 5Y | AXA EQUITABLE HOLDINGS I | -45.0% | -45 | 55 | 100 | 2 |
| 2 | CA 5Y | CA INC | -35.6% | -36 | 65 | 101 | 2 |
| 3 | FREGR 5Y | FRESENIUS SE & CO KGAA | -20.5% | -17 | 67 | 85 | 4 |
| 4 | CLX 5Y | CLOROX CO | -19.3% | -16 | 66 | 82 | 2 |
| 5 | BAX 5Y | BAXTER INTL INC | -17.2% | -12 | 56 | 67 | 5 |
| 6 | HAOHUA 5Y | CNAC CENTURY HK CO LTD | -16.3% | -14 | 71 | 84 | 3 |
| 7 | DHI 5Y | D R HORTON INC | -16.2% | -11 | 57 | 68 | 5 |
| 8 | CVRD 5Y | INCO LTD | -15.7% | -15 | 79 | 94 | 2 |
| 9 | OVV 5Y | OVINTIV | -15.6% | -18 | 100 | 118 | 4 |
| 10 | TOL 5Y | TOLL BROS INC | -14.4% | -15 | 89 | 104 | 5 |
Top 10 Underperformers
Showcases the top 10 IG CDS “underperformers” based on the largest mid spread increases between 6/1/25 – 6/30/25
| RANK | BOND NAME | ISSUER | % CHANGE | BPS CHANGE | SPRD | SPRD-1 MONTH | DEALERS |
|---|---|---|---|---|---|---|---|
| 1 | AQUASM 5Y | FCC AQUALIA SA | 29.7% | 15 | 65 | 50 | 2 |
| 2 | CAFP 5Y | CARREFOUR SA | 27.3% | 20 | 94 | 74 | 4 |
| 3 | MDC 5Y | M.D.C. HOLDINGS, INC | 26.2% | 11 | 55 | 43 | 5 |
| 4 | NTT 5Y | NIPPON TELEG & TEL CORP | 23.4% | 8 | 42 | 34 | 3 |
| 5 | MMM 5Y | AVETA INC | 18.5% | 12 | 75 | 63 | 2 |
| 6 | STERV 5Y | STORA ENSO CORP | 11.6% | 9 | 86 | 77 | 4 |
| 7 | SUMIRD 5Y | SUMITOMO REALTY & DEVELOPMENT CO LTD | 10.8% | 4 | 39 | 36 | 3 |
| 8 | HAS 5Y | HASBRO INC | 10.7% | 10 | 100 | 90 | 2 |
| 9 | BA 5Y | BOEING CAP CORP INTERNOTES | 10.5% | 7 | 75 | 67 | 6 |
| 10 | OMC 5Y | OMNICOM GROUP INC | 10.4% | 3.8 | 40 | 36 | 5 |
Normalized IG Spread by Region
Displays the IG CDS spread by region between 6/1/25 – 6/30/25 Results are based on 5 select regions, however, we offer data across 12 regions
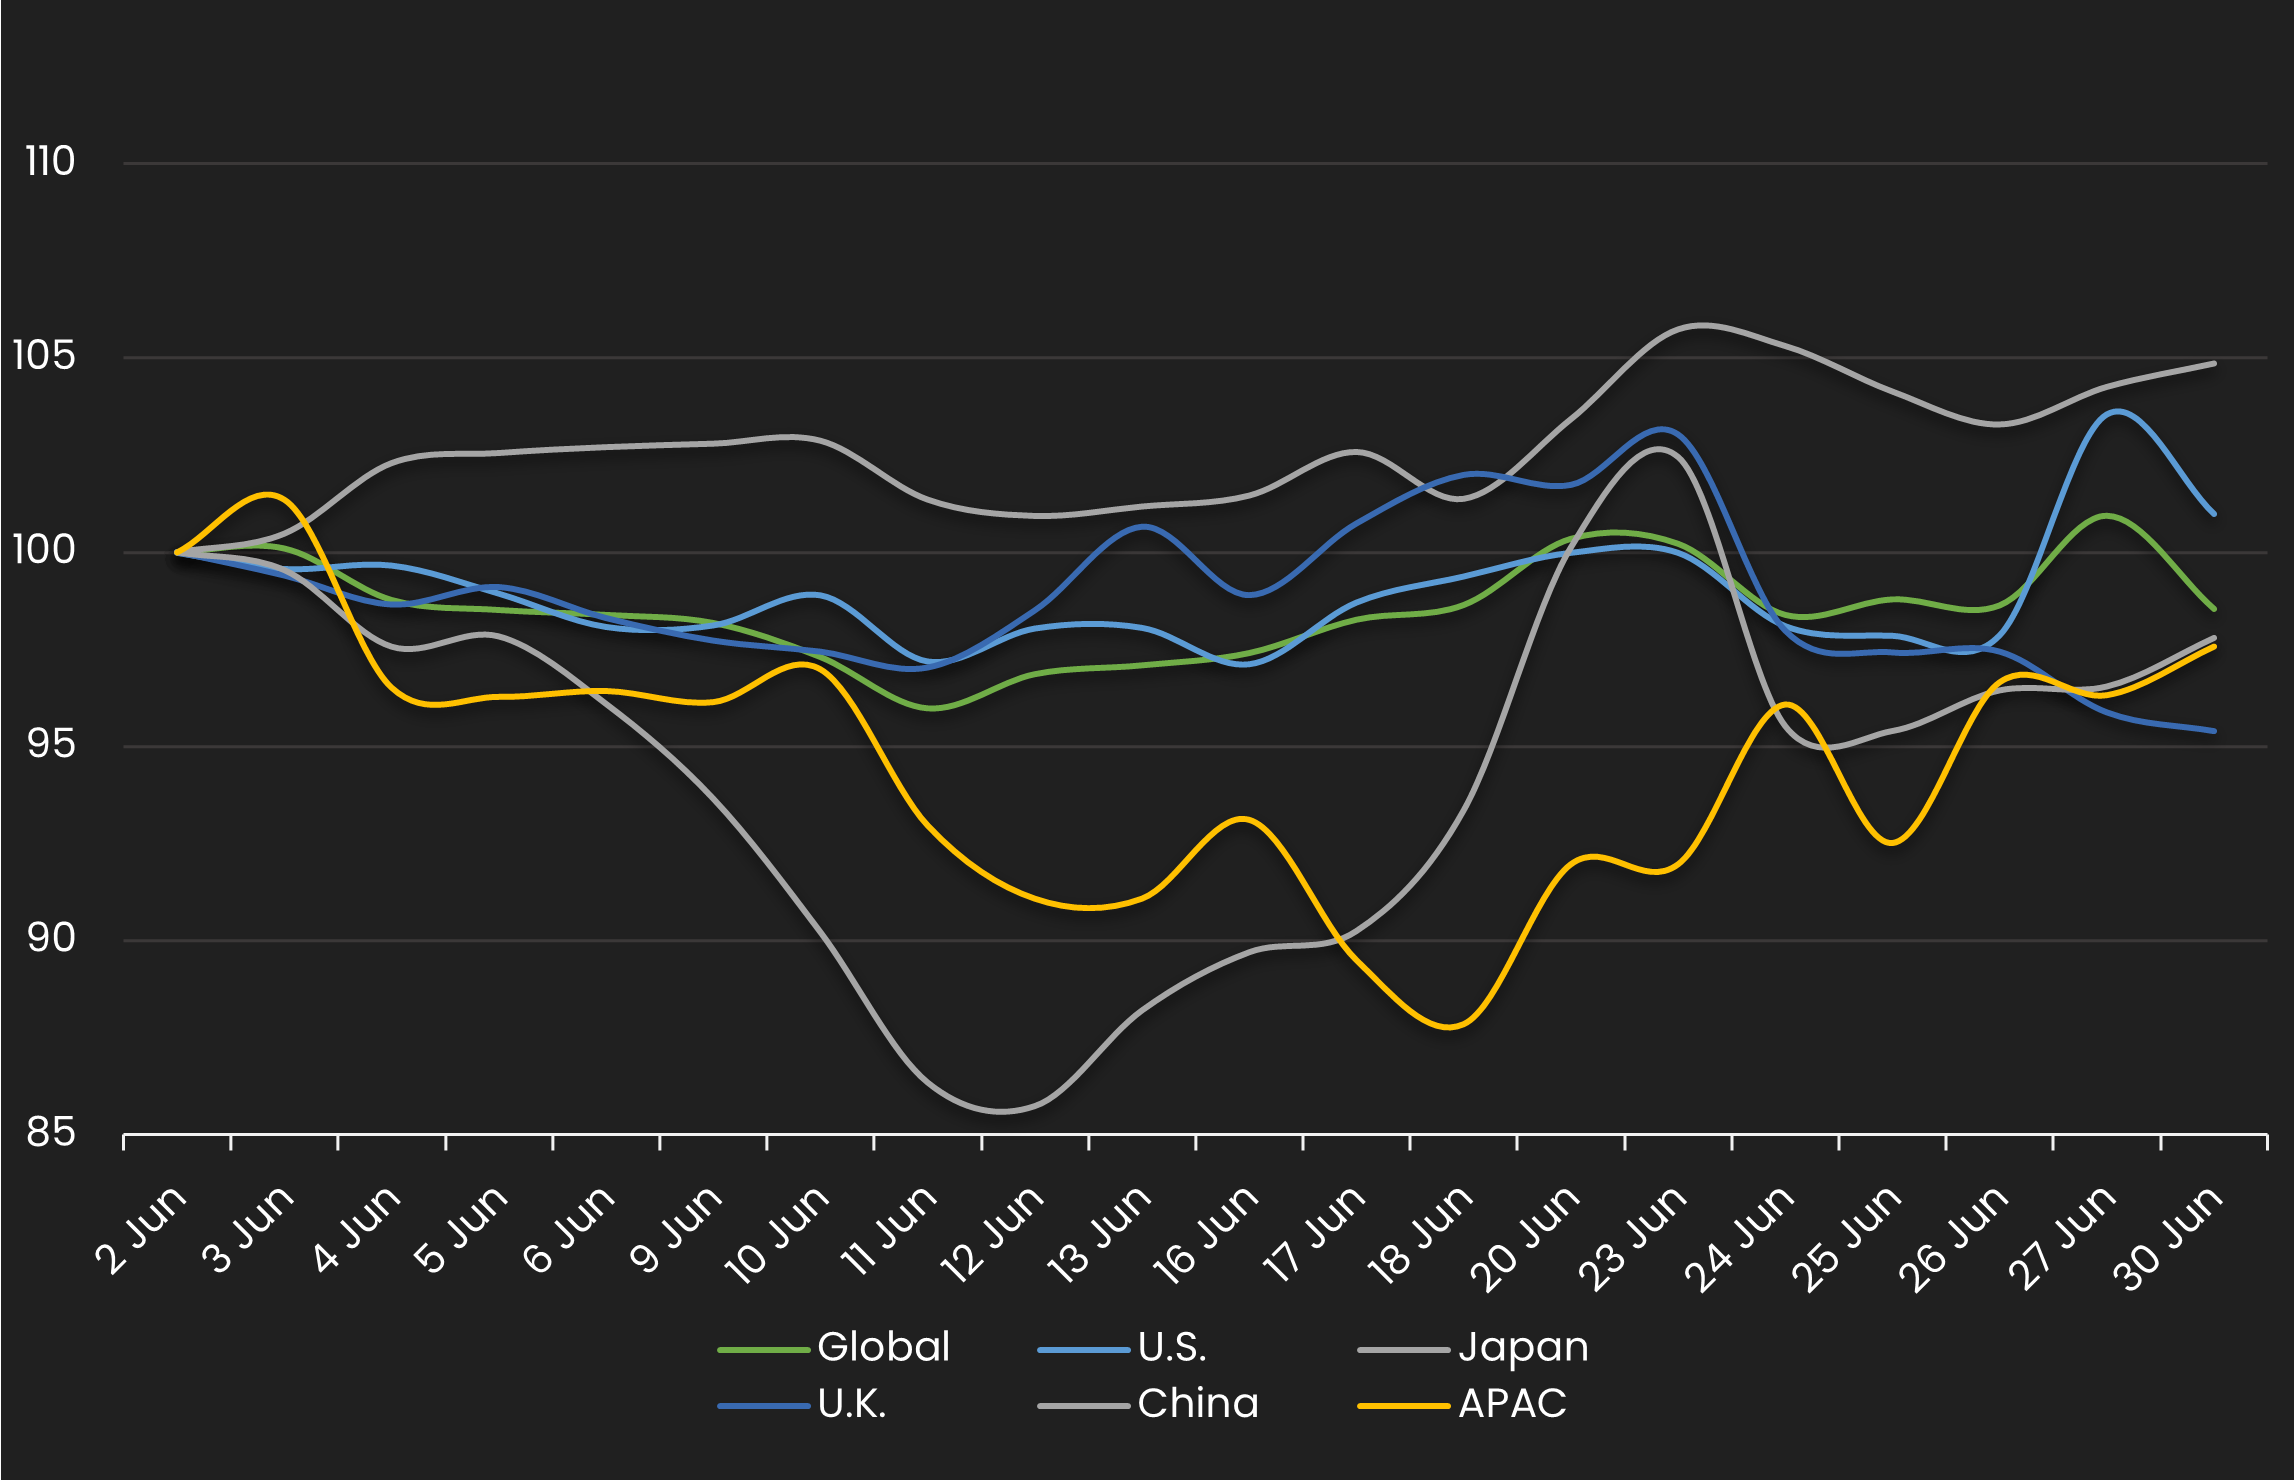
IG Spread by Region – Monthly Comparison
Exhibits the IG mid spread by region for the month ending 5/31/24 vs. the month ending 6/30/25
| REGION | PREVIOUS SPREAD | CURRENT SPREAD | BPS CHANGE | MONTHLY PERFORMANCE | CDS COUNT |
|---|---|---|---|---|---|
| Global | 51 | 50 | -1 | Tighter | 643 |
| U.S. | 50 | 51 | 1 | Wider | 289 |
| Japan | 34 | 36 | 2 | Wider | 38 |
| U.K. | 54 | 52 | -2 | Tighter | 40 |
| China | 53 | 52 | -1 | Tighter | 9 |
| APAC | 57 | 56 | -1 | Tighter | 42 |
Normalized IG Spread by Industry
Displays the IG CDS spread by industry between 6/1/25 – 6/30/25 Results are based on 5 select industry sectors, however, we offer data across 36 sectors
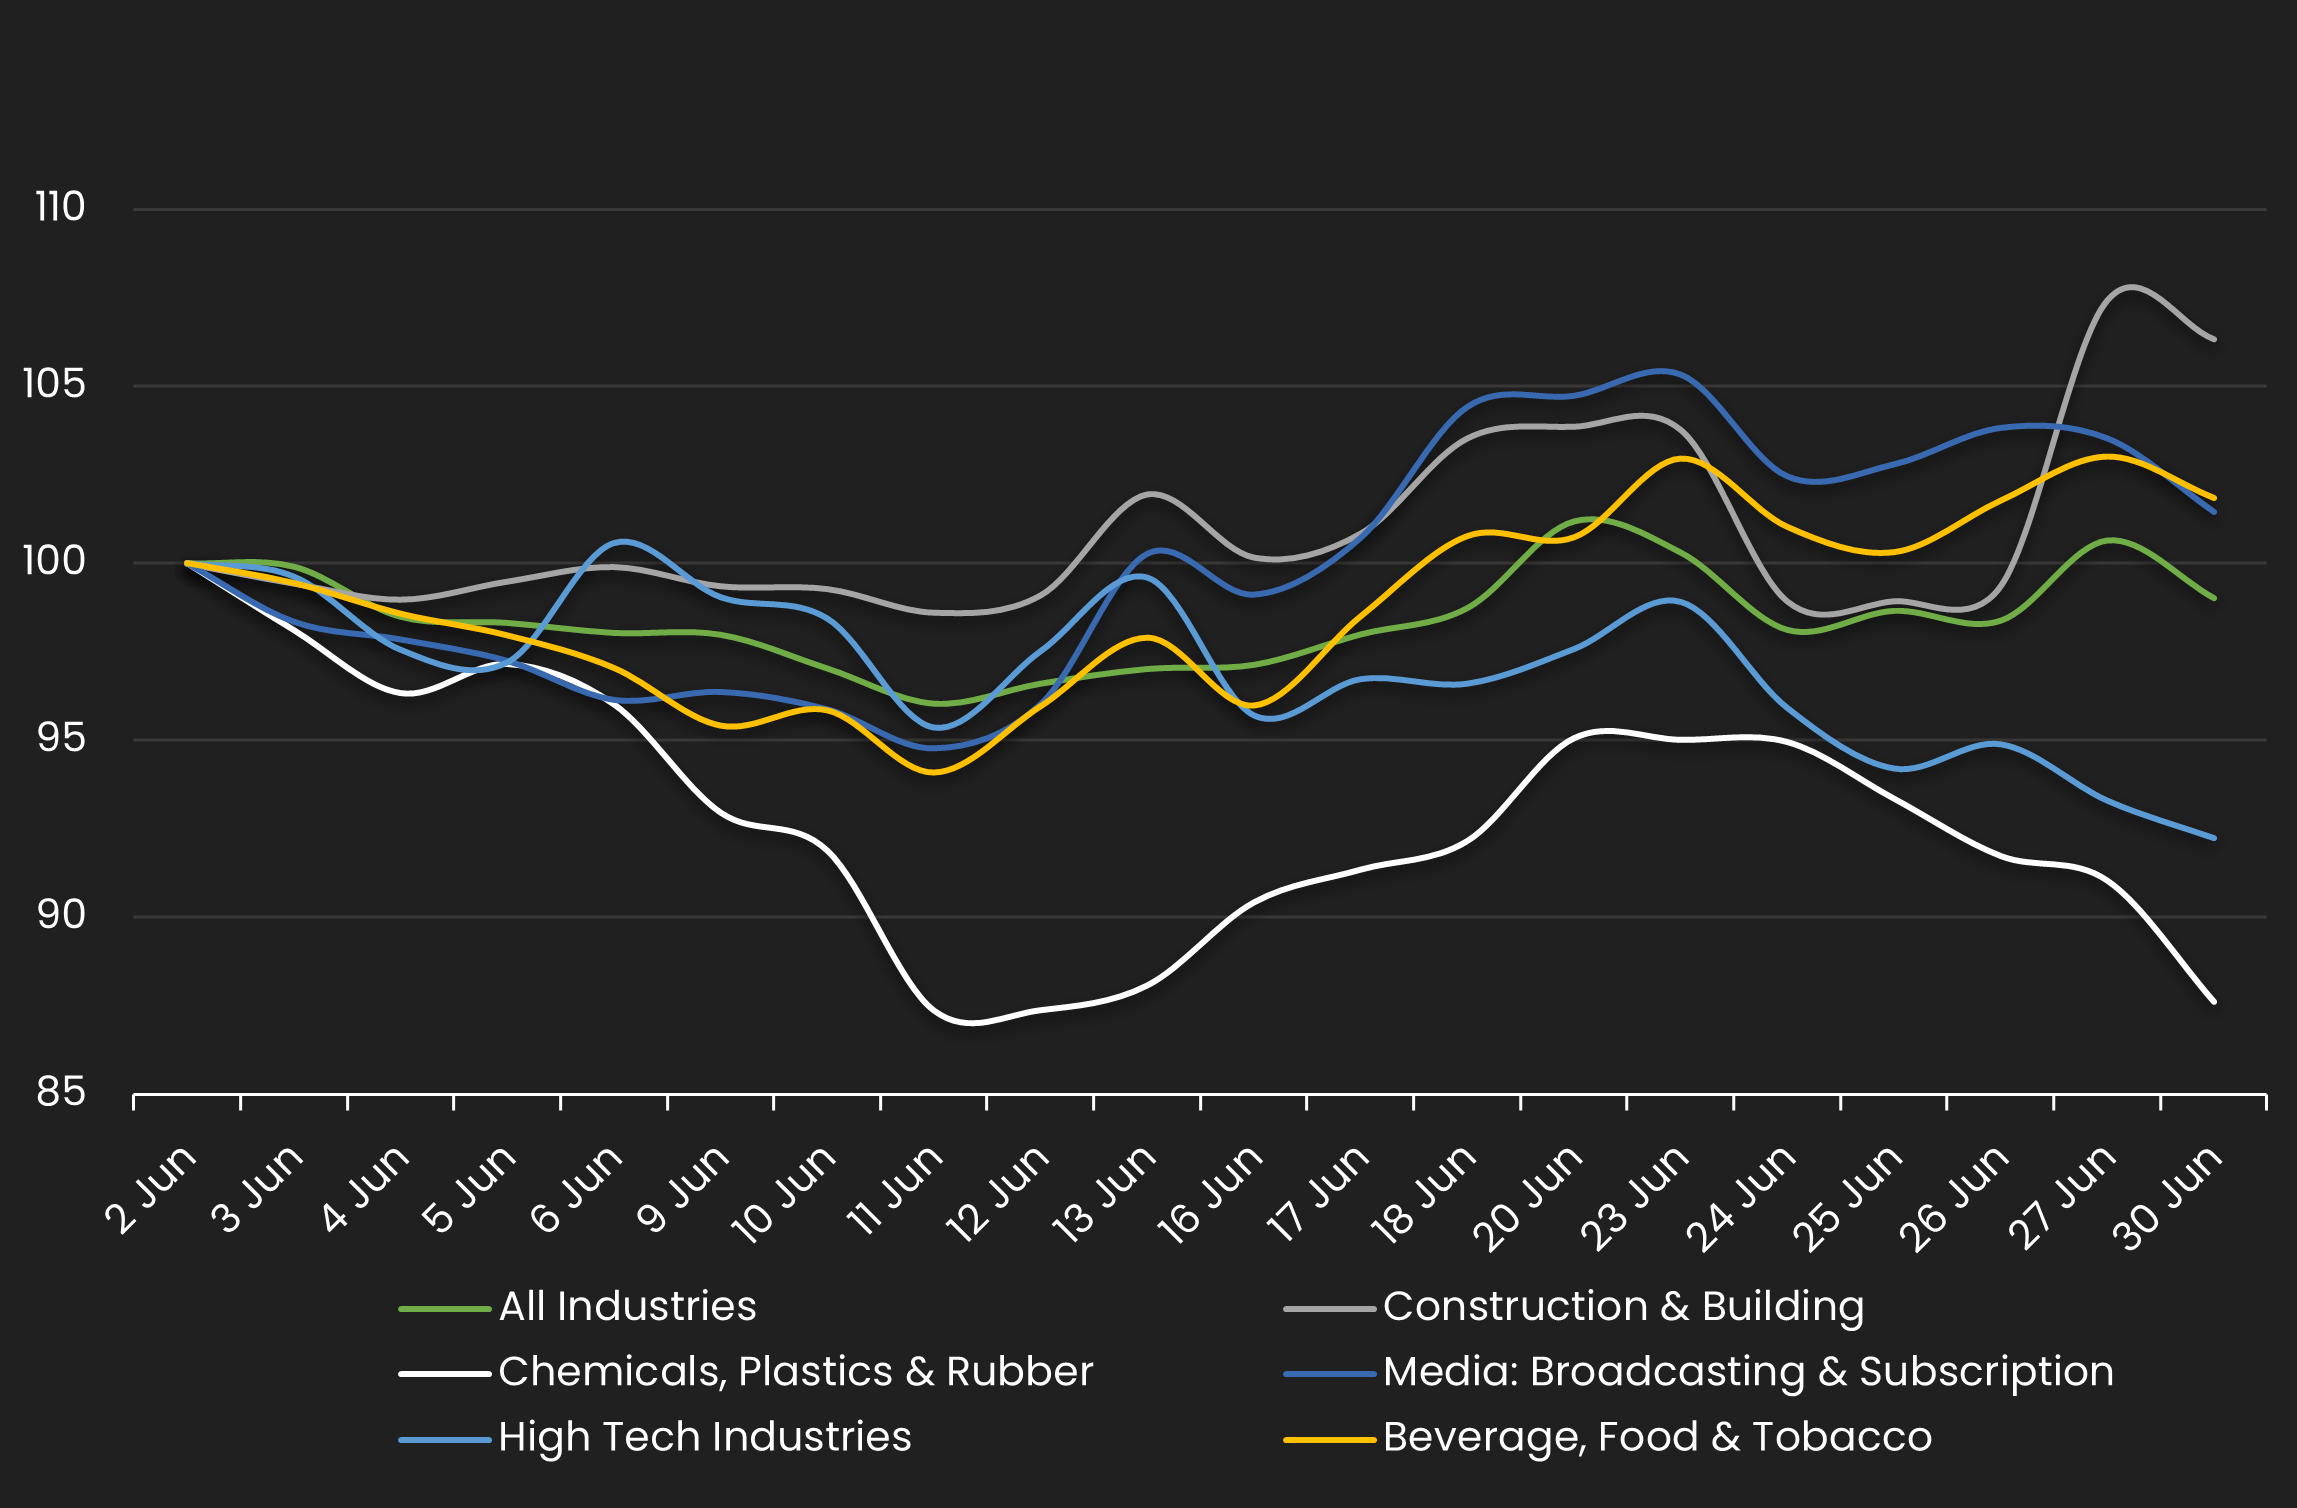
IG Spread by Industries – Monthly Comparison
Exhibits the IG spread by industry for the month ending 5/31/24 vs. the month ending 6/30/25
| INDUSTRIES | PREVIOUS SPREAD | CURRENT SPREAD | BPS CHANGE | MONTHLY PERFORMANCE | CDS COUNT |
|---|---|---|---|---|---|
| All Industries | 51 | 51 | -1 | Tighter | 645.00 |
| Construction & Building | 50 | 53 | 3 | Wider | 15.00 |
| Chemicals, Plastics & Rubber | 81 | 71 | -10 | Tighter | 19.00 |
| Media: Broadcasting & Subscription | 78 | 79 | 1 | Wider | 2.00 |
| High Tech Industries | 38 | 35 | -3 | Tighter | 29.00 |
| Beverage, Food & Tobacco | 43 | 44 | 1 | Wider | 38.00 |
Stay up-to-date with monthly summaries.
Related Resources
About SOLVE
SOLVE is the leading market data platform provider for fixed-income securities, trusted by sophisticated buy-side and sell-side firms worldwide. Founded in 2011, SOLVE leverages its AI-driven technology and deep industry expertise to offer unparalleled transparency into markets, reduce risk, and save hundreds of hours across front-office workflows. With the largest real-time datasets for Securitized Products, Municipal Bonds, Corporate Bonds, Syndicated Bank Loans, Convertible Bonds, CDS, and Private Credit, SOLVE empowers clients to transform the way they bring new securities to market, trade on secondary markets, and value highly illiquid securities. Headquartered in Connecticut, with offices across the globe, SOLVE is the definitive source for market pricing in fixed-income markets.
