Investment Grade CDS Market Summary – January 2024
GET OUR CDS MARKET SUMMARIES STRAIGHT TO YOUR INBOX. LEARN MORE
Investment Grade CDS Market Summary:January 2024
Our newsletter presents key trends derived from observable Credit Default Swaps pricing data over a monthly period.
Top 10 Outperformers
Showcases the top 10 IG CDS “outperformers” based on the largest mid spread decreases between 1/1/24 – 1/31/24
| RANK | BOND NAME | ISSUER | % CHANGE | BPS CHANGE | SPRD | SPRD-1 MONTH | DEALERS |
|---|---|---|---|---|---|---|---|
| 1 | MDC 5Y | M.D.C. HOLDINGS, INC | -36.3% | -42 | 74 | 116 | 5 |
| 2 | VLO 5Y | PREMCOR REFNG GROUP INC | -19.4% | -14 | 59 | 74 | 5 |
| 3 | VIVFP 5Y | SEAGRAM CO LTD | -19.1% | -13 | 56 | 69 | 6 |
| 4 | BATSLN 5Y | B A T INTL FIN PLC | -17.4% | -14 | 68 | 83 | 6 |
| 5 | MPC 5Y | MPC LLC | -15.9% | -11 | 59 | 70 | 5 |
| 6 | AKZANA 5Y | ICI WILMINGTON INC | -15.4% | -10 | 54 | 63 | 6 |
| 7 | TRPCN 5Y | ANR PIPELINE CO | -15.4% | -11 | 59 | 70 | 4 |
| 8 | HCA 5Y | HCA INC | -14.4% | -12 | 68 | 80 | 5 |
| 9 | ACOMCO 5Y | ACOM CO LTD | -13.9% | -9 | 55 | 64 | 4 |
| 10 | IMBLN 5Y | IMPERIAL BRANDS FIN PLC | -13.2% | -11 | 71 | 81 | 6 |
Top 10 Underperformers
Showcases the top 10 IG CDS “underperformers” based on the largest mid spread increases between 1/1/24 – 1/31/24
| RANK | BOND NAME | ISSUER | % CHANGE | BPS CHANGE | SPRD | SPRD-1 MONTH | DEALERS |
|---|---|---|---|---|---|---|---|
| 1 | SUMICH 5Y | SUMITOMO CHEMICAL CO LTD | 64.0% | 38 | 97 | 59 | 3 |
| 2 | SOLBBB 5Y | SOLVAY | 61.0% | 34 | 91 | 57 | 6 |
| 3 | BA 5Y | BOEING CAP CORP INTERNOTES | 42.4% | 26 | 87 | 61 | 4 |
| 4 | ABXFIN 5Y | BARRICK GOLD CORP | 25.4% | 11 | 55 | 44 | 5 |
| 5 | TENCNT 5Y | TENCENT HLDGS LTD | 19.9% | 16 | 94 | 78 | 3 |
| 6 | CMBKKO 5Y | WOORI BK KOREA | 19.4% | 6 | 36 | 31 | 3 |
| 7 | CHGRID 5Y | STATE GRID CORPORATION OF CHINA | 16.6% | 10 | 68 | 59 | 3 |
| 8 | ADECCO 5Y | ADECCO SA | 15.1% | 10 | 74 | 64 | 6 |
| 9 | SUNHUN 5Y | SUN HUNG KAI PPTYS LTD | 14.6% | 9 | 69 | 60 | 3 |
| 10 | SWIRE 5Y | SWIRE PACIFIC LTD | 14.2% | 8.4 | 68 | 59 | 3 |
Normalized IG Spread by Region
Displays the IG CDS spread by region between 1/1/24 – 1/31/24 Results are based on 5 select regions, however, we offer data across 12 regions
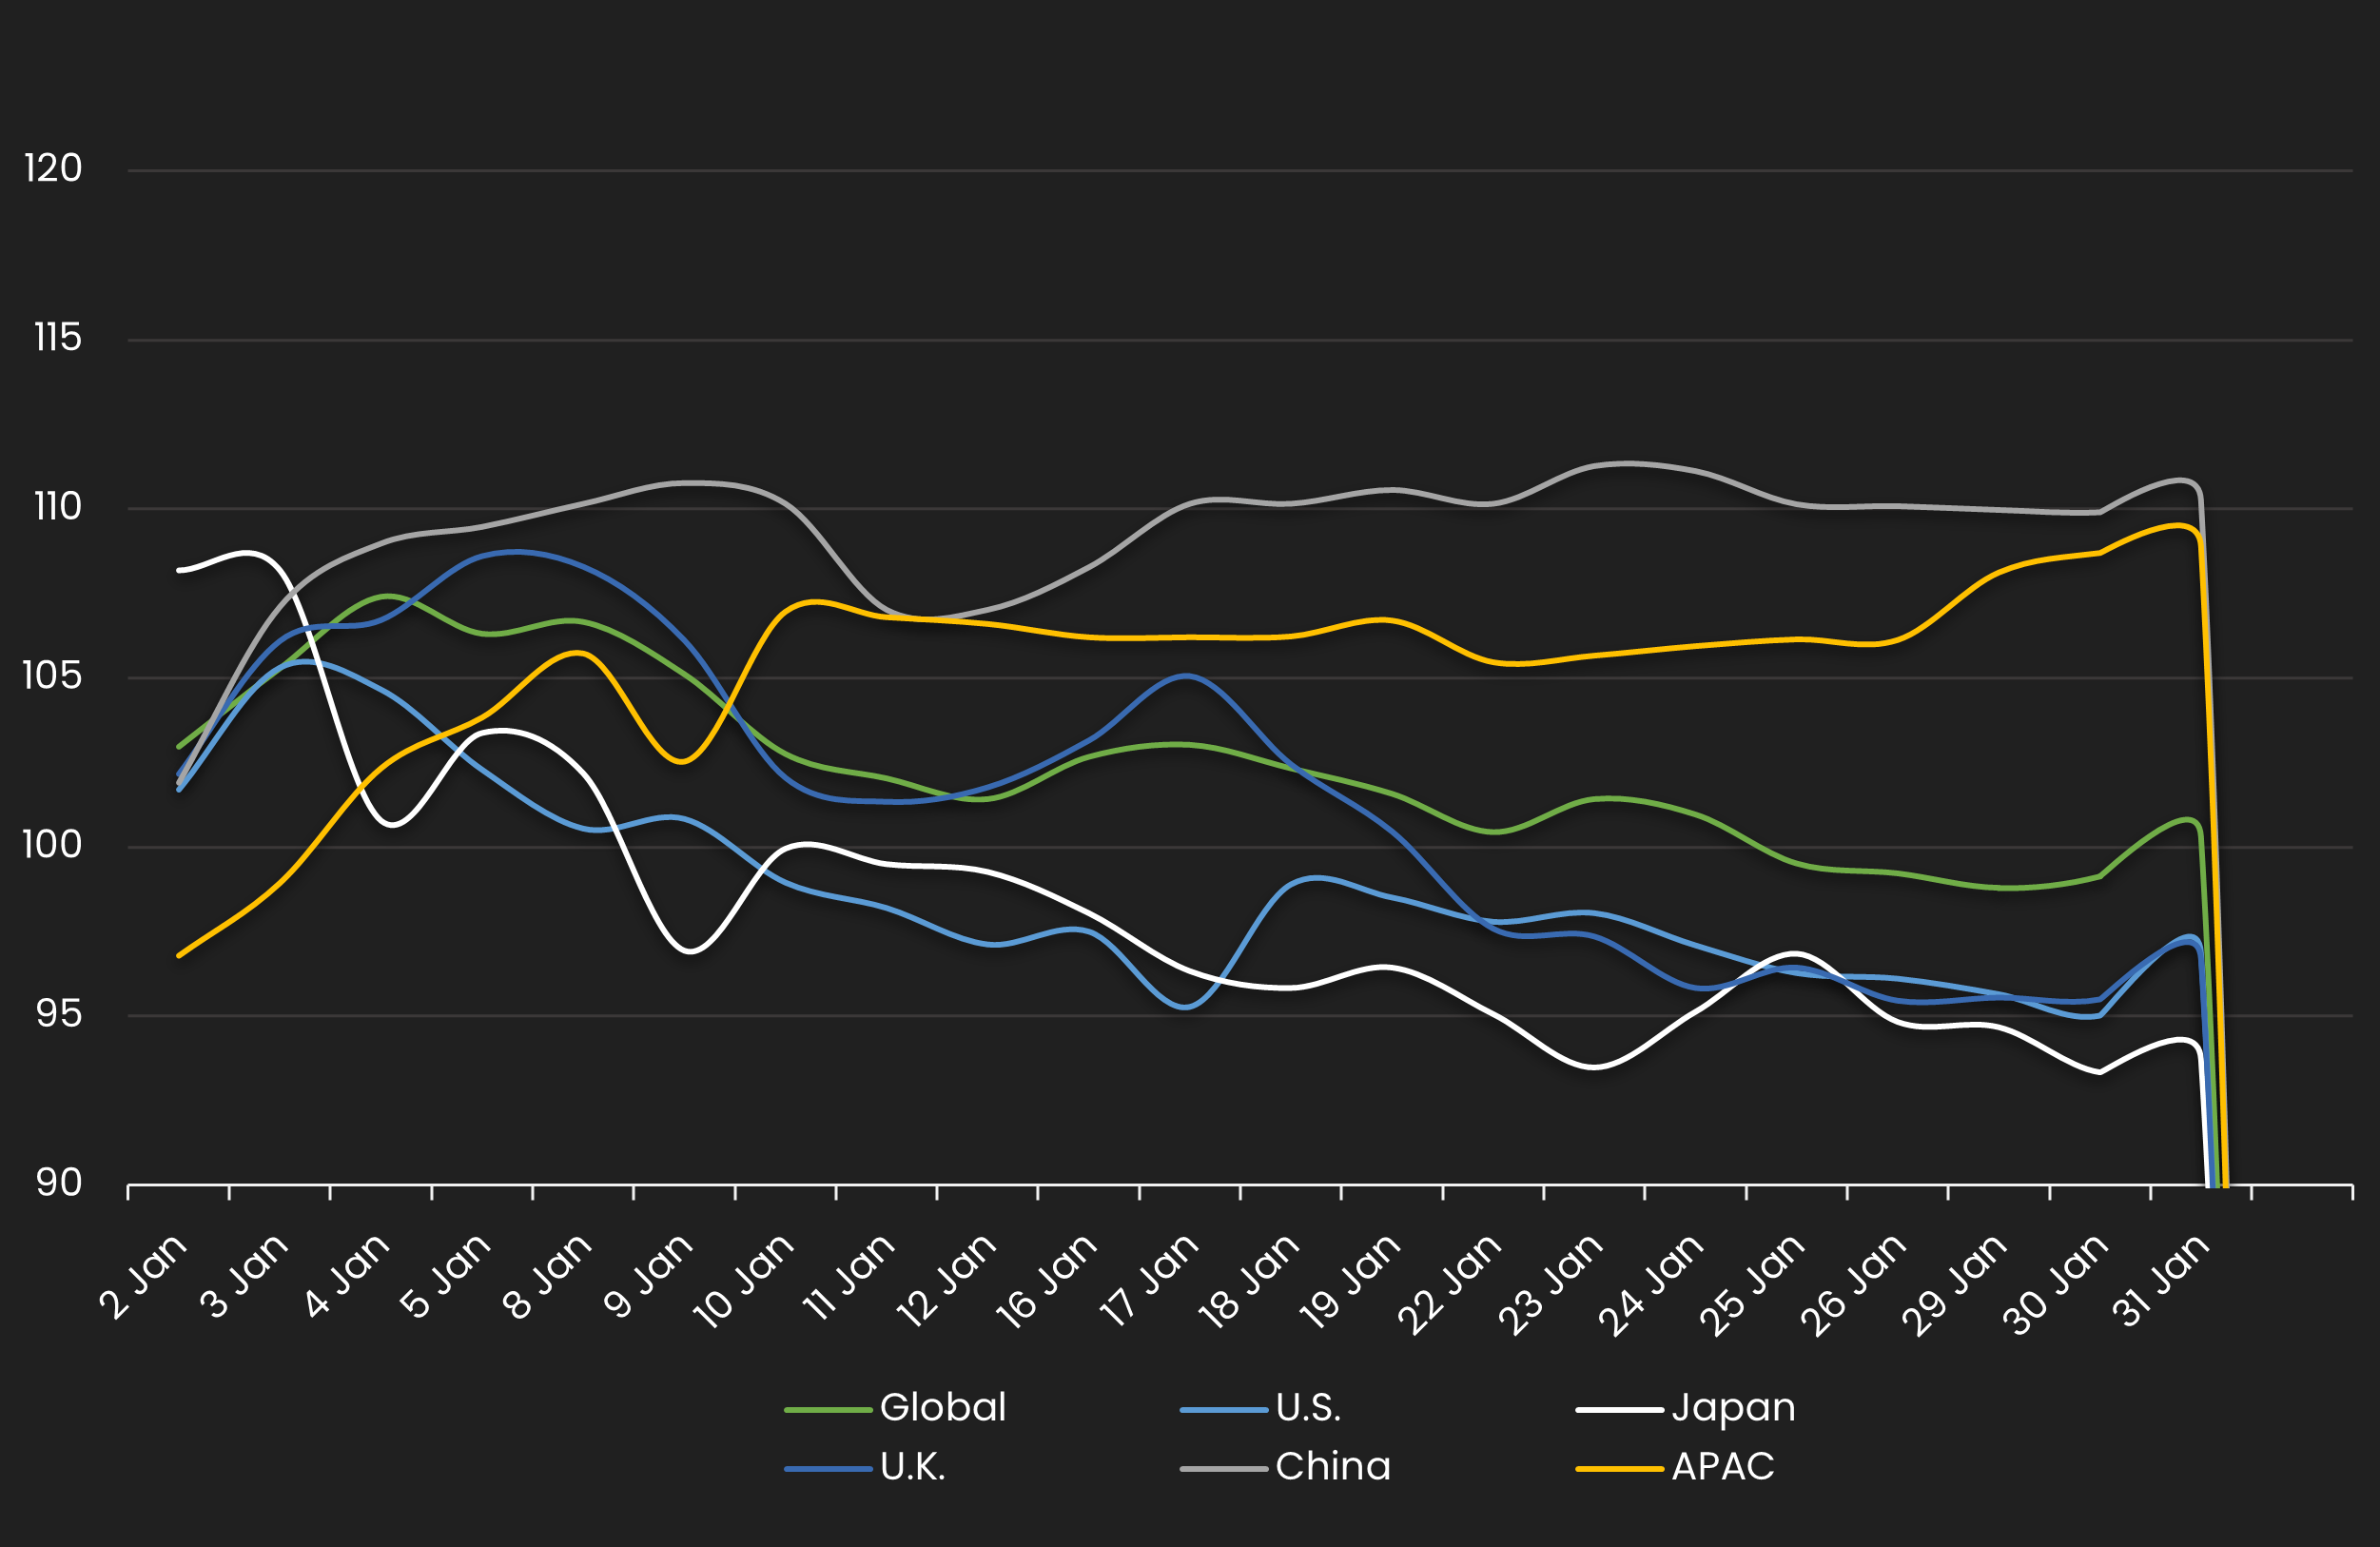
IG Spread by Region – Monthly Comparison
Exhibits the IG mid spread by region for the month ending 12/31/23 vs. the month ending 1/31/24
| REGION | PREVIOUS SPREAD | CURRENT SPREAD | BPS CHANGE | MONTHLY PERFORMANCE | CDS COUNT |
|---|---|---|---|---|---|
| Global | 53 | 54 | 0.2 | Wider | 610 |
| U.S. | 55 | 53 | -2 | Tighter | 237 |
| Japan | 32 | 30 | -2 | Tighter | 43 |
| U.K. | 60 | 58 | -2 | Tighter | 39 |
| China | 68 | 75 | 7 | Wider | 9 |
| APAC | 45 | 49 | 4 | Wider | 46 |
Normalized IG Spread by Industry
Displays the IG CDS spread by industry between 1/1/24 – 1/31/24 Results are based on 5 select industry sectors, however, we offer data across 36 sectors
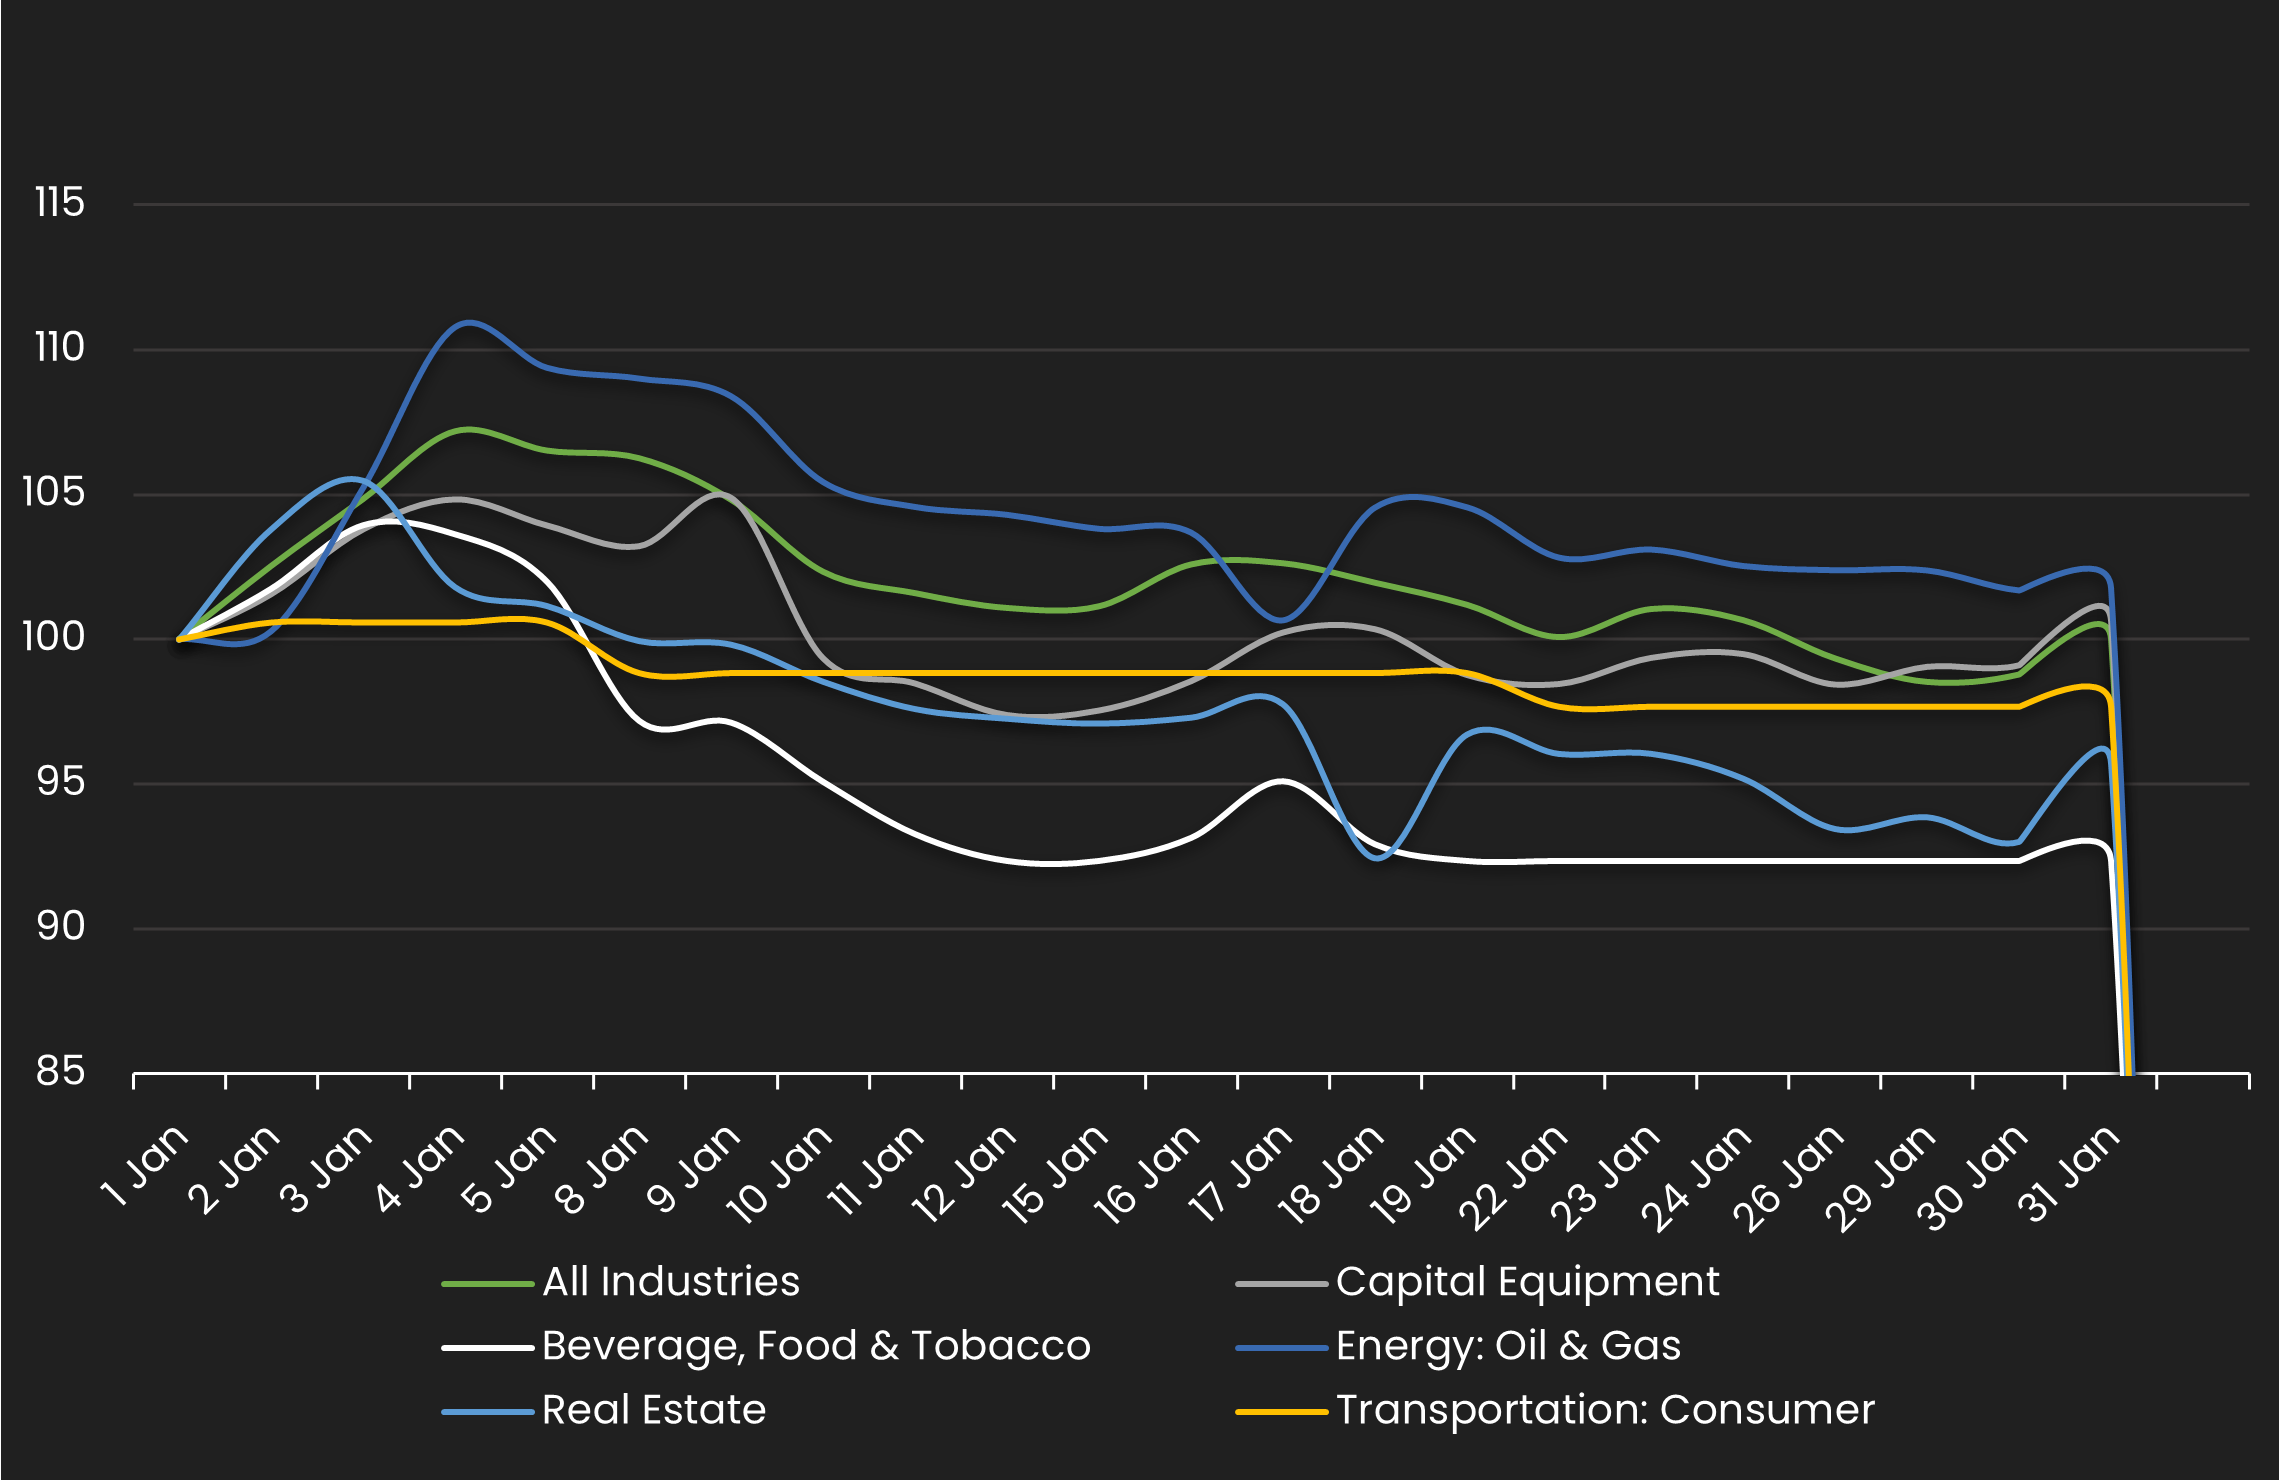
IG Spread by Industries – Monthly Comparison
Exhibits the IG spread by industry for the month ending 12/31/23 vs. the month ending 1/31/24
| INDUSTRIES | PREVIOUS SPREAD | CURRENT SPREAD | BPS CHANGE | MONTHLY PERFORMANCE | CDS COUNT |
|---|---|---|---|---|---|
| All Industry | 54 | 54 | 0 | Tighter | 0 |
| Capital Equipment | 73 | 74 | 0 | Wider | 0 |
| Beverage, Food & Tobacco | 46 | 43 | -4 | Tighter | 0 |
| Energy: Oil & Gas | 67 | 68 | 1 | Wider | 0 |
| Real Estate | 93 | 89 | -4 | Tighter | 0 |
| Transportation: Consumer | 86 | 84 | -2 | Tighter | 0 |
Stay up-to-date with monthly summaries.
Related Resources
About SOLVE
SOLVE is the leading market data platform provider for fixed-income securities, trusted by sophisticated buy-side and sell-side firms worldwide. Founded in 2011, SOLVE leverages its AI-driven technology and deep industry expertise to offer unparalleled transparency into markets, reduce risk, and save hundreds of hours across front-office workflows. With the largest real-time datasets for Securitized Products, Municipal Bonds, Corporate Bonds, Syndicated Bank Loans, Convertible Bonds, CDS, and Private Credit, SOLVE empowers clients to transform the way they bring new securities to market, trade on secondary markets, and value highly illiquid securities. Headquartered in Connecticut, with offices across the globe, SOLVE is the definitive source for market pricing in fixed-income markets.
