Investment Grade CDS Market Summary – January 2022
GET OUR CDS MARKET SUMMARIES STRAIGHT TO YOUR INBOX. LEARN MORE
Investment Grade CDS Market Summary: January 2022
Our newsletter presents key trends derived from observable Credit Default Swaps pricing data over a monthly period.
Top 10 Outperformers
Showcases the top 10 IG CDS “outperformers” based on the largest mid spread decreases between 12/31/21 – 1/31/22
| RANK | BOND NAME | ISSUER | % CHG | BPS CHG | SPRD | SPRD-1 MNTH |
|---|---|---|---|---|---|---|
| 1 | PBG 5Y | BOTTLING GROUP LLC | -19.5% | -6 | 26 | 33 |
| 2 | ACCOR 5Y | ACCOR SA | -8.8% | -14 | 148 | 162 |
| 3 | MRO 5Y | MARATHON GLOBAL FDG CORP | -6.8% | -8 | 106 | 114 |
| 4 | LHAGR 5Y | DEUTSCHE LUFTHANSA AG | -6.7% | -18 | 250 | 268 |
| 5 | HAL 5Y | DRESSER INDS INC | -5.9% | -5 | 77 | 81 |
| 6 | VLO 5Y | PREMCOR REFNG GROUP INC | -4.9% | -5 | 91 | 95 |
| 7 | NOMURA 5Y | NOMURA HLDGS INC | -3.3% | -3 | 75 | 78 |
| 8 | HESS 5Y | AMERADA HESS CORP | -2.8% | -3 | 105 | 108 |
| 9 | DVN 5Y | DEVON ENERGY CORP | -2.3% | -2 | 99 | 101 |
| 10 | UCBBB 5Y | UCB SA | -0.7% | -1 | 91 | 92 |
Top 10 Underperformers
Showcases the top 10 IG CDS “underperformers” based on the largest mid spread increases between 12/31/21 – 1/31/22
| RANK | BOND NAME | ISSUER | % CHG | BPS CHG | SPRD | SPRD-1 MNTH |
|---|---|---|---|---|---|---|
| 1 | RAI 5Y | RJ REYNOLDS TOBACCO HOLDINGS INC | 45.1% | 11 | 34 | 24 |
| 2 | CB 5Y | CHUBB CORP | 39.9% | 8 | 29 | 21 |
| 3 | DRI 5Y | DARDEN RESTAURANTS INC | 33.5% | 18 | 70 | 53 |
| 4 | CVS 5Y | CVS CAREMARK CORP | 30.9% | 11 | 47 | 36 |
| 5 | JNJ 5Y | LIFESCAN GLOBAL CORP | 30.2% | 6 | 26 | 20 |
| 6 | WYE 5Y | ALPHARMA INC | 28.3% | 7 | 34 | 26 |
| 7 | AES 5Y | AES TRUST I | 27.3% | 23 | 108 | 85 |
| 8 | SKYLN 5Y | BRITISH SKY BROADCASTING | 27.0% | 4 | 18 | 14 |
| 9 | NEE 5Y | FPL ENERGY AMERN WIND LLC | 26.9% | 10 | 49 | 39 |
| 10 | PRU 5Y | PRUDENTIAL FINANCIAL, INC | 26.9% | 15 | 73 | 57 |
Normalized IG Spread by Region
Displays the IG CDS spread by region between 12/31/21 – 1/31/22 Results are based on 5 select regions, however, we offer data across 12 regions
IG Spread by Region – Monthly Comparison
Exhibits the IG mid spread by region for the month ending 12/31/21 vs. the month ending 1/31/22
| REGION | PREVIOUS SPREAD | CURRENT SPREAD | BPS CHANGE | MONTHLY PERFORMANCE | CDS COUNT |
|---|---|---|---|---|---|
| Global | 50 | 55 | 5 | Wider | 621 |
| U.S. | 45 | 54 | 8 | Wider | 226 |
| Japan | 25 | 26 | 1 | Wider | 48 |
| Europe | 46 | 53 | 7 | Wider | 180 |
| U.K. | 57 | 66 | 9 | Wider | 42 |
| MENA | 88 | 98 | 9 | Wider | 15 |
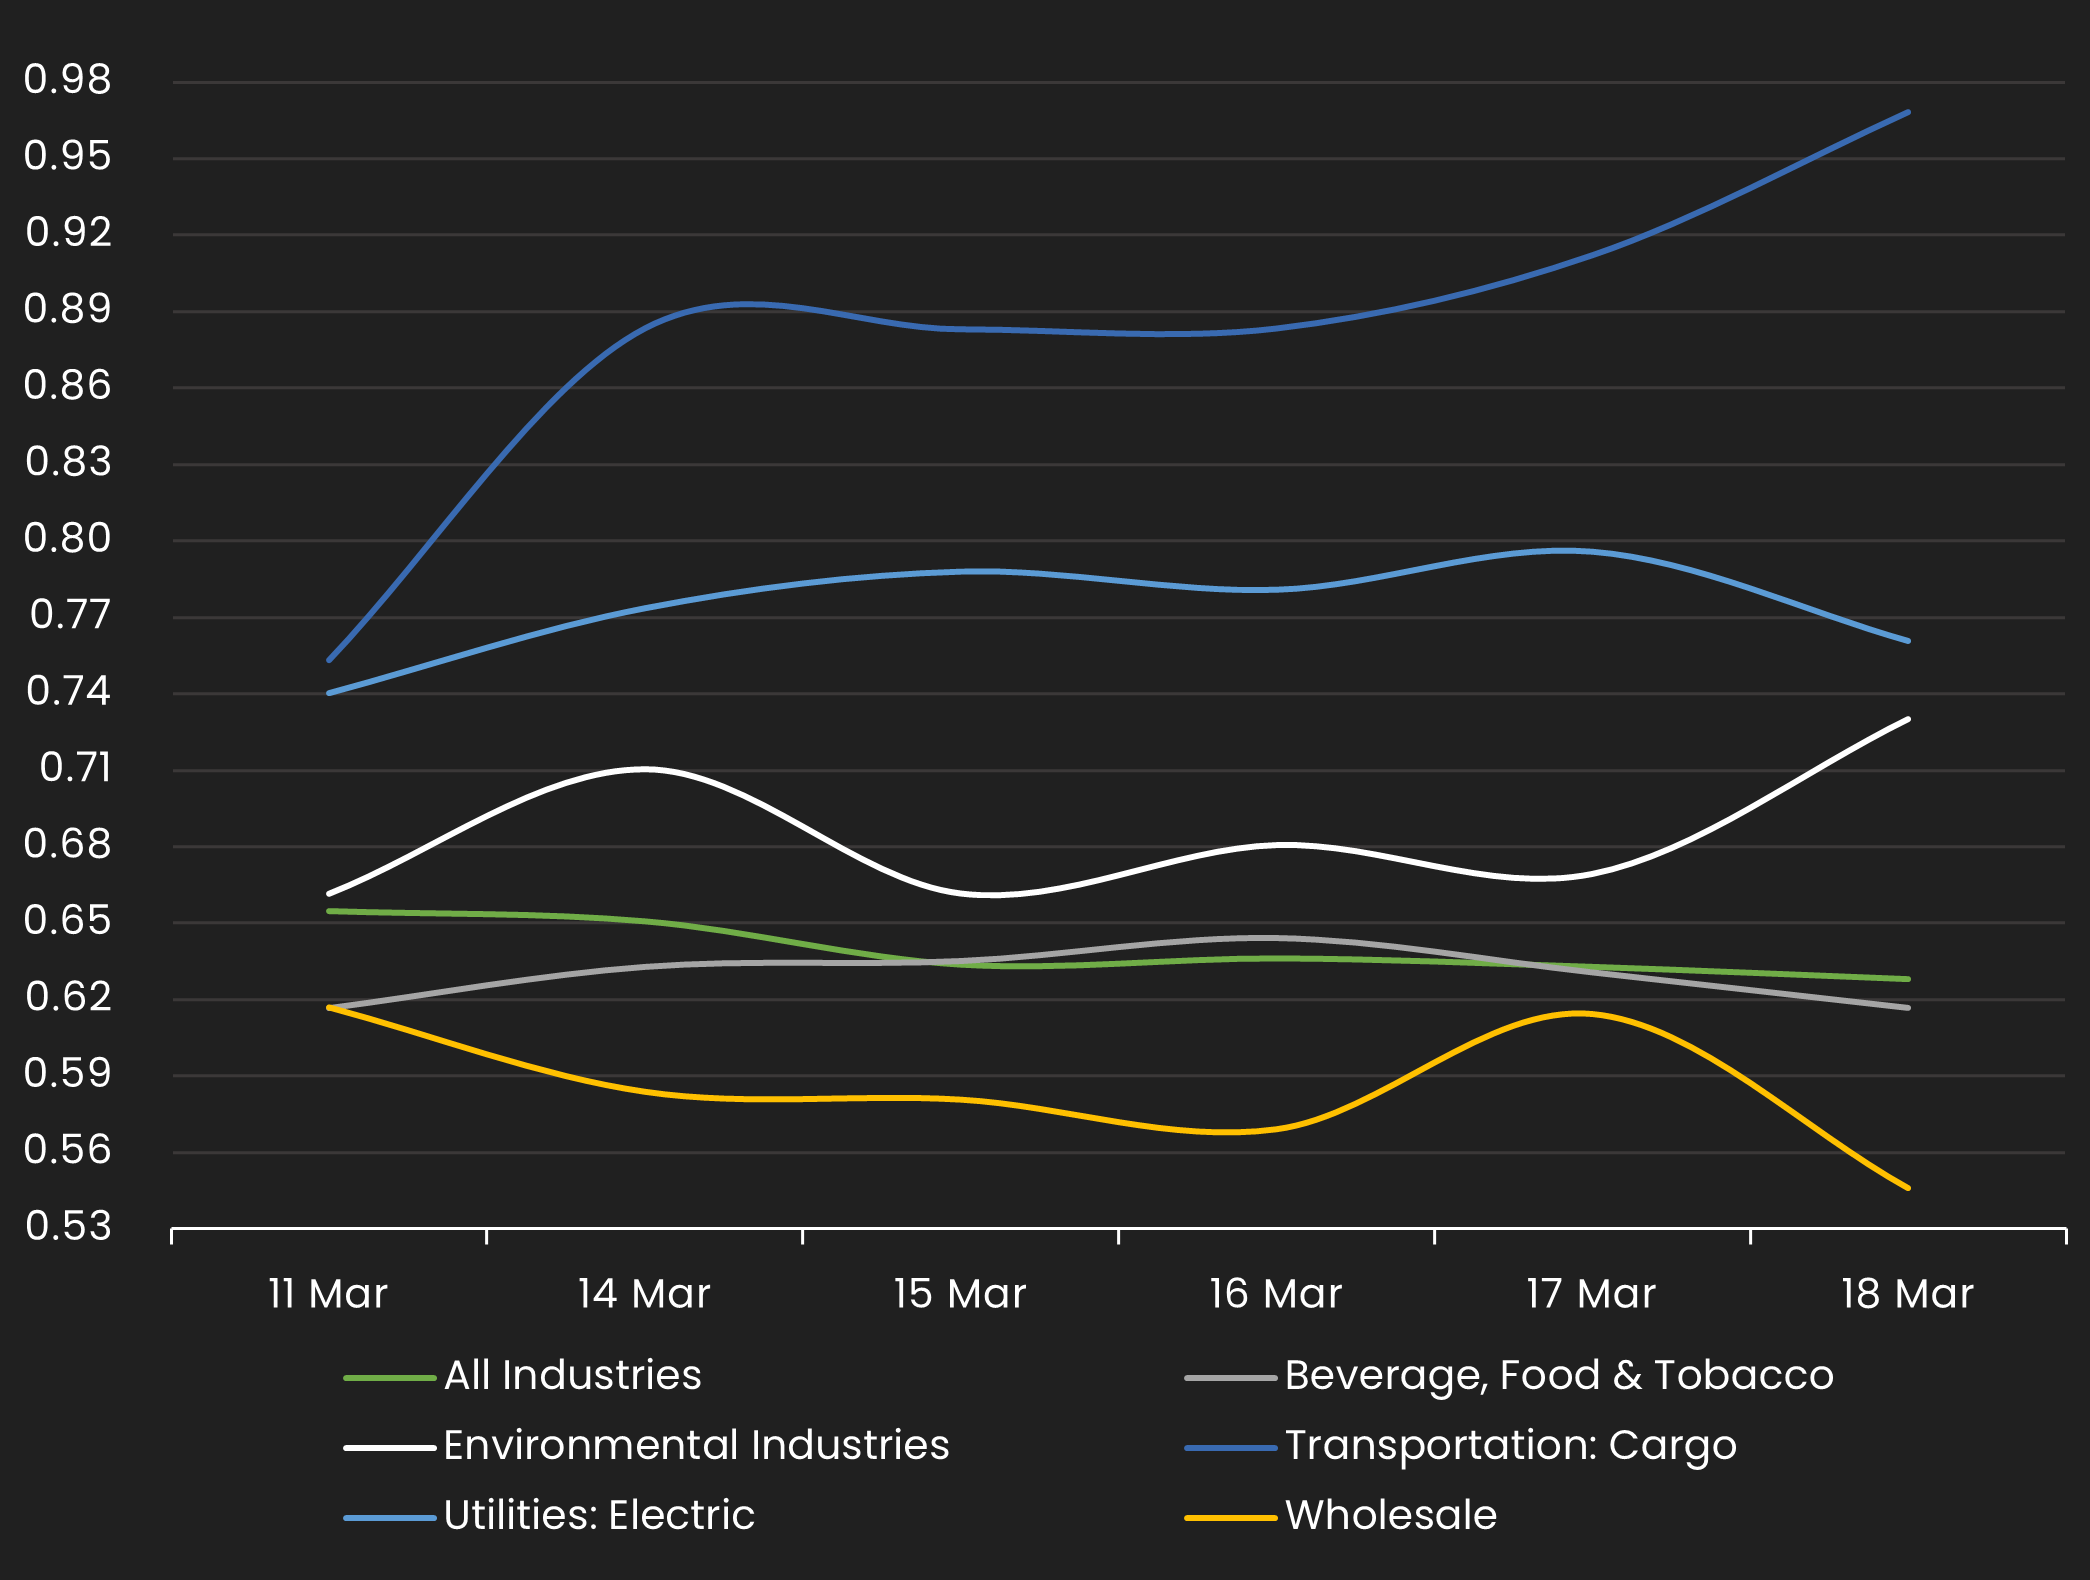
Normalized IG Spread by Industry
Displays the IG CDS spread by industry between 12/31/21 – 1/31/22 Results are based on 5 select industry sectors, however, we offer data across 36 sectors
IG Spread by Industries – Monthly Comparison
Exhibits the IG spread by industry for the month ending 12/31/21 vs. the month ending 1/31/22
| INDUSTRY | PREVIOUS SPREAD | CURRENT SPREAD | BPS CHANGE | MONTHLY PERFORMANCE | CDS COUNT |
|---|---|---|---|---|---|
| All Industries | 50 | 55 | 5 | Wider | 625 |
| Chemicals, Plastics & Rubber | 57 | 66 | 9 | Wider | 17 |
| Construction & Building | 38 | 44 | 6 | Wider | 14 |
| Healthcare & Pharmaceuticals | 33 | 39 | 6 | Wider | 31 |
| Real Estate | 61 | 67 | 6 | Wider | 33 |
| Transportation: Cargo | 31 | 34 | 2 | Wider | 13 |
Stay up-to-date with monthly summaries.
Related Resources
About SOLVE
SOLVE is the leading market data platform provider for fixed-income securities, trusted by sophisticated buy-side and sell-side firms worldwide. Founded in 2011, SOLVE leverages its AI-driven technology and deep industry expertise to offer unparalleled transparency into markets, reduce risk, and save hundreds of hours across front-office workflows. With the largest real-time datasets for Securitized Products, Municipal Bonds, Corporate Bonds, Syndicated Bank Loans, Convertible Bonds, CDS, and Private Credit, SOLVE empowers clients to transform the way they bring new securities to market, trade on secondary markets, and value highly illiquid securities. Headquartered in Connecticut, with offices across the globe, SOLVE is the definitive source for market pricing in fixed-income markets.
