Investment Grade CDS Market Summary – December 2025
GET OUR CDS MARKET SUMMARIES STRAIGHT TO YOUR INBOX. LEARN MORE
Investment Grade CDS Market December 2025
Our newsletter presents key trends derived from observable Credit Default Swaps pricing data over a monthly period.
Top 10 Outperformers
Showcases the top 10 IG CDS “outperformers” based on the largest mid spread decreases between 12/1/25 – 12/31/25
| RANK | BOND NAME | ISSUER | % CHANGE | BPS CHANGE | SPRD | SPRD-1 MONTH | DEALERS |
|---|---|---|---|---|---|---|---|
| 1 | LGEN 5Y CDS | LEGAL & GENERAL GROUP PLC | -20.4% | -14 | 53 | 67 | 2 |
| 2 | BAYGR 5Y | BAYER CORP | -16.4% | -11 | 59 | 70 | 3 |
| 3 | AMT 5Y | AMERICAN TOWER CORP | -13.0% | -8 | 51 | 59 | 3 |
| 4 | HRB 5Y | BLOCK FINL LLC | -12.8% | -9 | 58 | 67 | 3 |
| 5 | STERV 5Y | STORA ENSO CORP | -11.7% | -11 | 80 | 91 | 7 |
| 6 | COFF 5Y | CAPITAL ONE FINL CORP | -11.5% | -9 | 65 | 74 | 3 |
| 7 | PAPER 5Y | INTERNATIONAL PAPER CO | -11.5% | -7 | 56 | 64 | 4 |
| 8 | PRU 5Y | PRUDENTIAL FINANCIAL, INC | -9.4% | -6 | 58 | 65 | 3 |
| 9 | MET 5Y | GENAMERICA CAP I | -9.0% | -6 | 59 | 65 | 3 |
| 10 | CONTI 5Y | CONTI-GUMMI FIN B V | -8.9% | -7 | 69 | 76 | 7 |
Top 10 Underperformers
Showcases the top 10 IG CDS “underperformers” based on the largest mid spread increases between 12/1/25 – 12/31/25
| RANK | BOND NAME | ISSUER | % CHANGE | BPS CHANGE | SPRD | SPRD-1 MONTH | DEALERS |
|---|---|---|---|---|---|---|---|
| 1 | NFLX 5Y | NETFLIX INC | 41.2% | 14 | 47 | 34 | 5 |
| 2 | NKE 5Y | NIKE INC MEDIUM TERM NTS BOOK | 18.4% | 9 | 61 | 52 | 2 |
| 3 | TJX 5Y | TJX COS INC NEW | 12.1% | 6 | 52 | 46 | 2 |
| 4 | HUM 5Y | HUMANA INC | 10.2% | 8 | 87 | 79 | 3 |
| 5 | AVGO 5Y | AVAGO TECHNOLOGIES FINANCE PTE LTD | 10.1% | 4 | 41 | 37 | 3 |
| 6 | MSFT 5Y | MICROSOFT CORP | 9.5% | 3 | 37 | 33 | 5 |
| 7 | SYY 5Y | SYSCO CORP | 8.9% | 5 | 60 | 55 | 2 |
| 8 | CMCSA 5Y | AT&T BROADBAND CORP | 8.0% | 4 | 59 | 55 | 5 |
| 9 | CPB 5Y | CAMPBELL SOUP CO | 7.4% | 4 | 57 | 53 | 4 |
| 10 | SBIIN 5Y | STATE BK INDIA CHICAGO ILL | 6.4% | 3.7 | 62 | 58 | 3 |
Normalized IG Spread by Region
Displays the IG CDS spread by region between 12/1/25 – 12/31/25 Results are based on select regions, however, we offer data across 12 regions
IG Spread by Region – Monthly Comparison
Exhibits the IG mid spread by region for the month ending 11/30/25 vs. the month ending 12/31/25
| REGION | PREVIOUS SPREAD | CURRENT SPREAD | BPS CHANGE | MONTHLY PERFORMANCE | CDS COUNT |
|---|---|---|---|---|---|
| Global | 48 | 45 | -2 | Tighter | 0 |
| U.S. | 50 | 49 | -1 | Tighter | 0 |
| Japan | 34 | 33 | -1 | Tighter | 0 |
| Europe | 43 | 42 | -2 | Tighter | 0 |
| U.K. | 48 | 47 | -1 | Tighter | 0 |
| APAC | 44 | 45 | 1 | Wider | 0 |
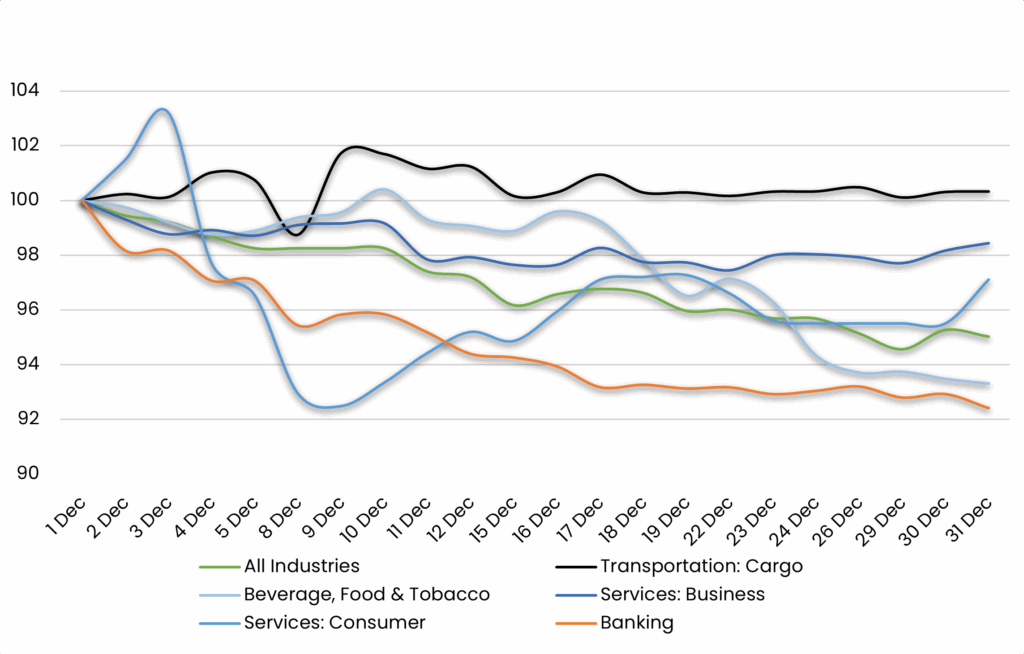
Normalized IG Spread by Industry
Displays the IG CDS spread by industry between 12/1/25 – 12/31/25 Results are based on select industry sectors, however, we offer data across 36 sectors

IG Spread by Industries – Monthly Comparison
Exhibits the IG spread by industry for the month ending 11/30/25 vs. the month ending 12/31/25
| INDUSTRIES | PREVIOUS SPREAD | CURRENT SPREAD | BPS CHANGE | MONTHLY PERFORMANCE | CDS COUNT |
|---|---|---|---|---|---|
| All Industries | 48 | 45 | -2 | Tighter | 580.00 |
| Transportation: Cargo | 29 | 29 | 0 | Wider | 11.00 |
| Beverage, Food & Tobacco | 44 | 41 | -3 | Tighter | 31.00 |
| Services: Business | 67 | 66 | -1 | Tighter | 3.00 |
| Services: Consumer | 90 | 87 | -3 | Tighter | 3.00 |
| Banking | 46 | 42 | -3 | Tighter | 44.00 |
Stay up-to-date with monthly summaries.
Related Resources
About SOLVE
SOLVE is the leading market data platform provider for fixed-income securities, trusted by sophisticated buy-side and sell-side firms worldwide. Founded in 2011, SOLVE leverages its AI-driven technology and deep industry expertise to offer unparalleled transparency into markets, reduce risk, and save hundreds of hours across front-office workflows. With the largest real-time datasets for Securitized Products, Municipal Bonds, Corporate Bonds, Syndicated Bank Loans, Convertible Bonds, CDS, and Private Credit, SOLVE empowers clients to transform the way they bring new securities to market, trade on secondary markets, and value highly illiquid securities. Headquartered in Connecticut, with offices across the globe, SOLVE is the definitive source for market pricing in fixed-income markets.
