High Yield CDS Market Summary – October 2023
GET OUR CDS MARKET SUMMARIES STRAIGHT TO YOUR INBOX. LEARN MORE
High Yield CDS Market Summary:October 2023
Our newsletter presents key trends derived from observable Credit Default Swaps pricing data over a monthly period.
Top 10 Outperformers
Showcases the top 10 HY CDS “outperformers” based on the largest mid spread decreases between 10/1/23 – 10/31/23
| RANK | BOND NAME | ISSUER | % CHANGE | BPS CHANGE | SPRD | SPRD-1 MONTH | DEALERS |
|---|---|---|---|---|---|---|---|
| 1 | NIDHEA 5Y | STADA ARZNEIMITTEL AG | -9.3% | -16 | 158 | 175 | 2 |
| 2 | AR 5Y | ANTERO RESOURCES CORP | -8.7% | -15 | 154 | 169 | 4 |
| 3 | CHK 5Y | CHESAPEAKE ENERGY CORP | -8.4% | -15 | 161 | 175 | 3 |
| 4 | MUR 5Y | MURPHY OIL CORP | -7.9% | -13 | 155 | 168 | 4 |
| 5 | TARGA 5Y | TARGA RES PARTNERS LP / TARGA | -6.5% | -7 | 98 | 105 | 3 |
| 6 | X 5Y | TRANSTAR HLDGS INC | -6.5% | -17 | 240 | 256 | 3 |
| 7 | GNW 5Y | AQGEN LIBERTY MGMT I INC | -6.0% | -11 | 176 | 187 | 3 |
| 8 | GFKLDE 5Y | LOWELL HOLDINGS GMBH | -5.5% | -8 | 144 | 152 | 2 |
| 9 | OVV 5Y | OVINTIV | -5.0% | -6 | 113 | 119 | 6 |
| 10 | CIT 5Y | AT&T CAP CORP | -4.8% | -8 | 150 | 158 | 2 |
Top 10 Underperformers
Showcases the top 10 HY CDS “underperformers” based on the largest mid spread increases between 10/1/23 – 10/31/23
| RANK | BOND NAME | ISSUER | % CHANGE | BPS CHANGE | SPREAD | SPREAD-1 MONTH | DEALERS |
|---|---|---|---|---|---|---|---|
| 1 | CCK 5Y | CROWN AMERICAS LLC | 24.1% | 38 | 196 | 158 | 3 |
| 2 | BMY 5Y | BRISTOL MYERS SQUIBB CO | 21.8% | 8 | 42 | 34 | 7 |
| 3 | STANLNBK HOLDCO 5Y | STANDARD CHARTERED BK | 15.6% | 14 | 101 | 87 | 4 |
| 4 | ALTRIA 5Y | ALTRIA GROUP INC | 13.4% | 8 | 72 | 63 | 5 |
| 5 | RMK 5Y | ARAMARK CORP | 13.0% | 22 | 191 | 169 | 5 |
| 6 | IGT 5Y | INTERNATIONAL GAME TECHNOLOGY | 12.7% | 24 | 213 | 189 | 3 |
| 7 | CCOH 5Y | CCO HOLDINGS LLC | 11.7% | 32 | 304 | 272 | 4 |
| 8 | RCL 5Y | ROYAL CARIBBEAN CRUISES LTD | 11.5% | 39 | 374 | 335 | 6 |
| 9 | DANBNK 5Y | DANSKE BK A/S MEDIUM TERM NTS | 11.4% | 7 | 70 | 63 | 4 |
| 10 | MTG 5Y | MGIC INVT CORP | 10.5% | 17 | 180 | 163 | 6 |
Normalized HY Spread by Region
Displays the HY CDS spread by region between 10/1/23 – 10/31/23 Results are based on 5 select regions, however, we offer data across 12 regions
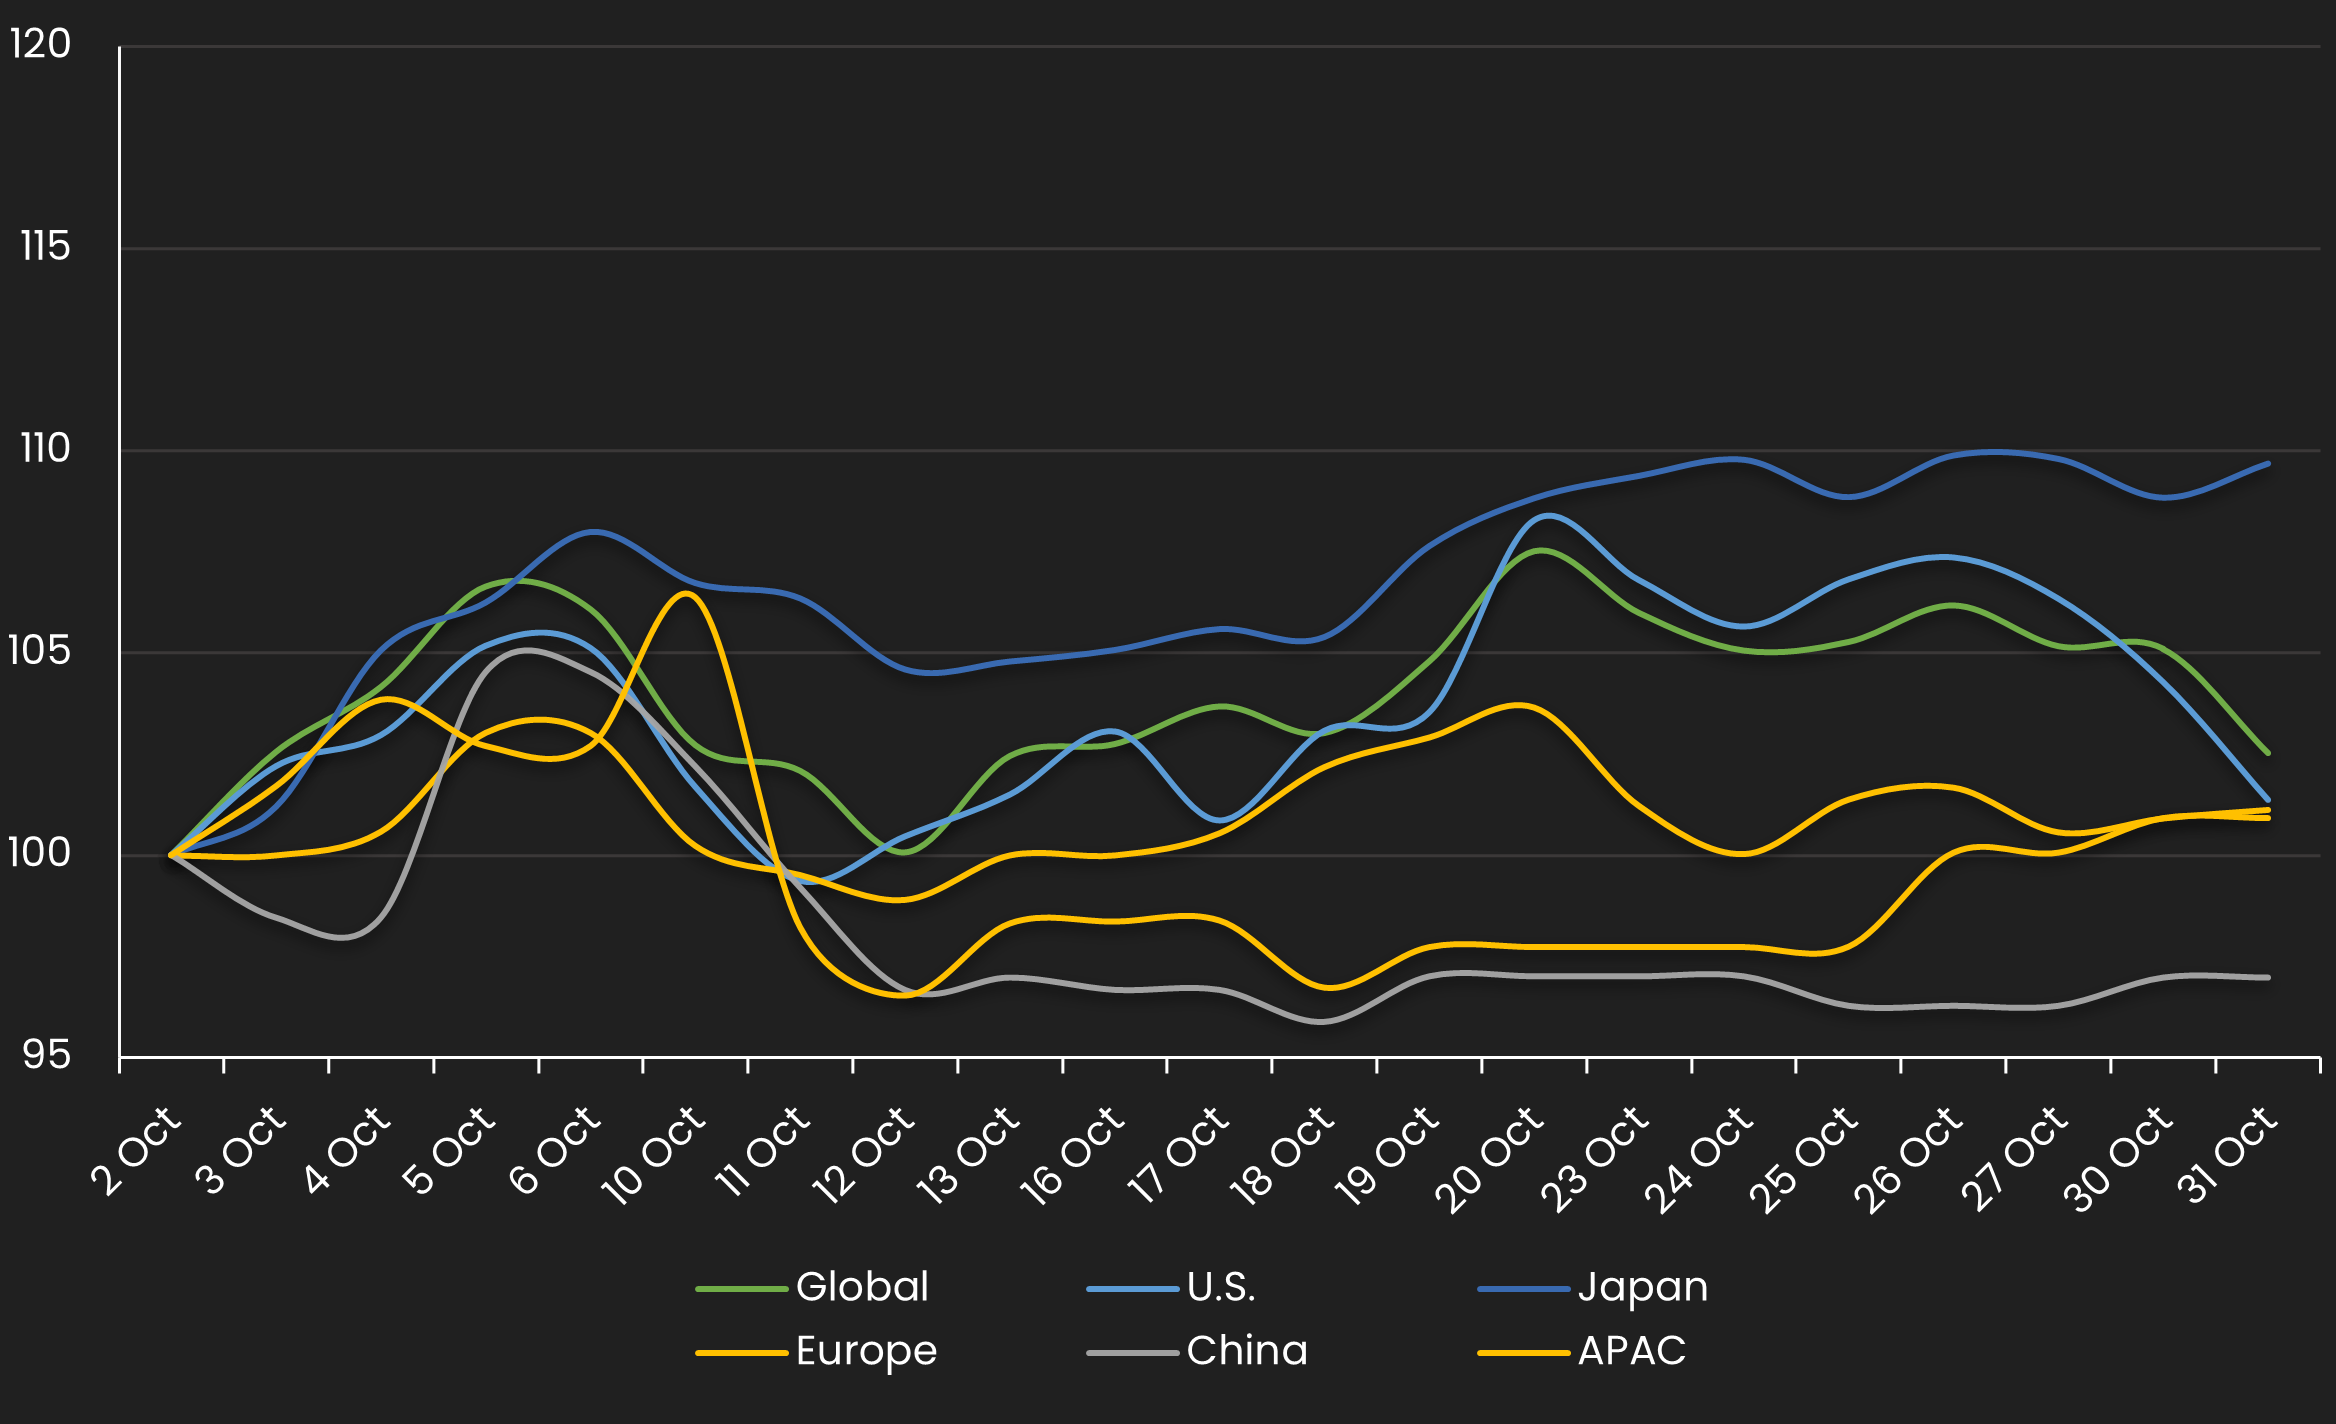
HY Spread by Region – Monthly Comparison
Exhibits the HY mid spread by region for the month ending 9/30/23 vs. the month ending 10/31/23
| REGION | PREVIOUS SPREAD | CURRENT SPREAD | BPS CHANGE | MONTHLY PERFORMANCE | CDS COUNT |
|---|---|---|---|---|---|
| Global | 157 | 161 | 4 | Wider | 249 |
| U.S. | 155 | 157 | 2 | Wider | 131 |
| Europe | 165 | 167 | 2 | Wider | 58 |
| Canada | 130 | 130 | 0 | Unchanged | 7 |
| China | 125 | 121 | -4 | Tighter | 3 |
| MENA | 376 | 368 | -8 | Tighter | 18 |
Normalized HY Spread by Industry
Displays the HY CDS spread by industry between 10/1/23 – 10/31/23 Results are based on 5 select industry sectors, however, we offer data across 36 sectors
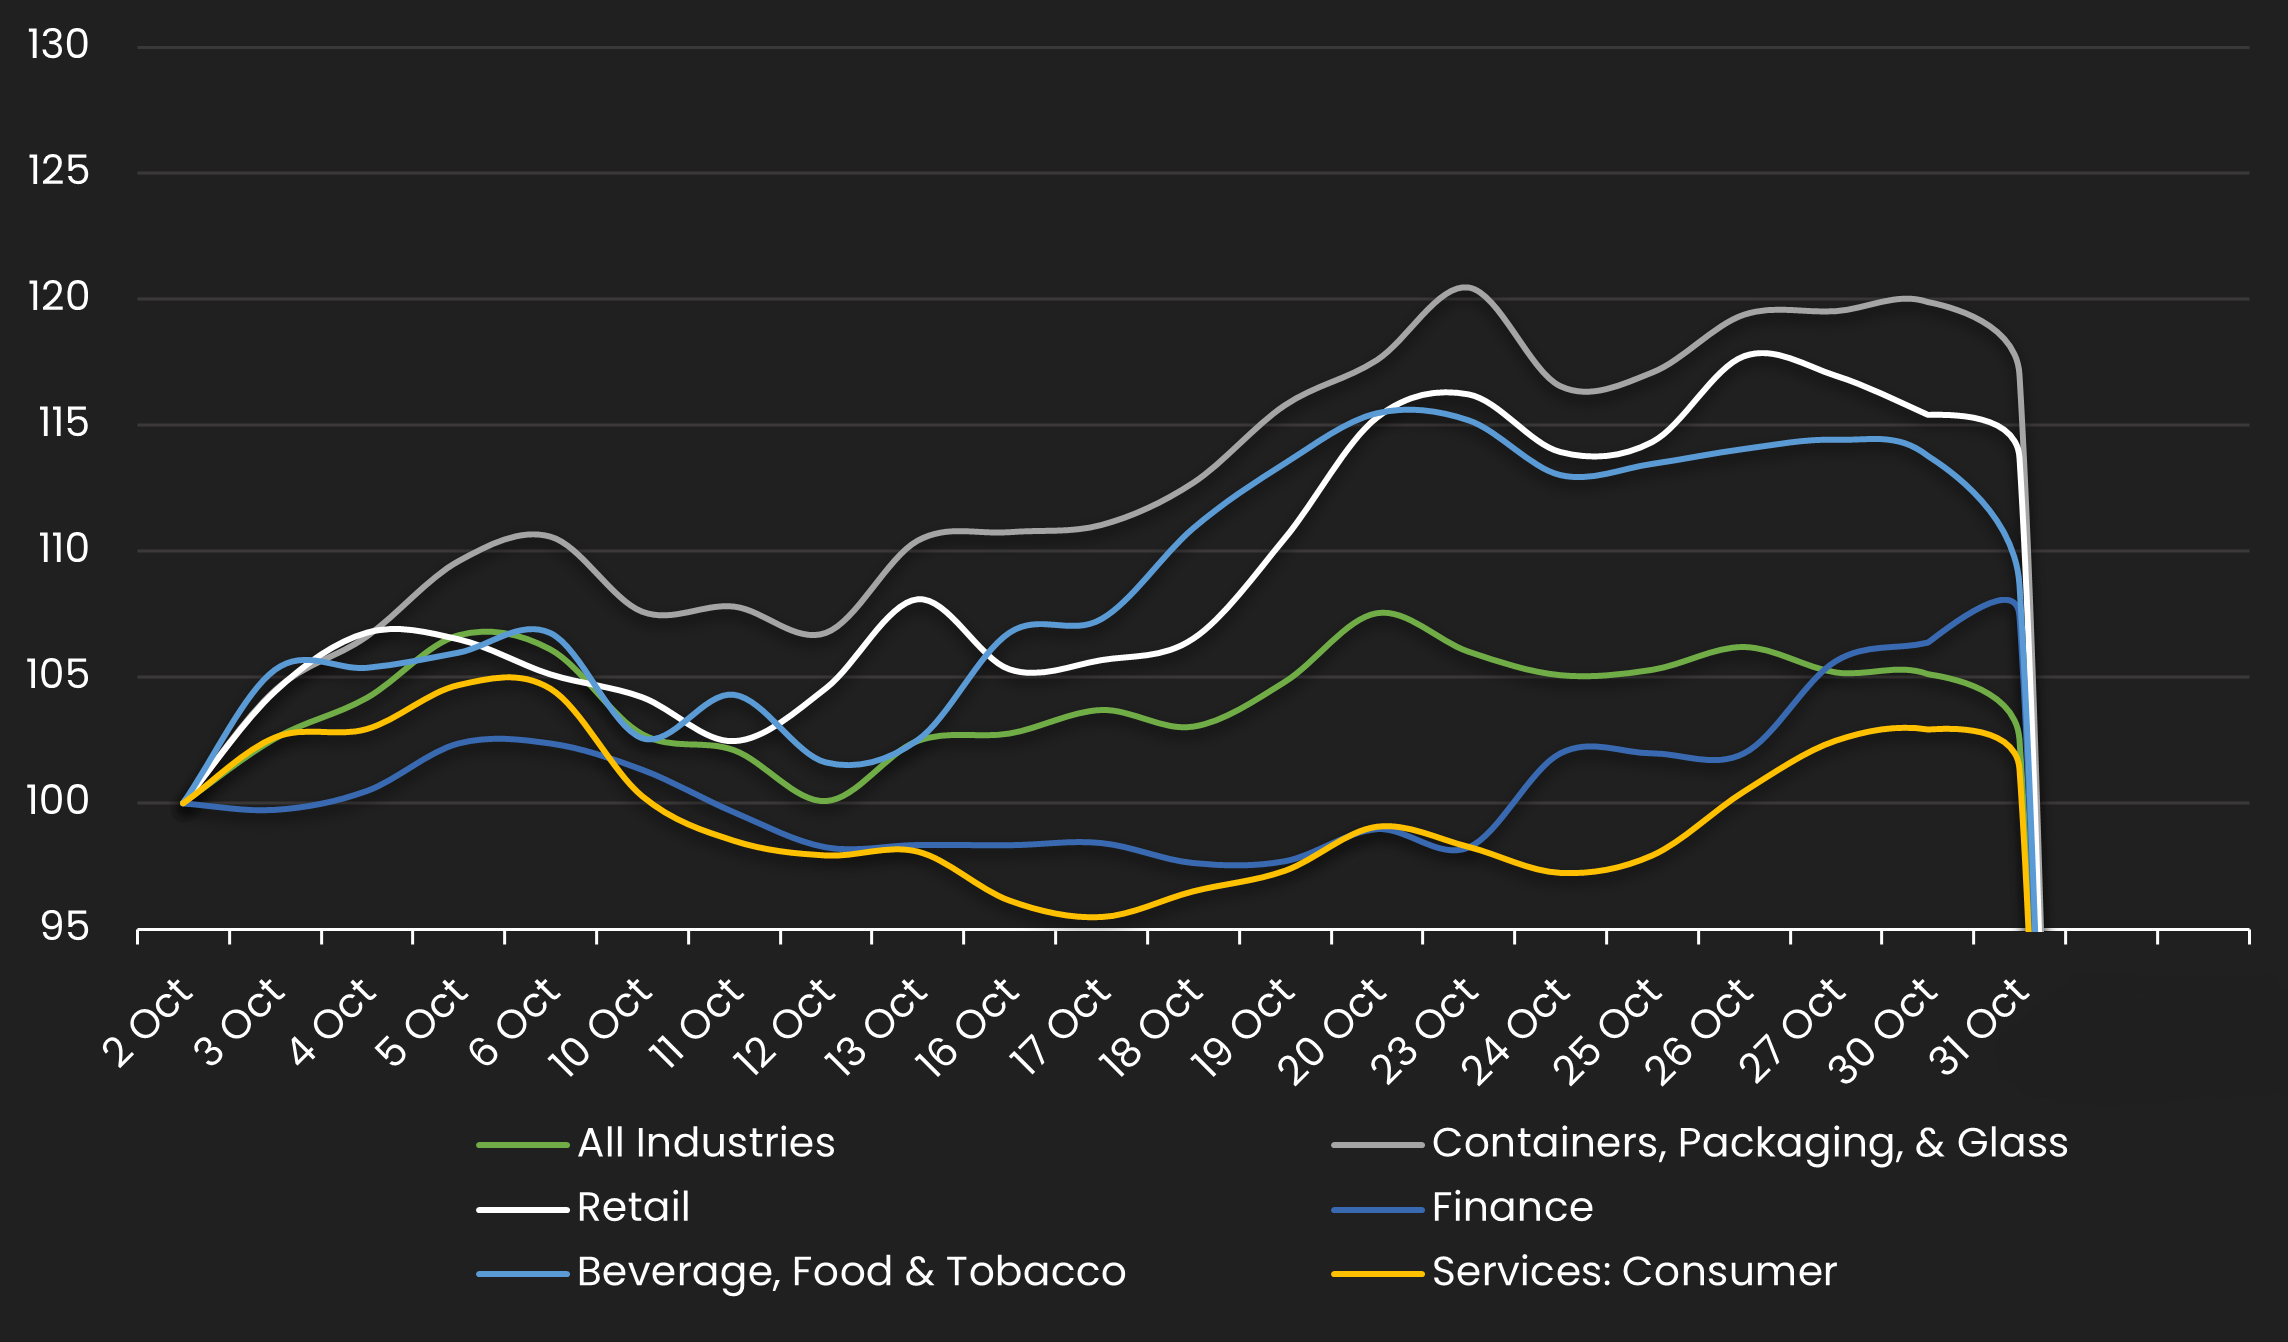
HY Spread by Industries – Monthly Comparison
Exhibits the HY spread by industry for the month ending 9/30/23 vs. the month ending 10/31/23
| INDUSTRIES | PREVIOUS SPREAD | CURRENT SPREAD | BPS CHANGE | MONTHLY PERFORMANCE | CDS COUNT |
|---|---|---|---|---|---|
| All Industries | 157 | 161 | 4 | Wider | 0 |
| Containers, Packaging, & Glass | 194 | 227 | 33 | Wider | 0 |
| Retail | 96 | 110 | 13 | Wider | 0 |
| Finance | 127 | 137 | 9 | Wider | 0 |
| Beverage, Food & Tobacco | 97 | 106 | 8 | Wider | 0 |
| Services: Consumer | 319 | 323 | 4 | Wider | 0 |
Stay up-to-date with monthly summaries.
Related Resources
About SOLVE
SOLVE is the leading market data platform provider for fixed-income securities, trusted by sophisticated buy-side and sell-side firms worldwide. Founded in 2011, SOLVE leverages its AI-driven technology and deep industry expertise to offer unparalleled transparency into markets, reduce risk, and save hundreds of hours across front-office workflows. With the largest real-time datasets for Securitized Products, Municipal Bonds, Corporate Bonds, Syndicated Bank Loans, Convertible Bonds, CDS, and Private Credit, SOLVE empowers clients to transform the way they bring new securities to market, trade on secondary markets, and value highly illiquid securities. Headquartered in Connecticut, with offices across the globe, SOLVE is the definitive source for market pricing in fixed-income markets.
