High Yield CDS Market Summary – May 2025
GET OUR CDS MARKET SUMMARIES STRAIGHT TO YOUR INBOX. LEARN MORE
High Yield CDS Market Summary: May 2025
Our newsletter presents key trends derived from observable Credit Default Swaps pricing data over a monthly period.
Top 10 Outperformers
Showcases the top 10 HY CDS “outperformers” based on the largest mid spread decreases between 5/1/25 – 5/31/25
| RANK | BOND NAME | ISSUER | % CHANGE | BPS CHANGE | SPRD | SPRD-1 MONTH | DEALERS |
|---|---|---|---|---|---|---|---|
| 1 | X 5Y | TRANSTAR HLDGS INC | -65.4% | -118 | 62 | 181 | 5 |
| 2 | AVNT 5Y | AVIENT CORP | -42.2% | -75 | 102 | 177 | 3 |
| 3 | IPGIM 5Y | SALINI IMPREGILO | -40.5% | -104 | 153 | 258 | 3 |
| 4 | NCX 5Y | NOVA CHEMS LTD | -39.5% | -57 | 88 | 145 | 3 |
| 5 | IRM 5Y | IRON MOUNTAIN INCORPORATED | -37.9% | -48 | 79 | 127 | 3 |
| 6 | LPX 5Y | LP PINEWOOD SPV LLC | -37.3% | -36 | 61 | 97 | 3 |
| 7 | CCLLN 5Y | CARNIVAL PLC | -36.0% | -89 | 157 | 246 | 4 |
| 8 | OLN 5Y | OLIN CORP | -35.0% | -102 | 189 | 291 | 3 |
| 9 | AMKR 5Y | AMKOR TECHNOLOGY INC | -33.3% | -40 | 80 | 121 | 3 |
| 10 | HLT 5Y | HILTON HOTELS CORP | -32.5% | -38 | 78 | 115 | 2 |
Top 10 Underperformers
Showcases the top 10 HY CDS “underperformers” based on the largest mid spread increases between 5/1/25 – 5/31/25
| RANK | BOND NAME | ISSUER | % CHANGE | BPS CHANGE | SPREAD | SPREAD-1 MONTH | DEALERS |
|---|---|---|---|---|---|---|---|
| 1 | THYELE HOLDCO 5Y | VERTICAL MIDCO GMBH | 100.1% | 55075 | 110115 | 55040 | 1 |
| 2 | CLF 5Y | CLIFFS NAT RES INC | 26.0% | 106 | 515 | 409 | 3 |
| 3 | ZIGGO 5Y | ZIGGO HOLDING BV | 18.9% | 77 | 487 | 410 | 4 |
| 4 | BGG 5Y | BRIGGS & STRATTON CORP | 11.8% | 25 | 237 | 212 | 1 |
| 5 | SUN 5Y | SUN INC | 11.1% | 30 | 300 | 270 | 1 |
| 6 | BANSAB 5Y | TRANSATLANTIC BK MIAMI FLA | 9.9% | 5 | 58 | 53 | 3 |
| 7 | HDSUPP 5Y | HD SUPPLY INC | 8.4% | 4 | 52 | 48 | 1 |
| 8 | PPFTEL 5Y | PPF TELECOM GROUP BV | 2.9% | 2 | 60 | 58 | 2 |
| 9 | MATTER 5Y | ORANGE COMMUNICATIONS | 2.3% | 5 | 220 | 215 | 1 |
| 10 | CEMEX 5Y | CEMEX SAB DE CV | 1.5% | 3 | 165 | 162 | 1 |
Normalized HY Spread by Region
Displays the HY CDS spread by region between 5/1/25 – 5/31/25 Results are based on 5 select regions, however, we offer data across 12 regions

HY Spread by Region – Monthly Comparison
Exhibits the HY mid spread by region for the month ending 4/30/24 vs. the month ending 5/31/25
| REGION | PREVIOUS SPREAD | CURRENT SPREAD | BPS CHANGE | MONTHLY PERFORMANCE | CDS COUNT |
|---|---|---|---|---|---|
| Global | 174 | 142 | -32 | Tighter | 182 |
| U.S. | 175 | 136 | -39 | Tighter | 95 |
| U.K. | 162 | 130 | -32 | Tighter | 16 |
| Canada | 110 | 81 | -29 | Tighter | 2 |
| China | 129 | 101 | -28 | Tighter | 1 |
| APAC | 121 | 98 | -22 | Tighter | 1 |
Normalized HY Spread by Industry
Displays the HY CDS spread by industry between 5/1/25 – 5/31/25 Results are based on 5 select industry sectors, however, we offer data across 36 sectors
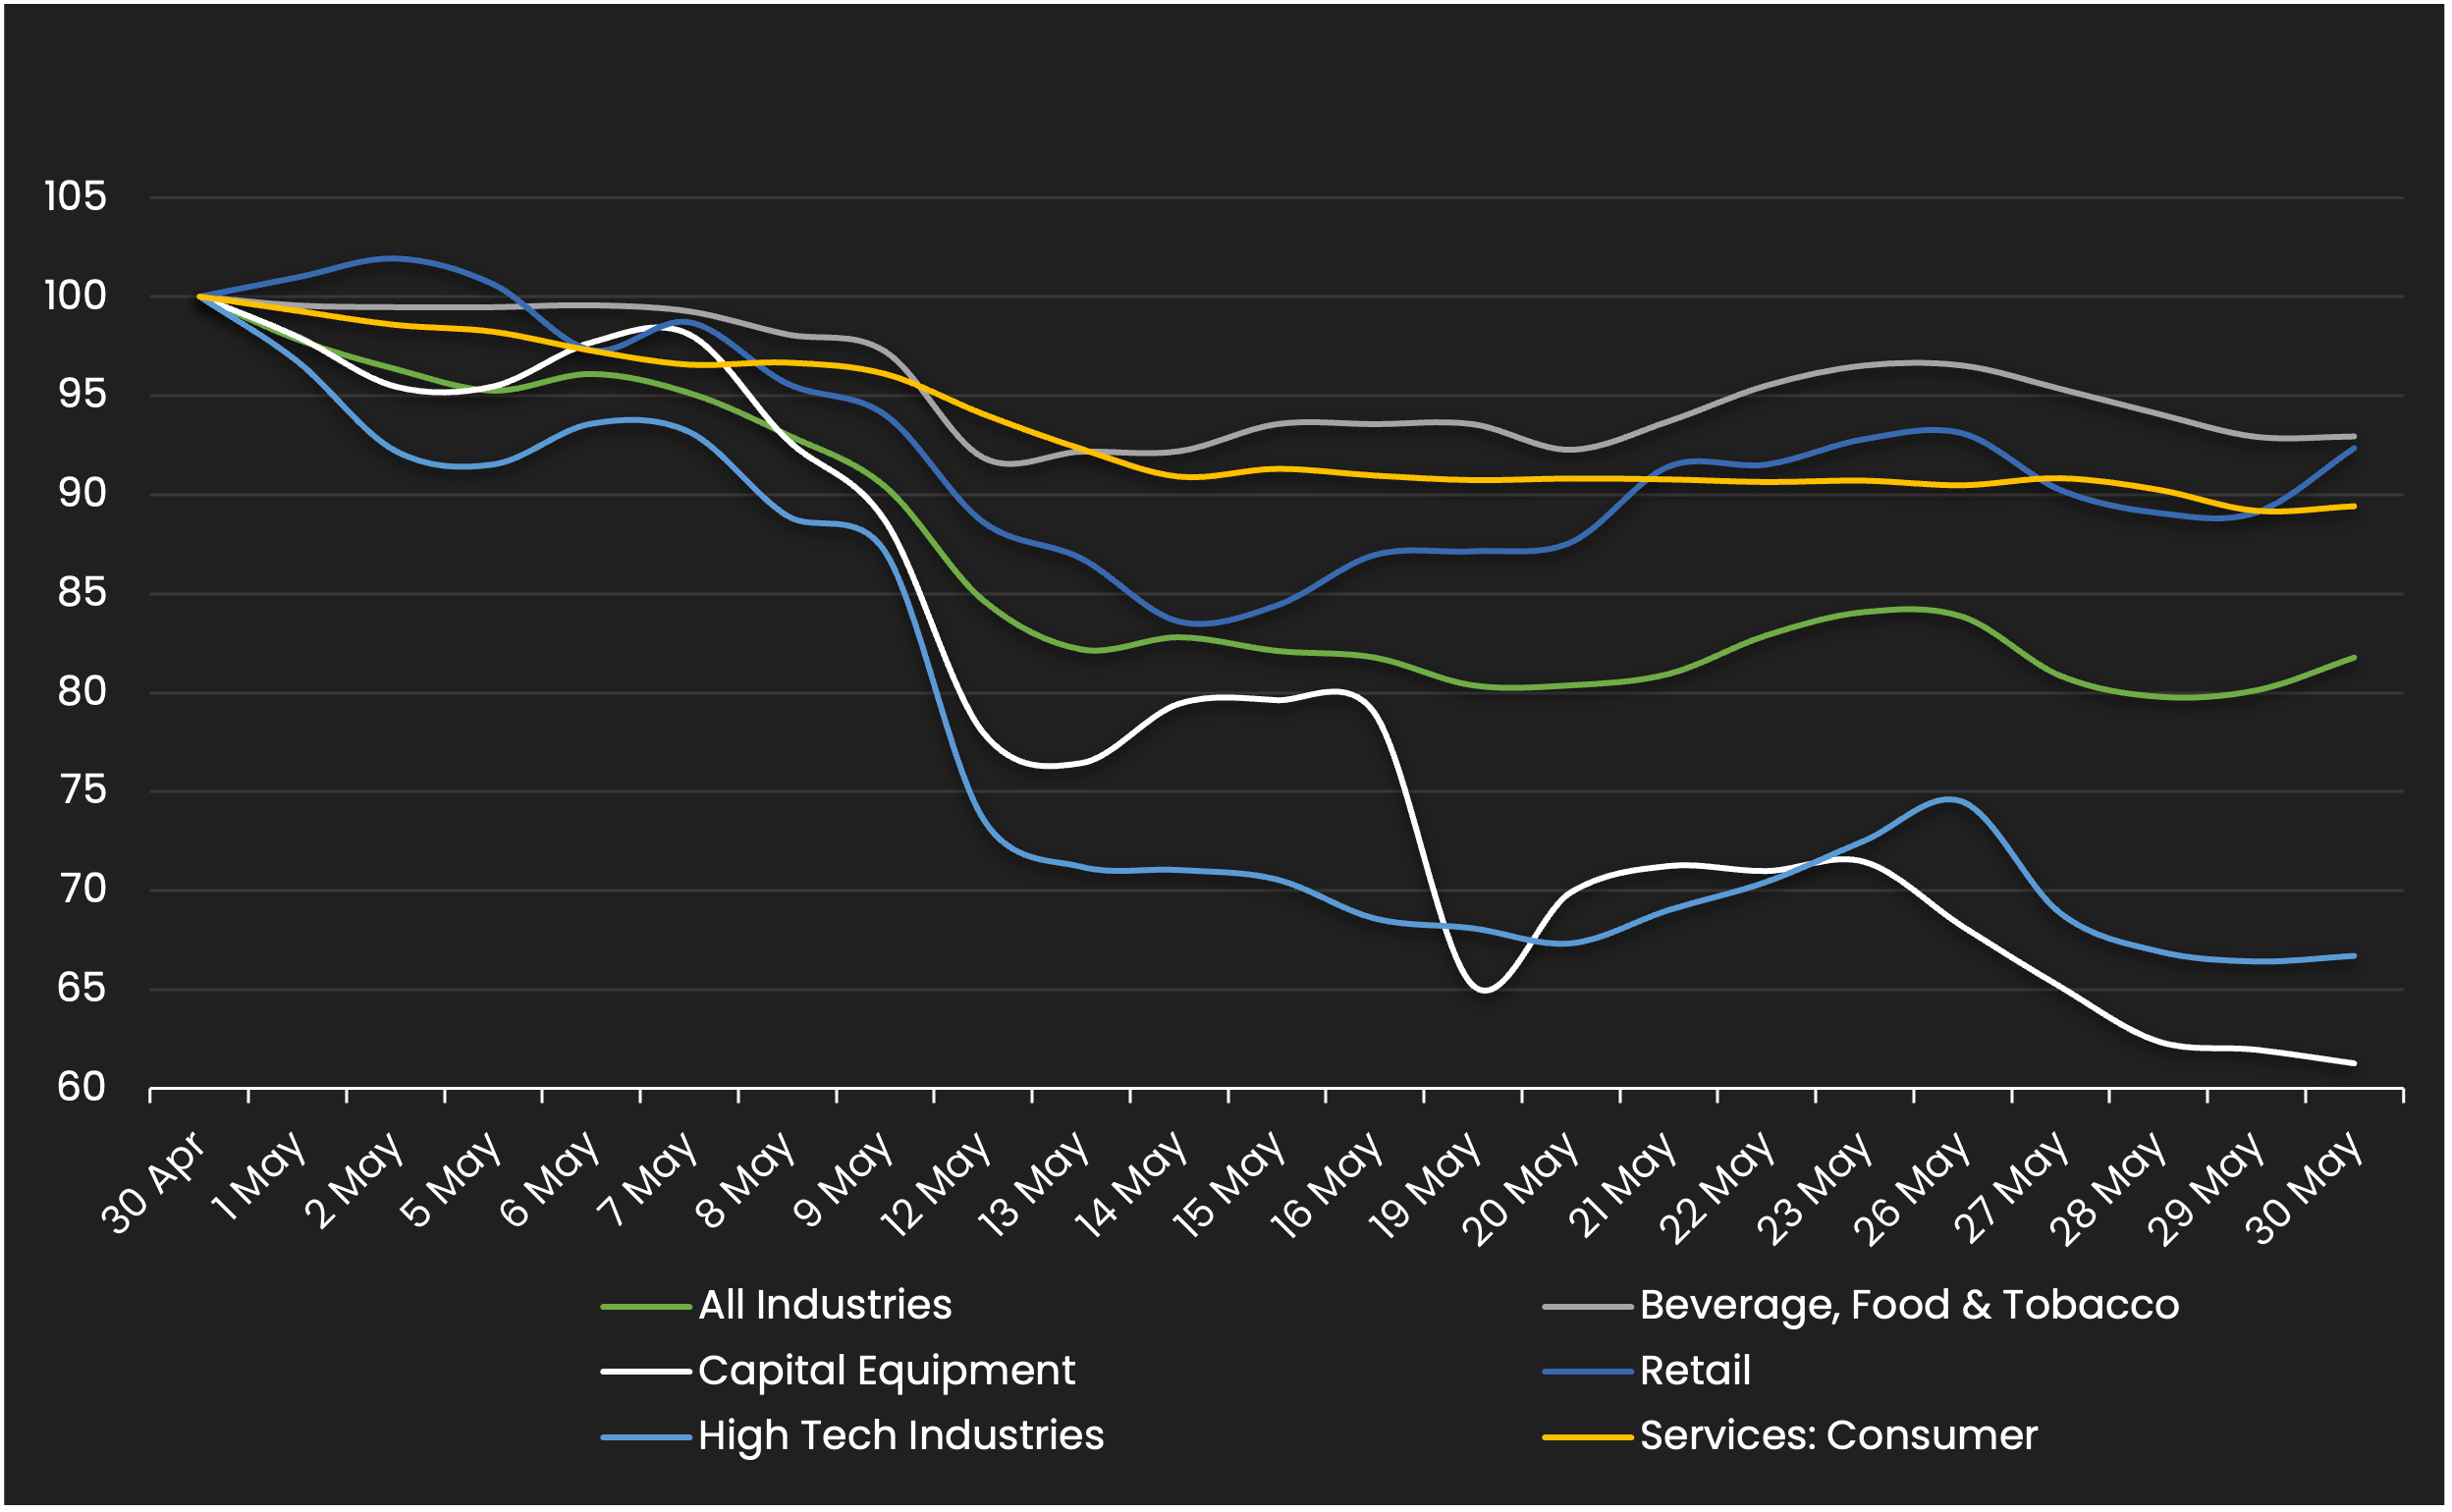
HY Spread by Industries – Monthly Comparison
Exhibits the HY spread by industry for the month ending 4/30/24 vs. the month ending 5/31/25
| INDUSTRIES | PREVIOUS SPREAD | CURRENT SPREAD | BPS CHANGE | MONTHLY PERFORMANCE | CDS COUNT |
|---|---|---|---|---|---|
| All Industries | 174 | 142 | -32 | Tighter | 182.00 |
| Beverage, Food & Tobacco | 256 | 238 | -18 | Tighter | 7.00 |
| Capital Equipment | 230 | 141 | -89 | Tighter | 5.00 |
| Retail | 153 | 141 | -12 | Tighter | 16.00 |
| High Tech Industries | 121 | 80 | -40 | Tighter | 5.00 |
| Services: Consumer | 211 | 188 | -22 | Tighter | 4.00 |
Stay up-to-date with monthly summaries.
Related Resources
About SOLVE
SOLVE is the leading market data platform provider for fixed-income securities, trusted by sophisticated buy-side and sell-side firms worldwide. Founded in 2011, SOLVE leverages its AI-driven technology and deep industry expertise to offer unparalleled transparency into markets, reduce risk, and save hundreds of hours across front-office workflows. With the largest real-time datasets for Securitized Products, Municipal Bonds, Corporate Bonds, Syndicated Bank Loans, Convertible Bonds, CDS, and Private Credit, SOLVE empowers clients to transform the way they bring new securities to market, trade on secondary markets, and value highly illiquid securities. Headquartered in Connecticut, with offices across the globe, SOLVE is the definitive source for market pricing in fixed-income markets.
