High Yield CDS Market Summary – May 2024
GET OUR CDS MARKET SUMMARIES STRAIGHT TO YOUR INBOX. LEARN MORE
High Yield CDS Market Summary:may 2024
Our newsletter presents key trends derived from observable Credit Default Swaps pricing data over a monthly period.
Top 10 Outperformers
Showcases the top 10 HY CDS “outperformers” based on the largest mid spread decreases between 5/1/24 – 5/31/24
| RANK | BOND NAME | ISSUER | % CHANGE | BPS CHANGE | SPRD | SPRD-1 MONTH | DEALERS |
|---|---|---|---|---|---|---|---|
| 1 | SEE 5Y | SEALED AIR CORP NEW | -33.5% | -54 | 107 | 160 | 4 |
| 2 | NVFVES 5Y | NOVAFIVES SAS | -32.2% | -74 | 156 | 231 | 3 |
| 3 | NCX 5Y | NOVA CHEMS LTD | -28.5% | -90 | 224 | 314 | 3 |
| 4 | ADRBID 5Y | UNITED GROUP BV | -27.7% | -96 | 250 | 345 | 5 |
| 5 | BOMB 5Y | BOMBARDIER CAP TR | -22.6% | -52 | 177 | 229 | 3 |
| 6 | FTI 5Y | TECHNIPFMC PLC | -22.0% | -52 | 184 | 236 | 3 |
| 7 | ZFFNGR 5Y | ZF NA CAPITAL | -21.7% | -49 | 179 | 228 | 2 |
| 8 | INEGRP 5Y | INEOS FIN PLC | -19.7% | -33 | 135 | 168 | 3 |
| 9 | SAIBV 5Y | SAIPEM FINANCE INTERNATIONAL BV | -19.0% | -33 | 141 | 174 | 4 |
| 10 | GPS 5Y | GAP INC | -18.3% | -39 | 174 | 213 | 5 |
Top 10 Underperformers
Showcases the top 10 HY CDS “underperformers” based on the largest mid spread increases between 5/1/24 – 5/31/24
| RANK | BOND NAME | ISSUER | % CHANGE | BPS CHANGE | SPREAD | SPREAD-1 MONTH | DEALERS |
|---|---|---|---|---|---|---|---|
| 1 | SCFER 5Y | SCHAEFFLER FINANCE BV | 15.1% | 19 | 148 | 129 | 2 |
| 2 | NIDHEA 5Y | STADA ARZNEIMITTEL AG | 12.2% | 21 | 196 | 175 | 3 |
| 3 | OI 5Y | OI EUROPEAN GROUP BV | 9.7% | 22 | 245 | 223 | 4 |
| 4 | SIRI 5Y | SCS HOLDINGS INC | 8.1% | 17 | 225 | 208 | 3 |
| 5 | X 5Y | TRANSTAR HLDGS INC | 7.3% | 9 | 138 | 129 | 5 |
| 6 | NMAC 5Y | NISSAN MTR ACCEP CORP | 6.2% | 6 | 104 | 98 | 3 |
| 7 | CCLLN 5Y | CARNIVAL PLC | 5.9% | 14 | 259 | 245 | 4 |
| 8 | RMK 5Y | ARAMARK CORP | 5.2% | 6 | 116 | 111 | 4 |
| 9 | NWL 5Y | NEWELL RUBBERMAID INC MEDIUM | 4.3% | 15 | 360 | 345 | 4 |
| 10 | CLF 5Y | CLIFFS NAT RES INC | 3.3% | 6 | 179 | 174 | 4 |
Normalized HY Spread by Region
Displays the HY CDS spread by region between 5/1/24 – 5/31/24 Results are based on 5 select regions, however, we offer data across 12 regions
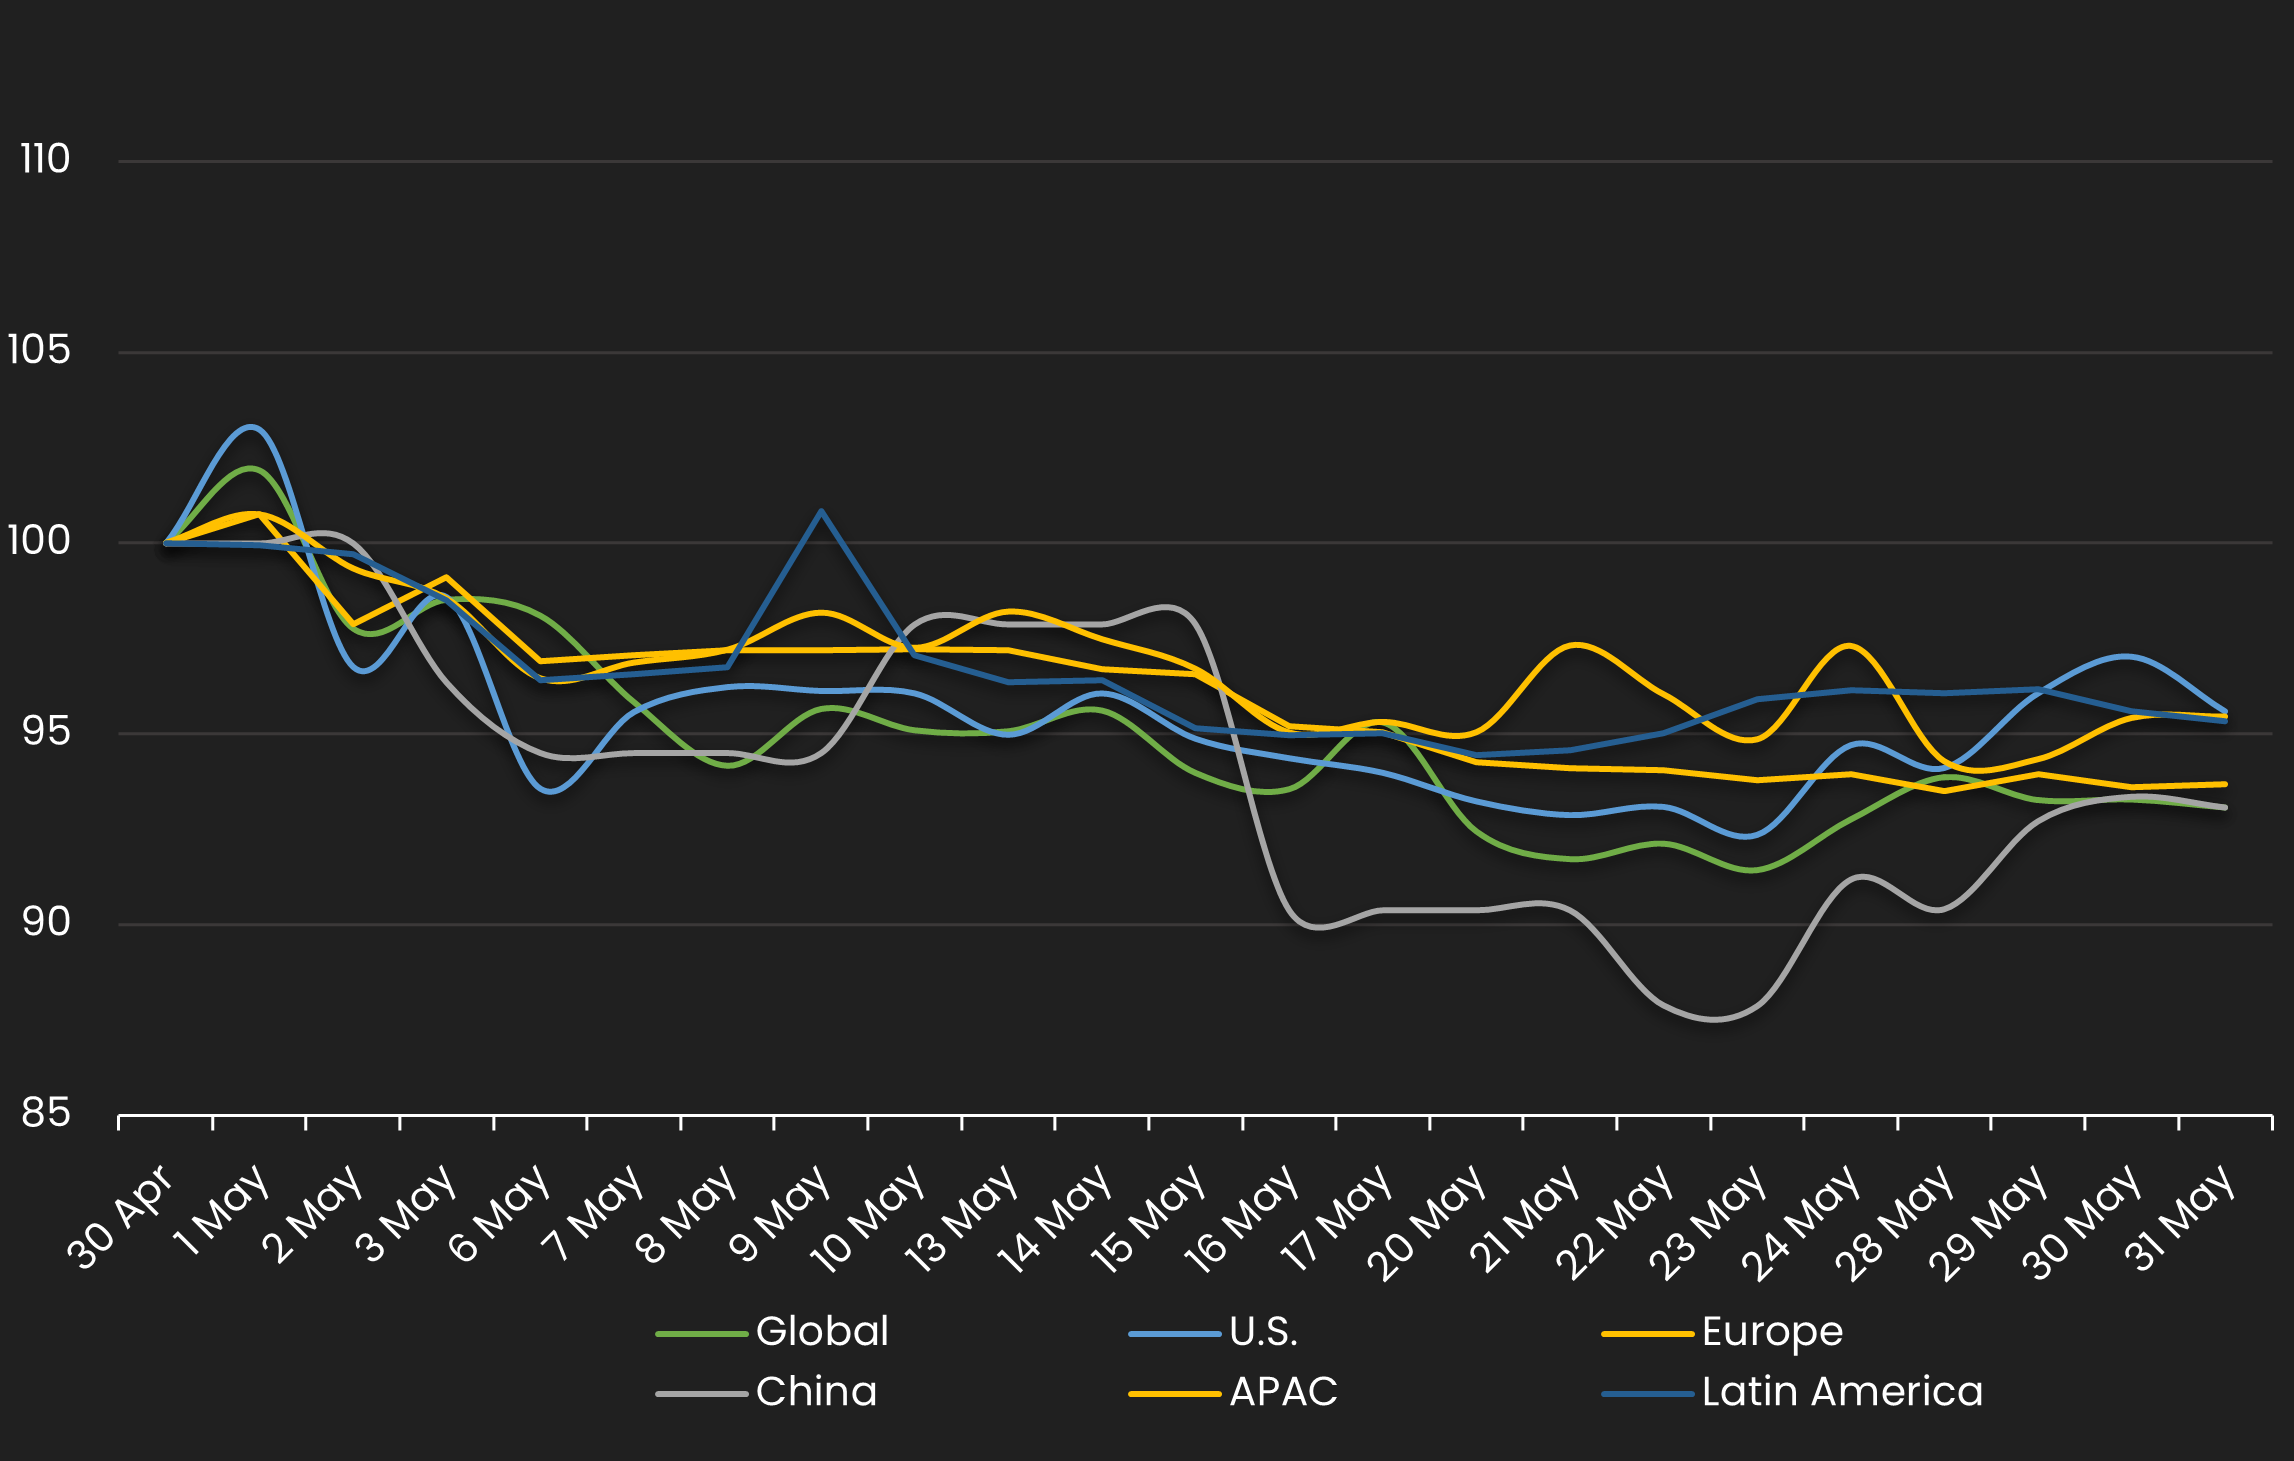
HY Spread by Region – Monthly Comparison
Exhibits the HY mid spread by region for the month ending 4/30/24 vs. the month ending 5/31/24
| REGION | PREVIOUS SPREAD | CURRENT SPREAD | BPS CHANGE | MONTHLY PERFORMANCE | CDS COUNT |
|---|---|---|---|---|---|
| Global | 147 | 137 | -10 | Tighter | 183 |
| U.S. | 141 | 134 | -6 | Tighter | 96 |
| Europe | 155 | 145 | -10 | Tighter | 50 |
| China | 83 | 77 | -6 | Tighter | 1 |
| APAC | 118 | 113 | -5 | Tighter | 1 |
| Latin America | 179 | 170 | -8 | Tighter | 4 |
Normalized HY Spread by Industry
Displays the HY CDS spread by industry between 5/1/24 – 5/31/24 Results are based on 5 select industry sectors, however, we offer data across 36 sectors
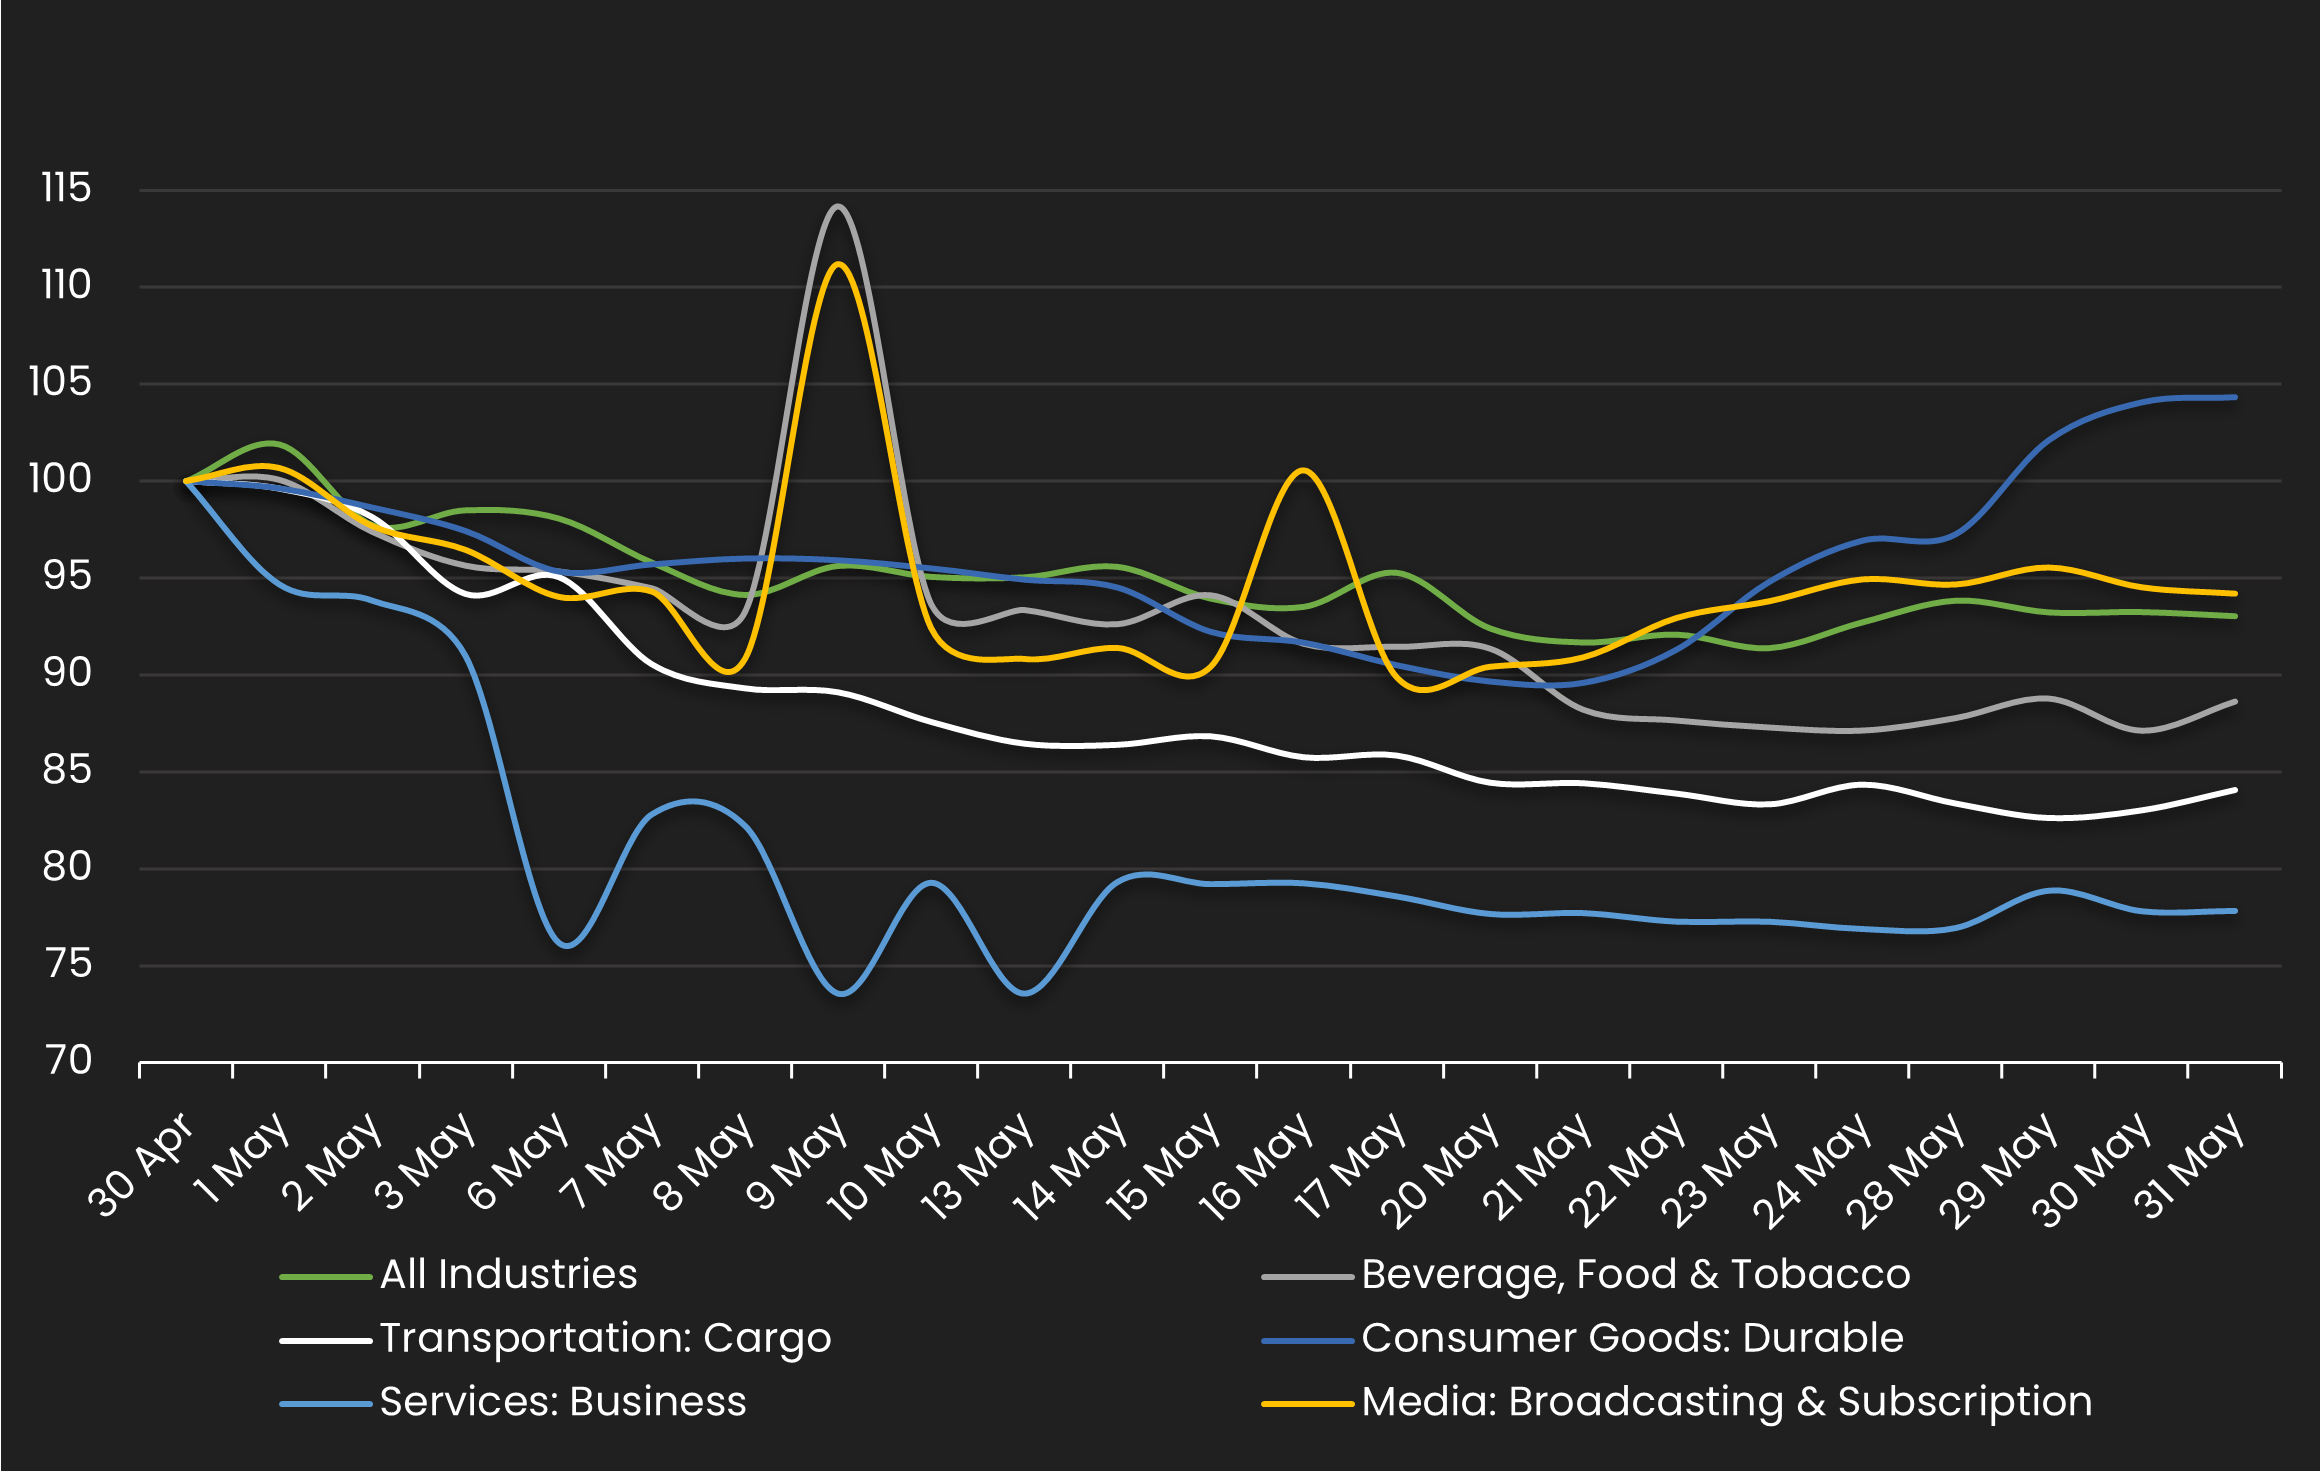
HY Spread by Industries – Monthly Comparison
Exhibits the HY spread by industry for the month ending 4/30/24 vs. the month ending 5/31/24
| INDUSTRIES | PREVIOUS SPREAD | CURRENT SPREAD | BPS CHANGE | MONTHLY PERFORMANCE | CDS COUNT |
|---|---|---|---|---|---|
| All Industries | 147 | 137 | -10 | Tighter | 183 |
| Beverage, Food & Tobacco | 185 | 164 | -21 | Tighter | 5 |
| Transportation: Cargo | 216 | 182 | -34 | Tighter | 3 |
| Consumer Goods: Durable | 345 | 360 | 15 | Wider | 1 |
| Services: Business | 190 | 148 | -42 | Tighter | 2 |
| Media: Broadcasting & Subscription | 325 | 306 | -19 | Tighter | 5 |
Stay up-to-date with monthly summaries.
Related Resources
About SOLVE
SOLVE is the leading market data platform provider for fixed-income securities, trusted by sophisticated buy-side and sell-side firms worldwide. Founded in 2011, SOLVE leverages its AI-driven technology and deep industry expertise to offer unparalleled transparency into markets, reduce risk, and save hundreds of hours across front-office workflows. With the largest real-time datasets for Securitized Products, Municipal Bonds, Corporate Bonds, Syndicated Bank Loans, Convertible Bonds, CDS, and Private Credit, SOLVE empowers clients to transform the way they bring new securities to market, trade on secondary markets, and value highly illiquid securities. Headquartered in Connecticut, with offices across the globe, SOLVE is the definitive source for market pricing in fixed-income markets.
