High Yield CDS Market Summary – March 2025
GET OUR CDS MARKET SUMMARIES STRAIGHT TO YOUR INBOX. LEARN MORE
High Yield CDS Market Summary: March 2025
Our newsletter presents key trends derived from observable Credit Default Swaps pricing data over a monthly period.
Top 10 Outperformers
Showcases the top 10 HY CDS “outperformers” based on the largest mid spread decreases between 3/1/25 – 3/31/25
| RANK | BOND NAME | ISSUER | % CHANGE | BPS CHANGE | SPRD | SPRD-1 MONTH | DEALERS |
|---|---|---|---|---|---|---|---|
| 1 | NCX 5Y | NOVA CHEMS LTD | -16.6% | -18 | 88 | 106 | 3 |
| 2 | BCPPL 5Y | BANCO COMERCIAL PORTUGUES SA | -9.1% | -10 | 100 | 110 | 1 |
| 3 | BAMIIM 5Y | BANCO POPOLARE SC | -8.3% | -5 | 55 | 60 | 1 |
| 4 | ATCNA 5Y | ALTICE LUXEMBOURG SA | -7.7% | -6 | 66 | 72 | 1 |
| 5 | SAPSJ 5Y | PE PAPER ESCROW GMBH | -5.6% | -10 | 170 | 180 | 1 |
| 6 | NVFVES 5Y | NOVAFIVES SAS | -5.5% | -6 | 100 | 106 | 3 |
| 7 | CEMEX 5Y | CEMEX SAB DE CV | -4.4% | -8 | 172 | 180 | 1 |
| 8 | BRADES 5Y | BANCO BRADESCO S A GRAND | -2.3% | -6 | 253 | 259 | 2 |
| 9 | SINOPE 5Y | SONANGOL EP | -1.6% | -1 | 57 | 57 | 4 |
| 10 | MONTE 5Y | BANCA ANTONVENETA SPA/OLD | -1.1% | -1 | 70 | 71 | 1 |
Top 10 Underperformers
Showcases the top 10 HY CDS “underperformers” based on the largest mid spread increases between 3/1/25 – 3/31/25
| RANK | BOND NAME | ISSUER | % CHANGE | BPS CHANGE | SPREAD | SPREAD-1 MONTH | DEALERS |
|---|---|---|---|---|---|---|---|
| 1 | UAL 5Y | UNITED CONTINENTAL HOLDINGS INC | 81.1% | 127 | 283 | 156 | 3 |
| 2 | CZR 5Y | CAESARS ENTERTAINMENT OP | 69.5% | 119 | 289 | 171 | 3 |
| 3 | TECHEM 5Y | TECHEM GMBH | 65.5% | 82 | 207 | 125 | 2 |
| 4 | BYD 5Y | BOYD GAMING CORP | 57.2% | 63 | 173 | 110 | 3 |
| 5 | CCLLN 5Y | CARNIVAL PLC | 52.0% | 72 | 210 | 138 | 4 |
| 6 | AGFC 5Y | AGFC CAP TR I | 49.8% | 84 | 251 | 168 | 3 |
| 7 | CLF 5Y | CLIFFS NAT RES INC | 48.9% | 127 | 387 | 260 | 3 |
| 8 | HPLGR 5Y | HAPAG-LLOYD A G | 45.8% | 68 | 215 | 148 | 3 |
| 9 | BZH 5Y | BEAZER HOMES USA INC | 45.5% | 135 | 432 | 297 | 3 |
| 10 | SEE 5Y | SEALED AIR CORP NEW | 44.4% | 47.3 | 154 | 106 | 3 |
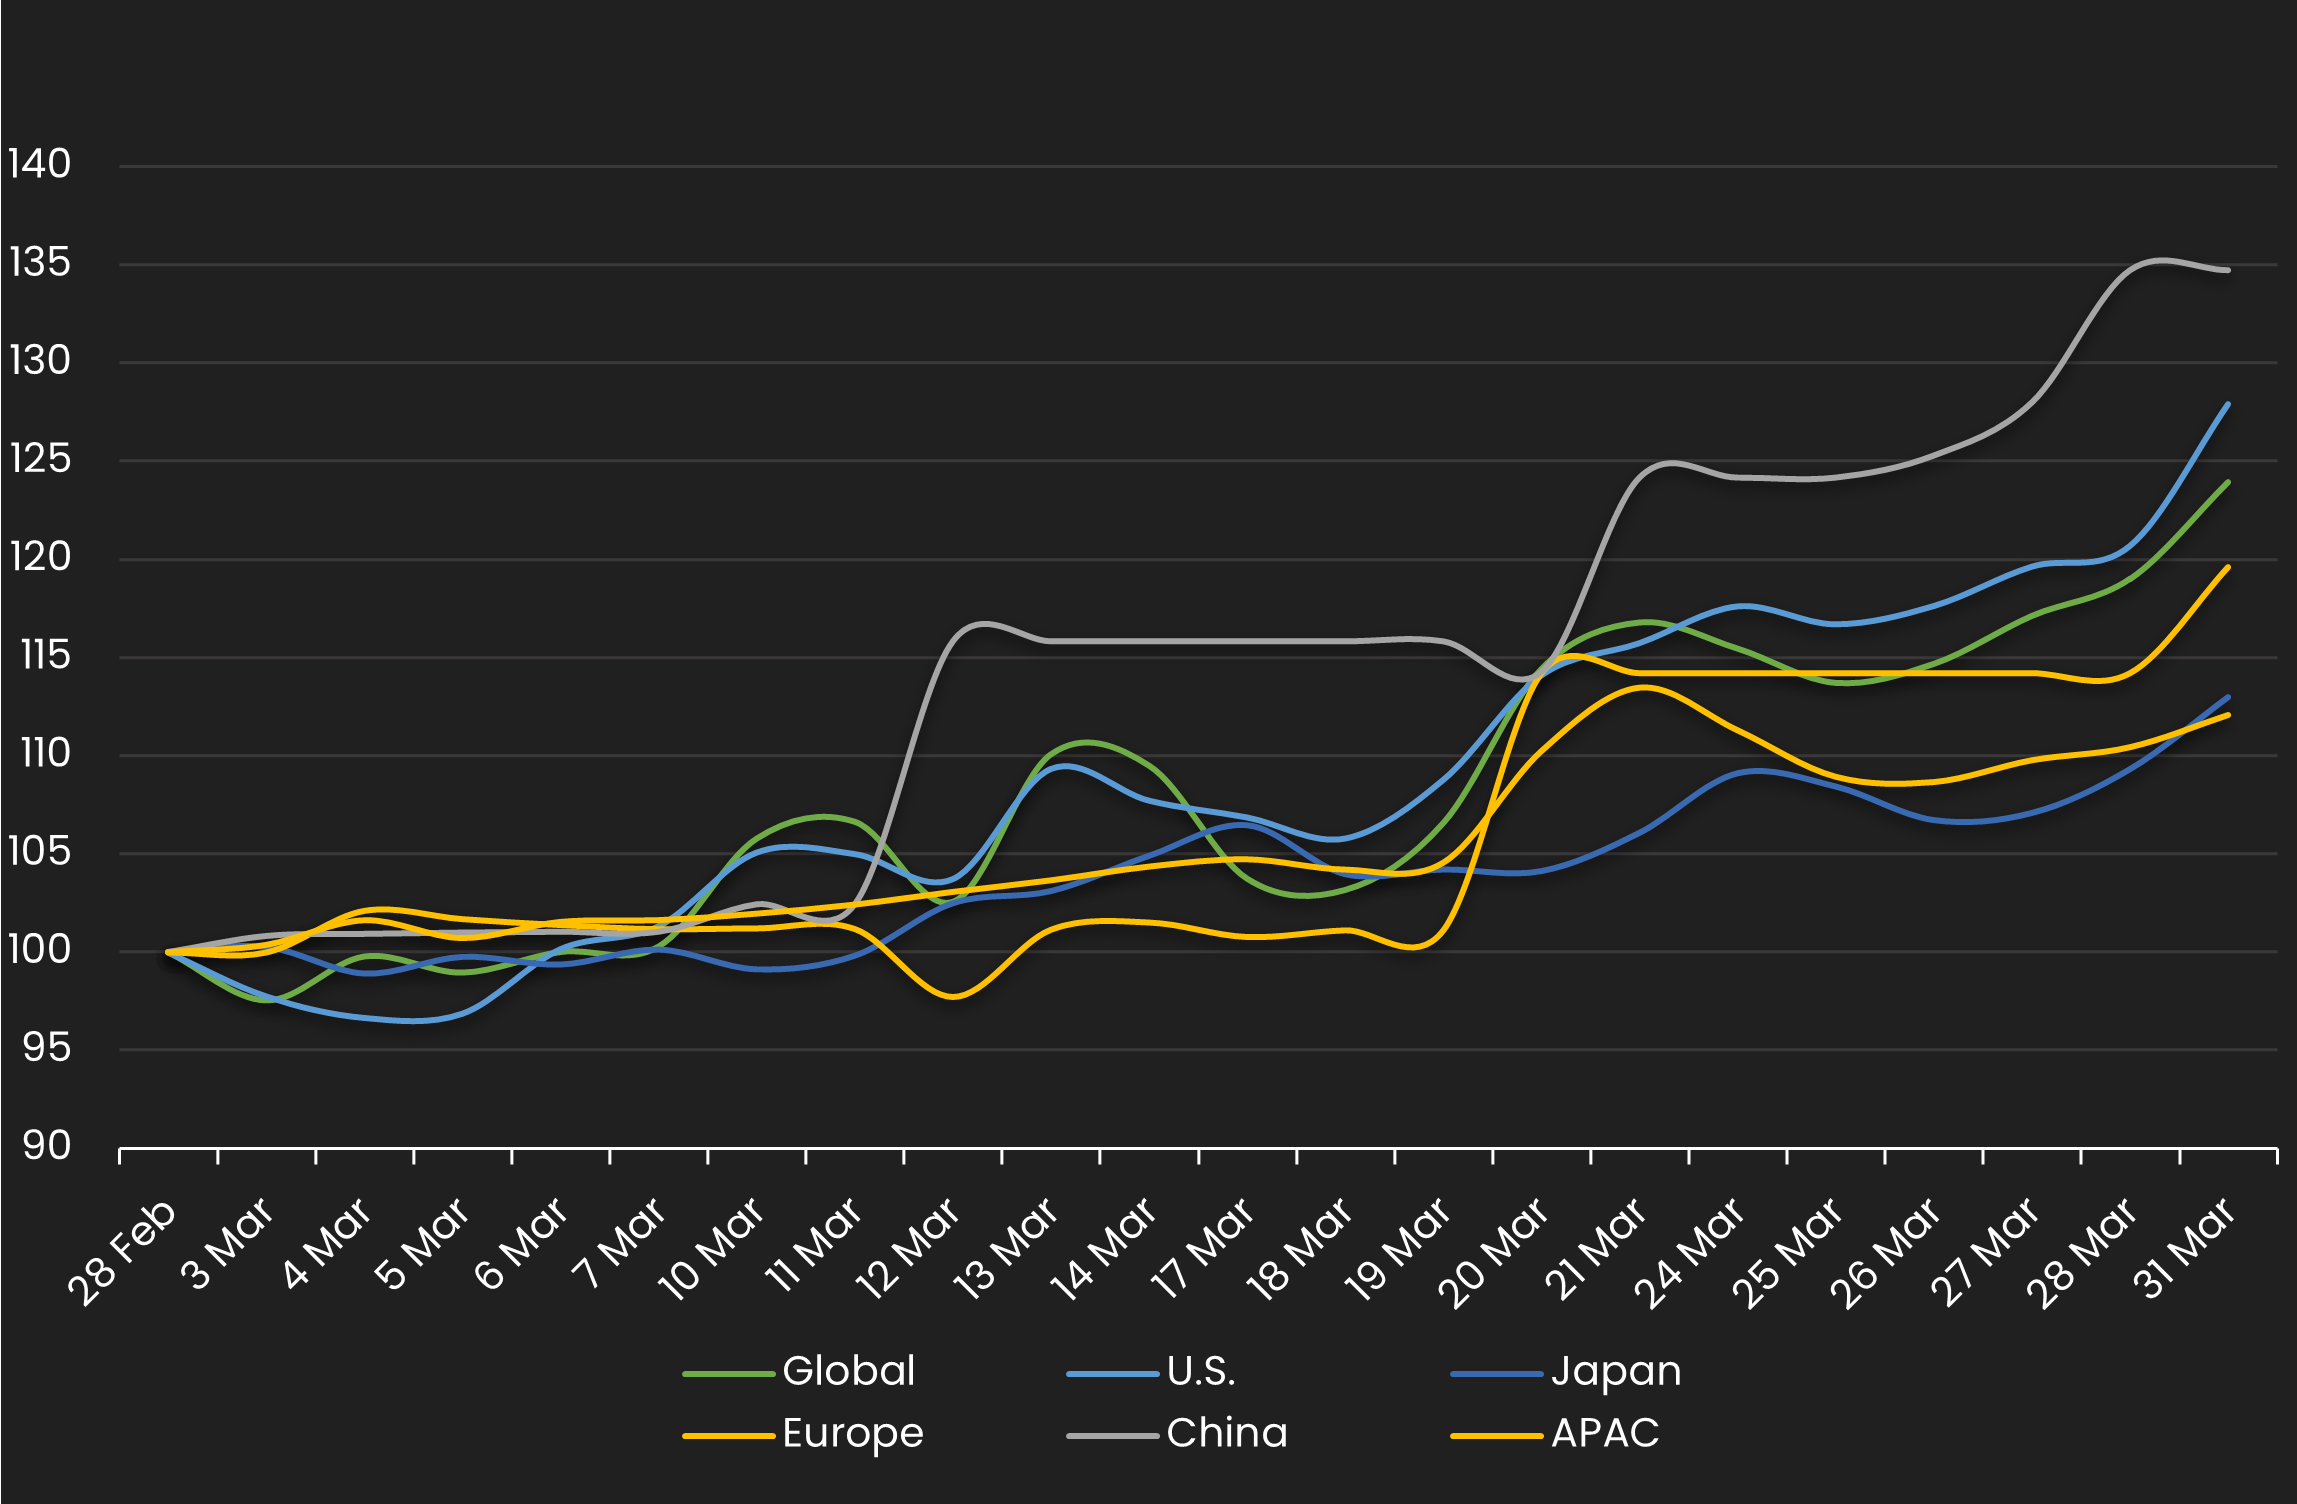
Normalized HY Spread by Region
Displays the HY CDS spread by region between 3/1/25 – 3/31/25 Results are based on 5 select regions, however, we offer data across 12 regions
HY Spread by Region – Monthly Comparison
Exhibits the HY mid spread by region for the month ending 2/28/24 vs. the month ending 3/31/25
| REGION | PREVIOUS SPREAD | CURRENT SPREAD | BPS CHANGE | MONTHLY PERFORMANCE | CDS COUNT |
|---|---|---|---|---|---|
| Global | 133 | 165 | 32 | Wider | 183 |
| U.S. | 130 | 166 | 36 | Wider | 96 |
| U.K. | 99 | 133 | 34 | Wider | 16 |
| Canada | 90 | 82 | -9 | Tighter | 2 |
| China | 74 | 100 | 26 | Wider | 1 |
| APAC | 96 | 108 | 12 | Wider | 1 |
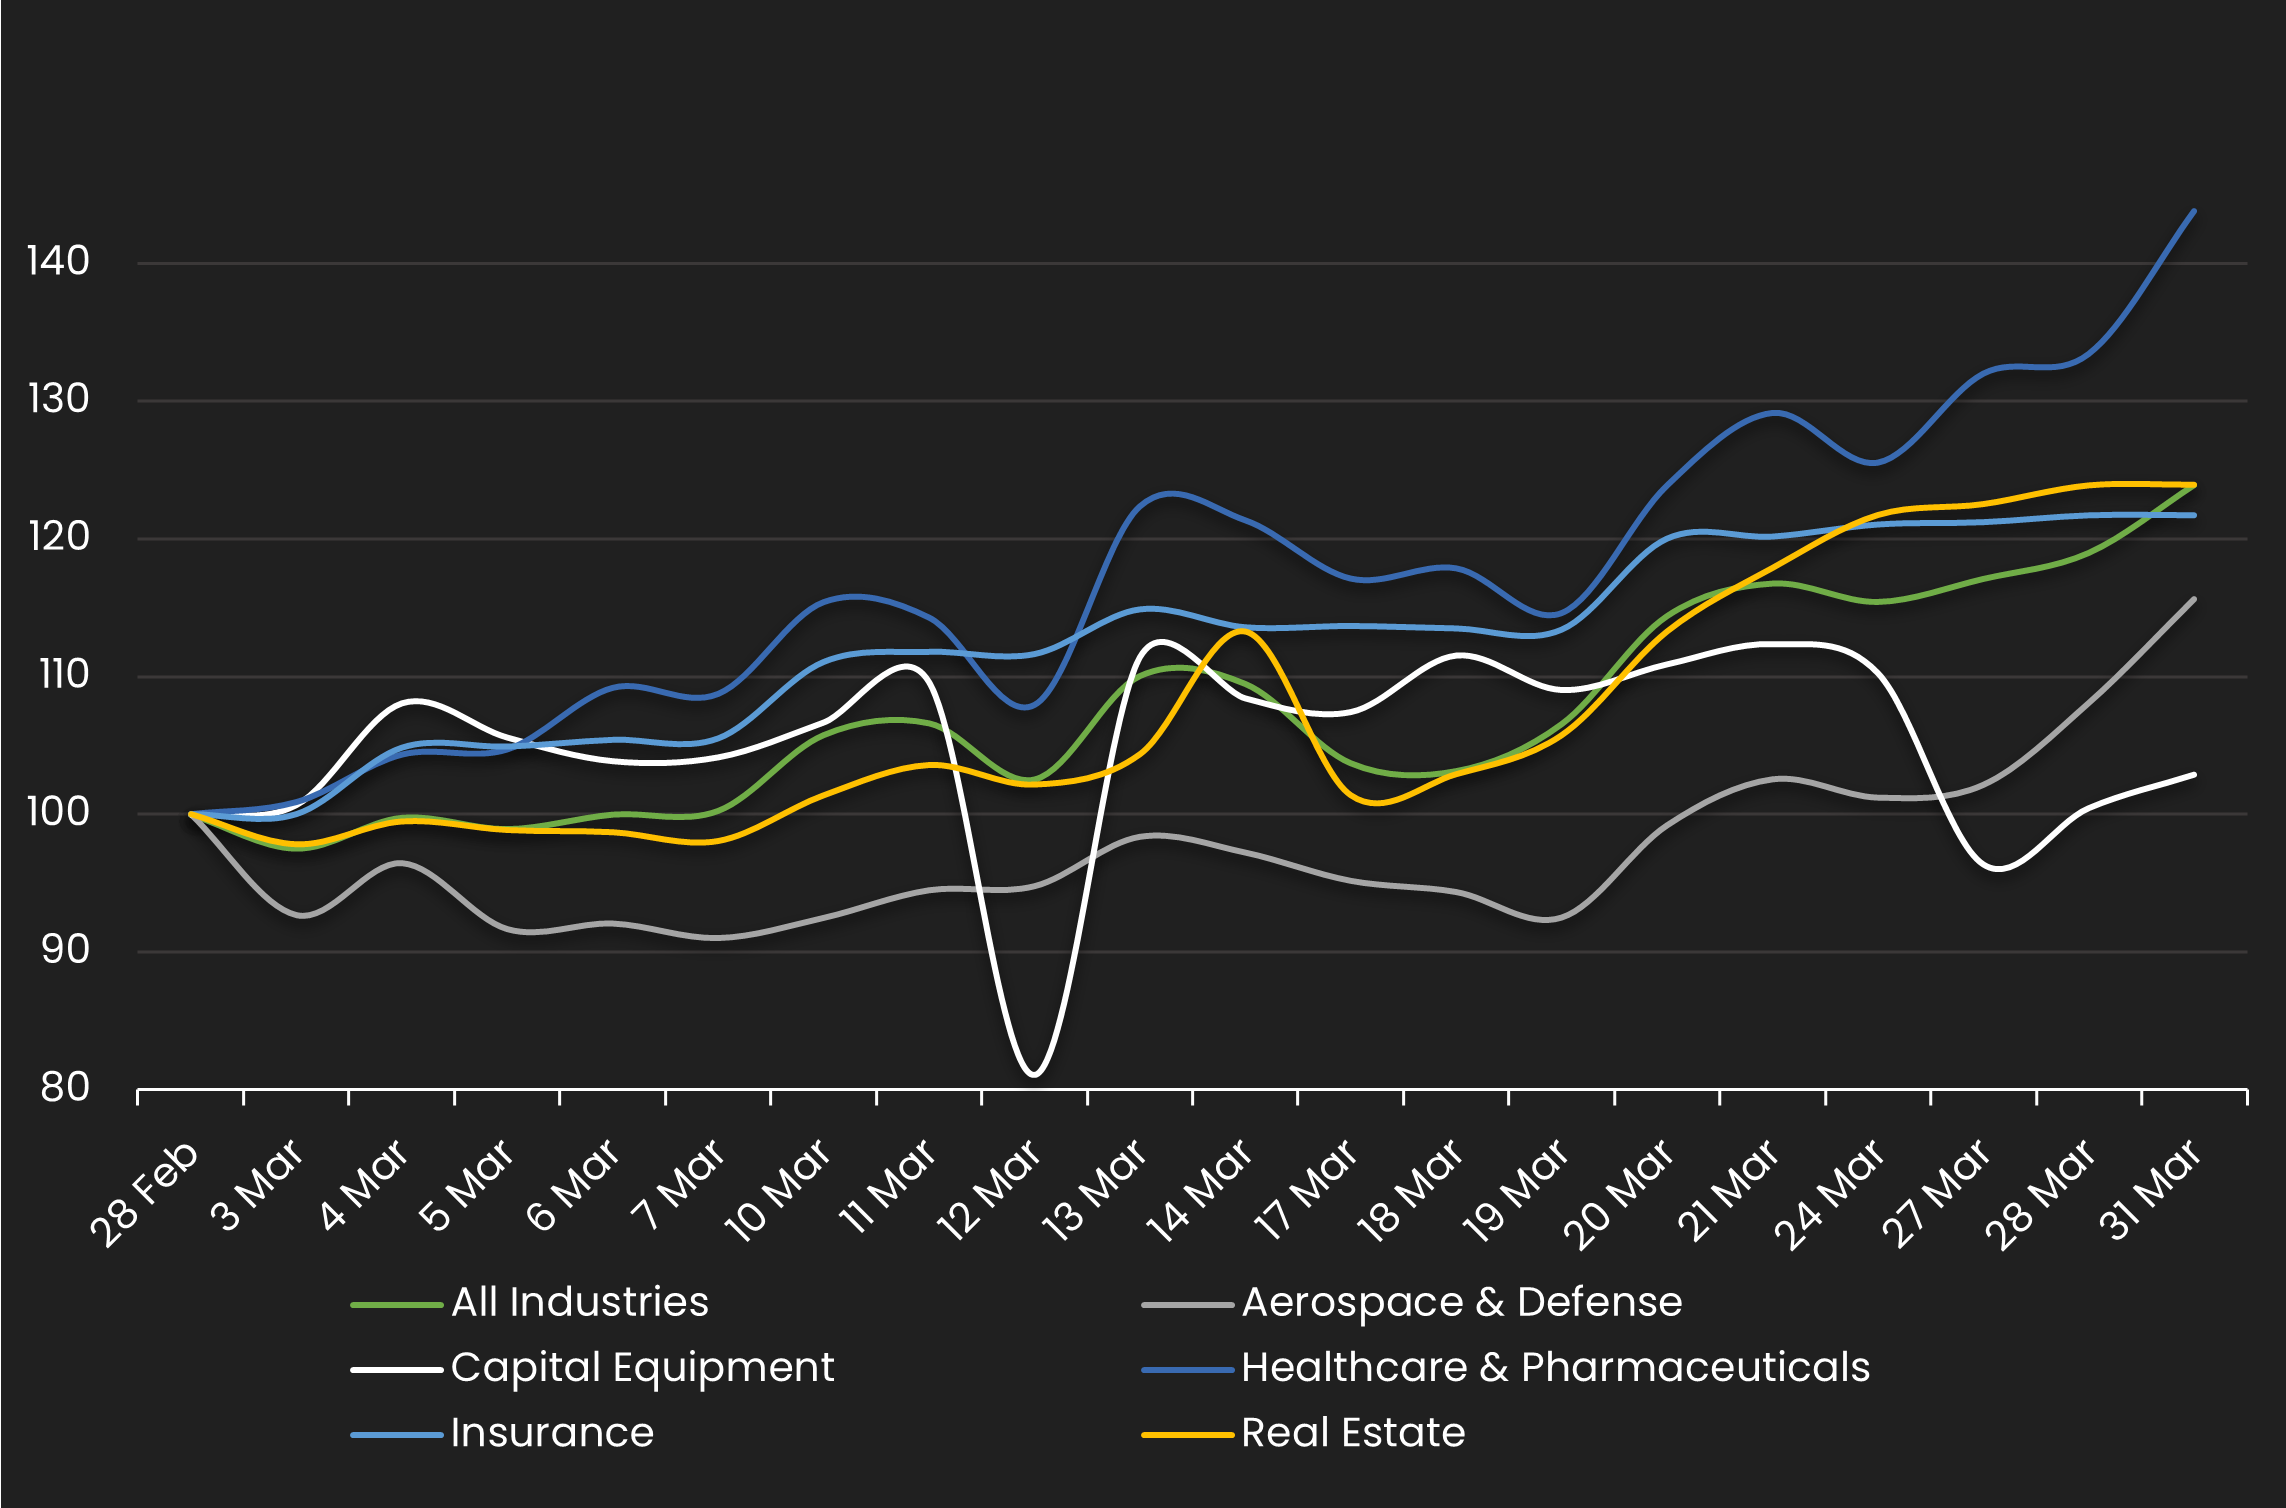
Normalized HY Spread by Industry
Displays the HY CDS spread by industry between 3/1/25 – 3/31/25 Results are based on 5 select industry sectors, however, we offer data across 36 sectors
HY Spread by Industries – Monthly Comparison
Exhibits the HY spread by industry for the month ending 2/28/24 vs. the month ending 3/31/25
| INDUSTRIES | PREVIOUS SPREAD | CURRENT SPREAD | BPS CHANGE | MONTHLY PERFORMANCE | CDS COUNT |
|---|---|---|---|---|---|
| All Industries | 133 | 165 | 32 | Wider | 183.00 |
| Aerospace & Defense | 48 | 55 | 7 | Wider | 1.00 |
| Capital Equipment | 185 | 190 | 5 | Wider | 4.00 |
| Healthcare & Pharmaceuticals | 116 | 166 | 51 | Wider | 5.00 |
| Insurance | 201 | 245 | 44 | Wider | 2.00 |
| Real Estate | 216 | 268 | 52 | Wider | 7.00 |
Stay up-to-date with monthly summaries.
Related Resources
About SOLVE
SOLVE is the leading market data platform provider for fixed-income securities, trusted by sophisticated buy-side and sell-side firms worldwide. Founded in 2011, SOLVE leverages its AI-driven technology and deep industry expertise to offer unparalleled transparency into markets, reduce risk, and save hundreds of hours across front-office workflows. With the largest real-time datasets for Securitized Products, Municipal Bonds, Corporate Bonds, Syndicated Bank Loans, Convertible Bonds, CDS, and Private Credit, SOLVE empowers clients to transform the way they bring new securities to market, trade on secondary markets, and value highly illiquid securities. Headquartered in Connecticut, with offices across the globe, SOLVE is the definitive source for market pricing in fixed-income markets.
