High Yield CDS Market Summary – July 2025
GET OUR CDS MARKET SUMMARIES STRAIGHT TO YOUR INBOX. LEARN MORE
High Yield CDS Market Summary: July 2025
Our newsletter presents key trends derived from observable Credit Default Swaps pricing data over a monthly period.
Top 10 Outperformers
Showcases the top 10 HY CDS “outperformers” based on the largest mid spread decreases between 7/1/25 – 7/31/25
| RANK | BOND NAME | ISSUER | % CHANGE | BPS CHANGE | SPRD | SPRD-1 MONTH | DEALERS |
|---|---|---|---|---|---|---|---|
| 1 | CECGR 5Y | CECONOMY AG | -40.7% | -110 | 160 | 270 | 4 |
| 2 | ZEGLN 5Y | ZEGONA FINANCE | -29.0% | -60 | 148 | 208 | 3 |
| 3 | TKAGR 5Y | VERTICAL MIDCO GMBH | -25.4% | -32 | 94 | 125 | 4 |
| 4 | SOFTBK 5Y | SOFTBANK GROUP CORP | -20.1% | -58 | 232 | 290 | 5 |
| 5 | CVNA 5Y | CARVANNA | -19.7% | -46 | 186 | 232 | 2 |
| 6 | BAB 5Y | BRITISH AIRWAYS | -16.6% | -17 | 88 | 105 | 3 |
| 7 | RAKUTN 5Y | RAKUTEN INC | -16.4% | -45 | 230 | 276 | 3 |
| 8 | BAIDU 5Y | BAIDU INC | -16.2% | -16 | 83 | 99 | 2 |
| 9 | DAL 5Y | DELTA AIR LINES INC | -15.8% | -20 | 105 | 124 | 3 |
| 10 | TGNA 5Y | TEGNA INC | -13.7% | -33 | 205 | 238 | 4 |
Top 10 Underperformers
Showcases the top 10 HY CDS “underperformers” based on the largest mid spread increases between 7/1/25 – 7/31/25
| RANK | BOND NAME | ISSUER | % CHANGE | BPS CHANGE | SPREAD | SPREAD-1 MONTH | DEALERS |
|---|---|---|---|---|---|---|---|
| 1 | CCOH 5Y | CCO HOLDINGS LLC | 34.0% | 44 | 172 | 128 | 4 |
| 2 | THC 5Y | TENET HEALTHCARE CORP | 27.4% | 28 | 128 | 101 | 3 |
| 3 | AVNT 5Y | AVIENT CORP | 25.6% | 24 | 119 | 95 | 3 |
| 4 | PORSCH 5Y | PORSCHE AUTOMOBIL HOLDING SE | 18.2% | 20 | 130 | 110 | 2 |
| 5 | GPS 5Y | GAP INC | 14.3% | 19 | 154 | 135 | 3 |
| 6 | OLN 5Y | OLIN CORP | 9.6% | 18 | 205 | 187 | 3 |
| 7 | NAVI 5Y | SLM CORP MEDIUM TERM NTS BOOK | 7.4% | 17 | 243 | 227 | 4 |
| 8 | CLAR 5Y | CLARIANT AG | 5.0% | 6 | 118 | 112 | 5 |
| 9 | AGFC 5Y | AGFC CAP TR I | 4.9% | 8 | 176 | 167 | 4 |
| 10 | AES 5Y | AES TRUST I | 4.4% | 5 | 120 | 115 | 4 |
Normalized HY Spread by Region
Displays the HY CDS spread by region between 7/1/25 – 7/31/25 Results are based on 5 select regions, however, we offer data across 12 regions
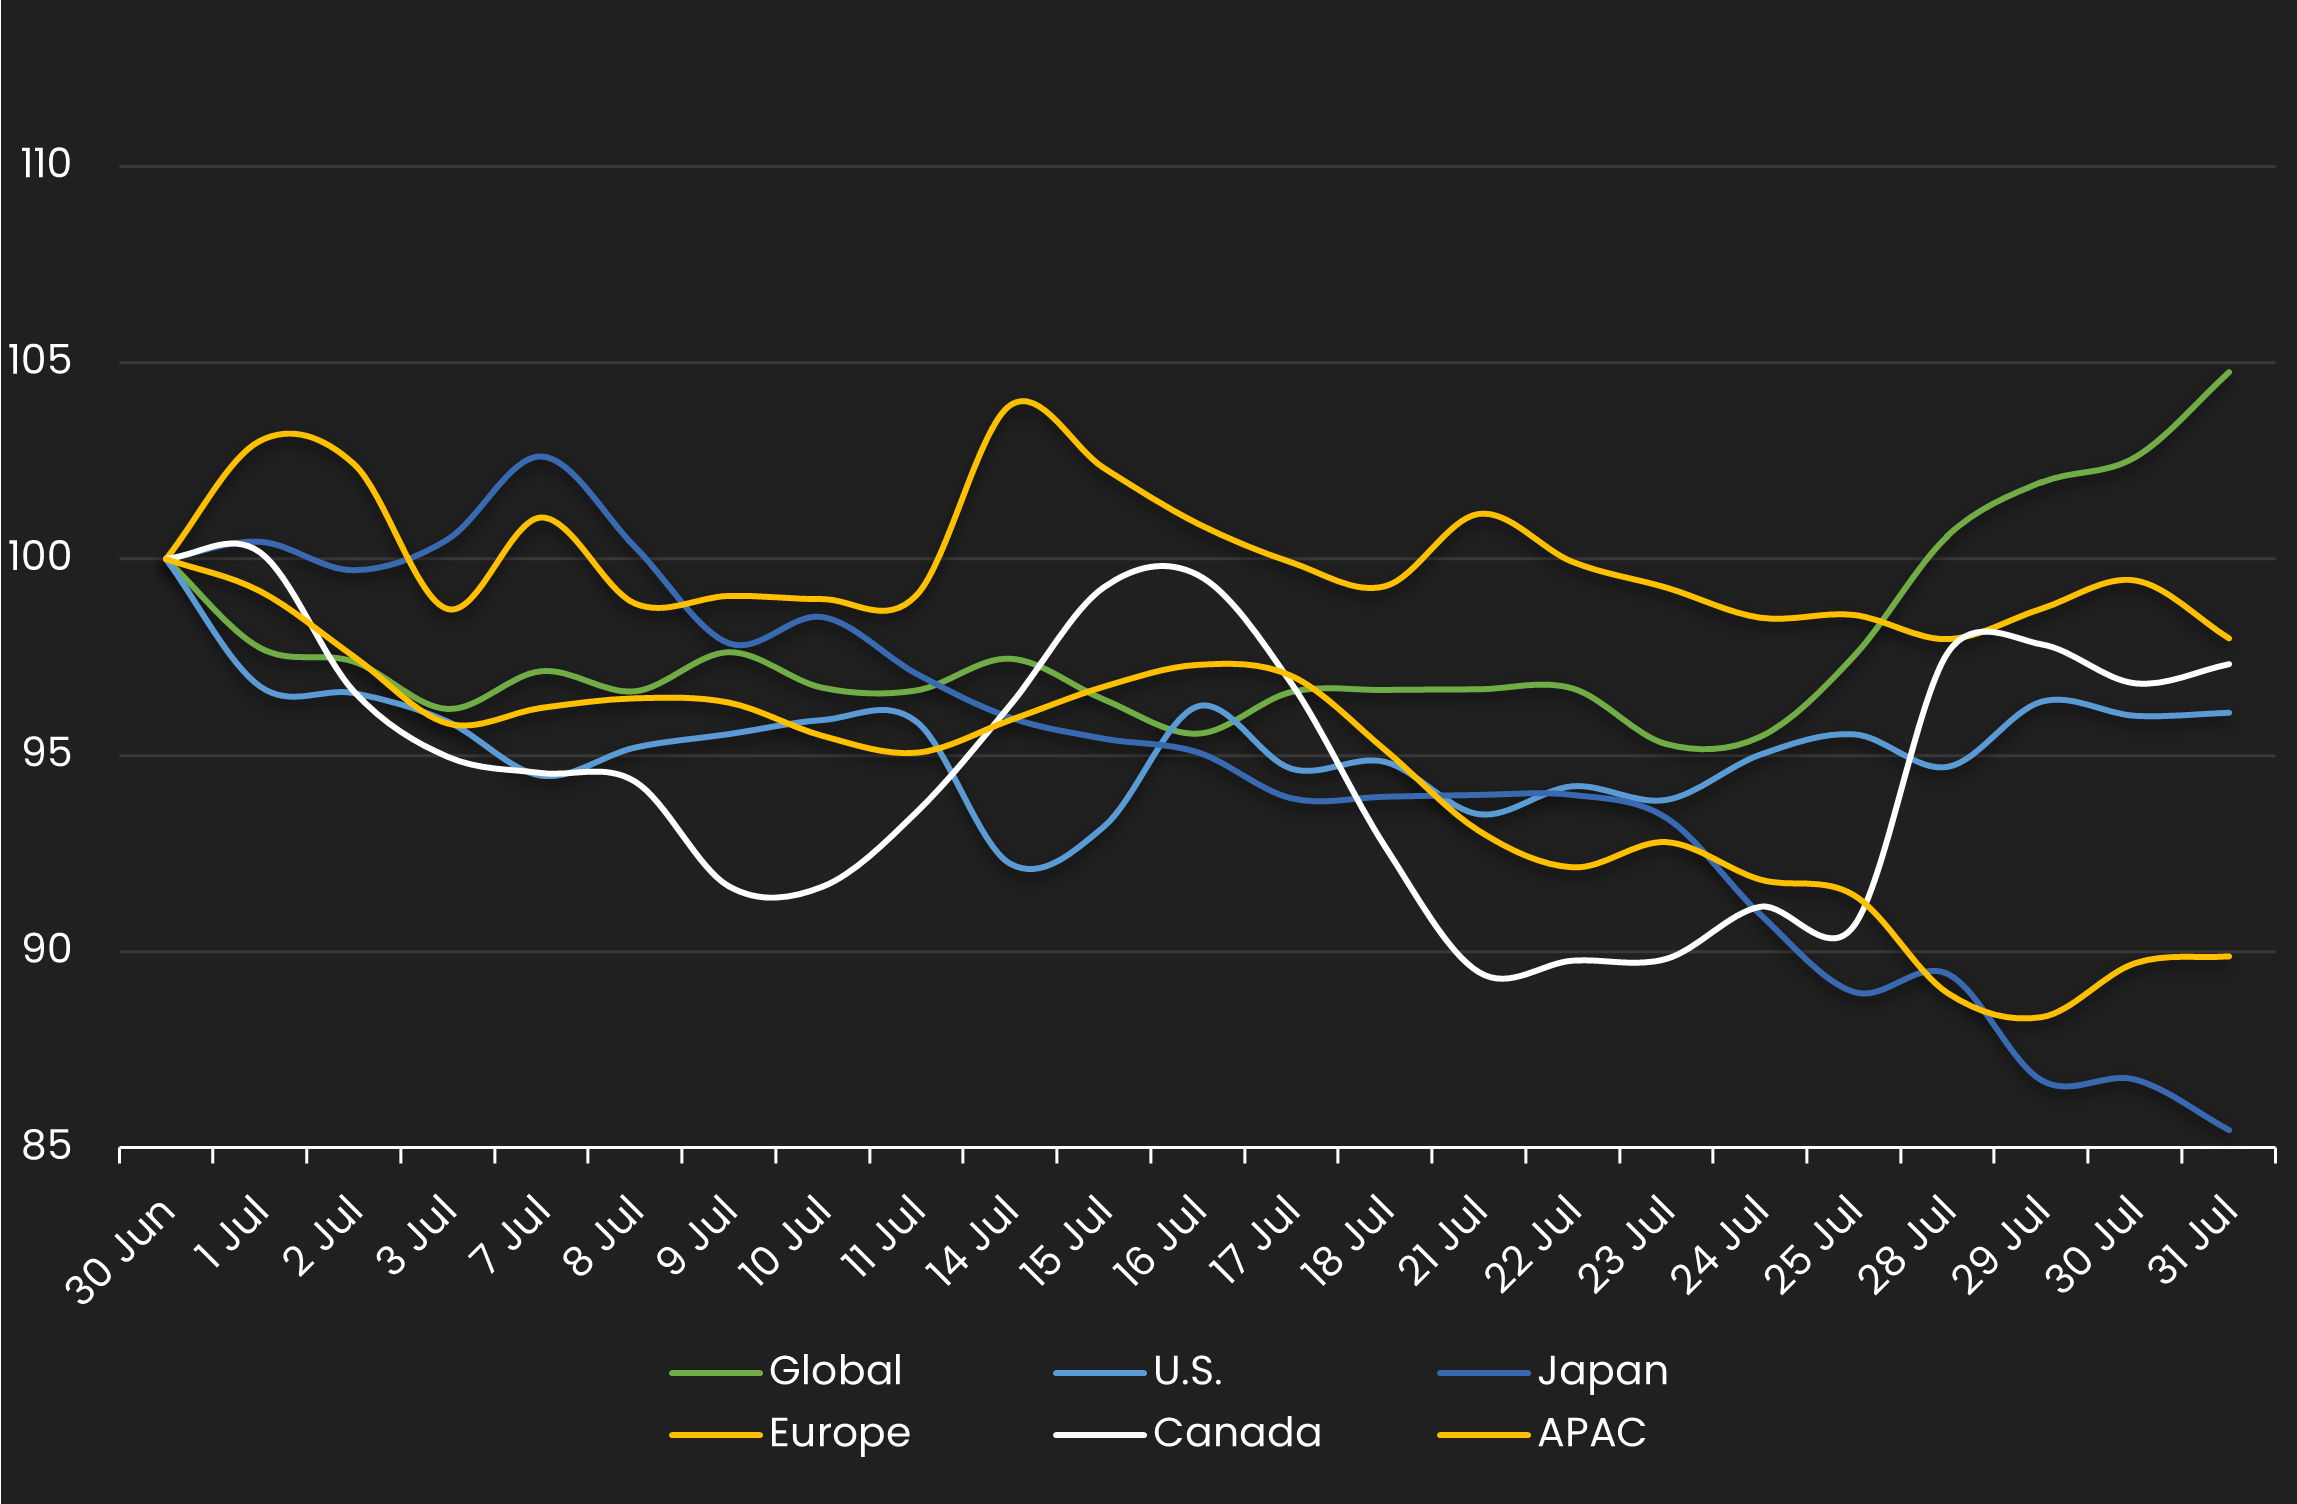
HY Spread by Region – Monthly Comparison
Exhibits the HY mid spread by region for the month ending 6/30/24 vs. the month ending 7/31/25
| REGION | PREVIOUS SPREAD | CURRENT SPREAD | BPS CHANGE | MONTHLY PERFORMANCE | CDS COUNT |
|---|---|---|---|---|---|
| Global | 129 | 135 | 6 | Wider | 184 |
| U.S. | 125 | 120 | -5 | Tighter | 99 |
| Japan | 72 | 61 | -10 | Tighter | 5 |
| Europe | 166 | 163 | -3 | Tighter | 51 |
| Canada | 72 | 70 | -2 | Tighter | 2 |
| APAC | 95 | 85 | -10 | Tighter | 1 |
Normalized HY Spread by Industry
Displays the HY CDS spread by industry between 7/1/25 – 7/31/25 Results are based on 5 select industry sectors, however, we offer data across 36 sectors
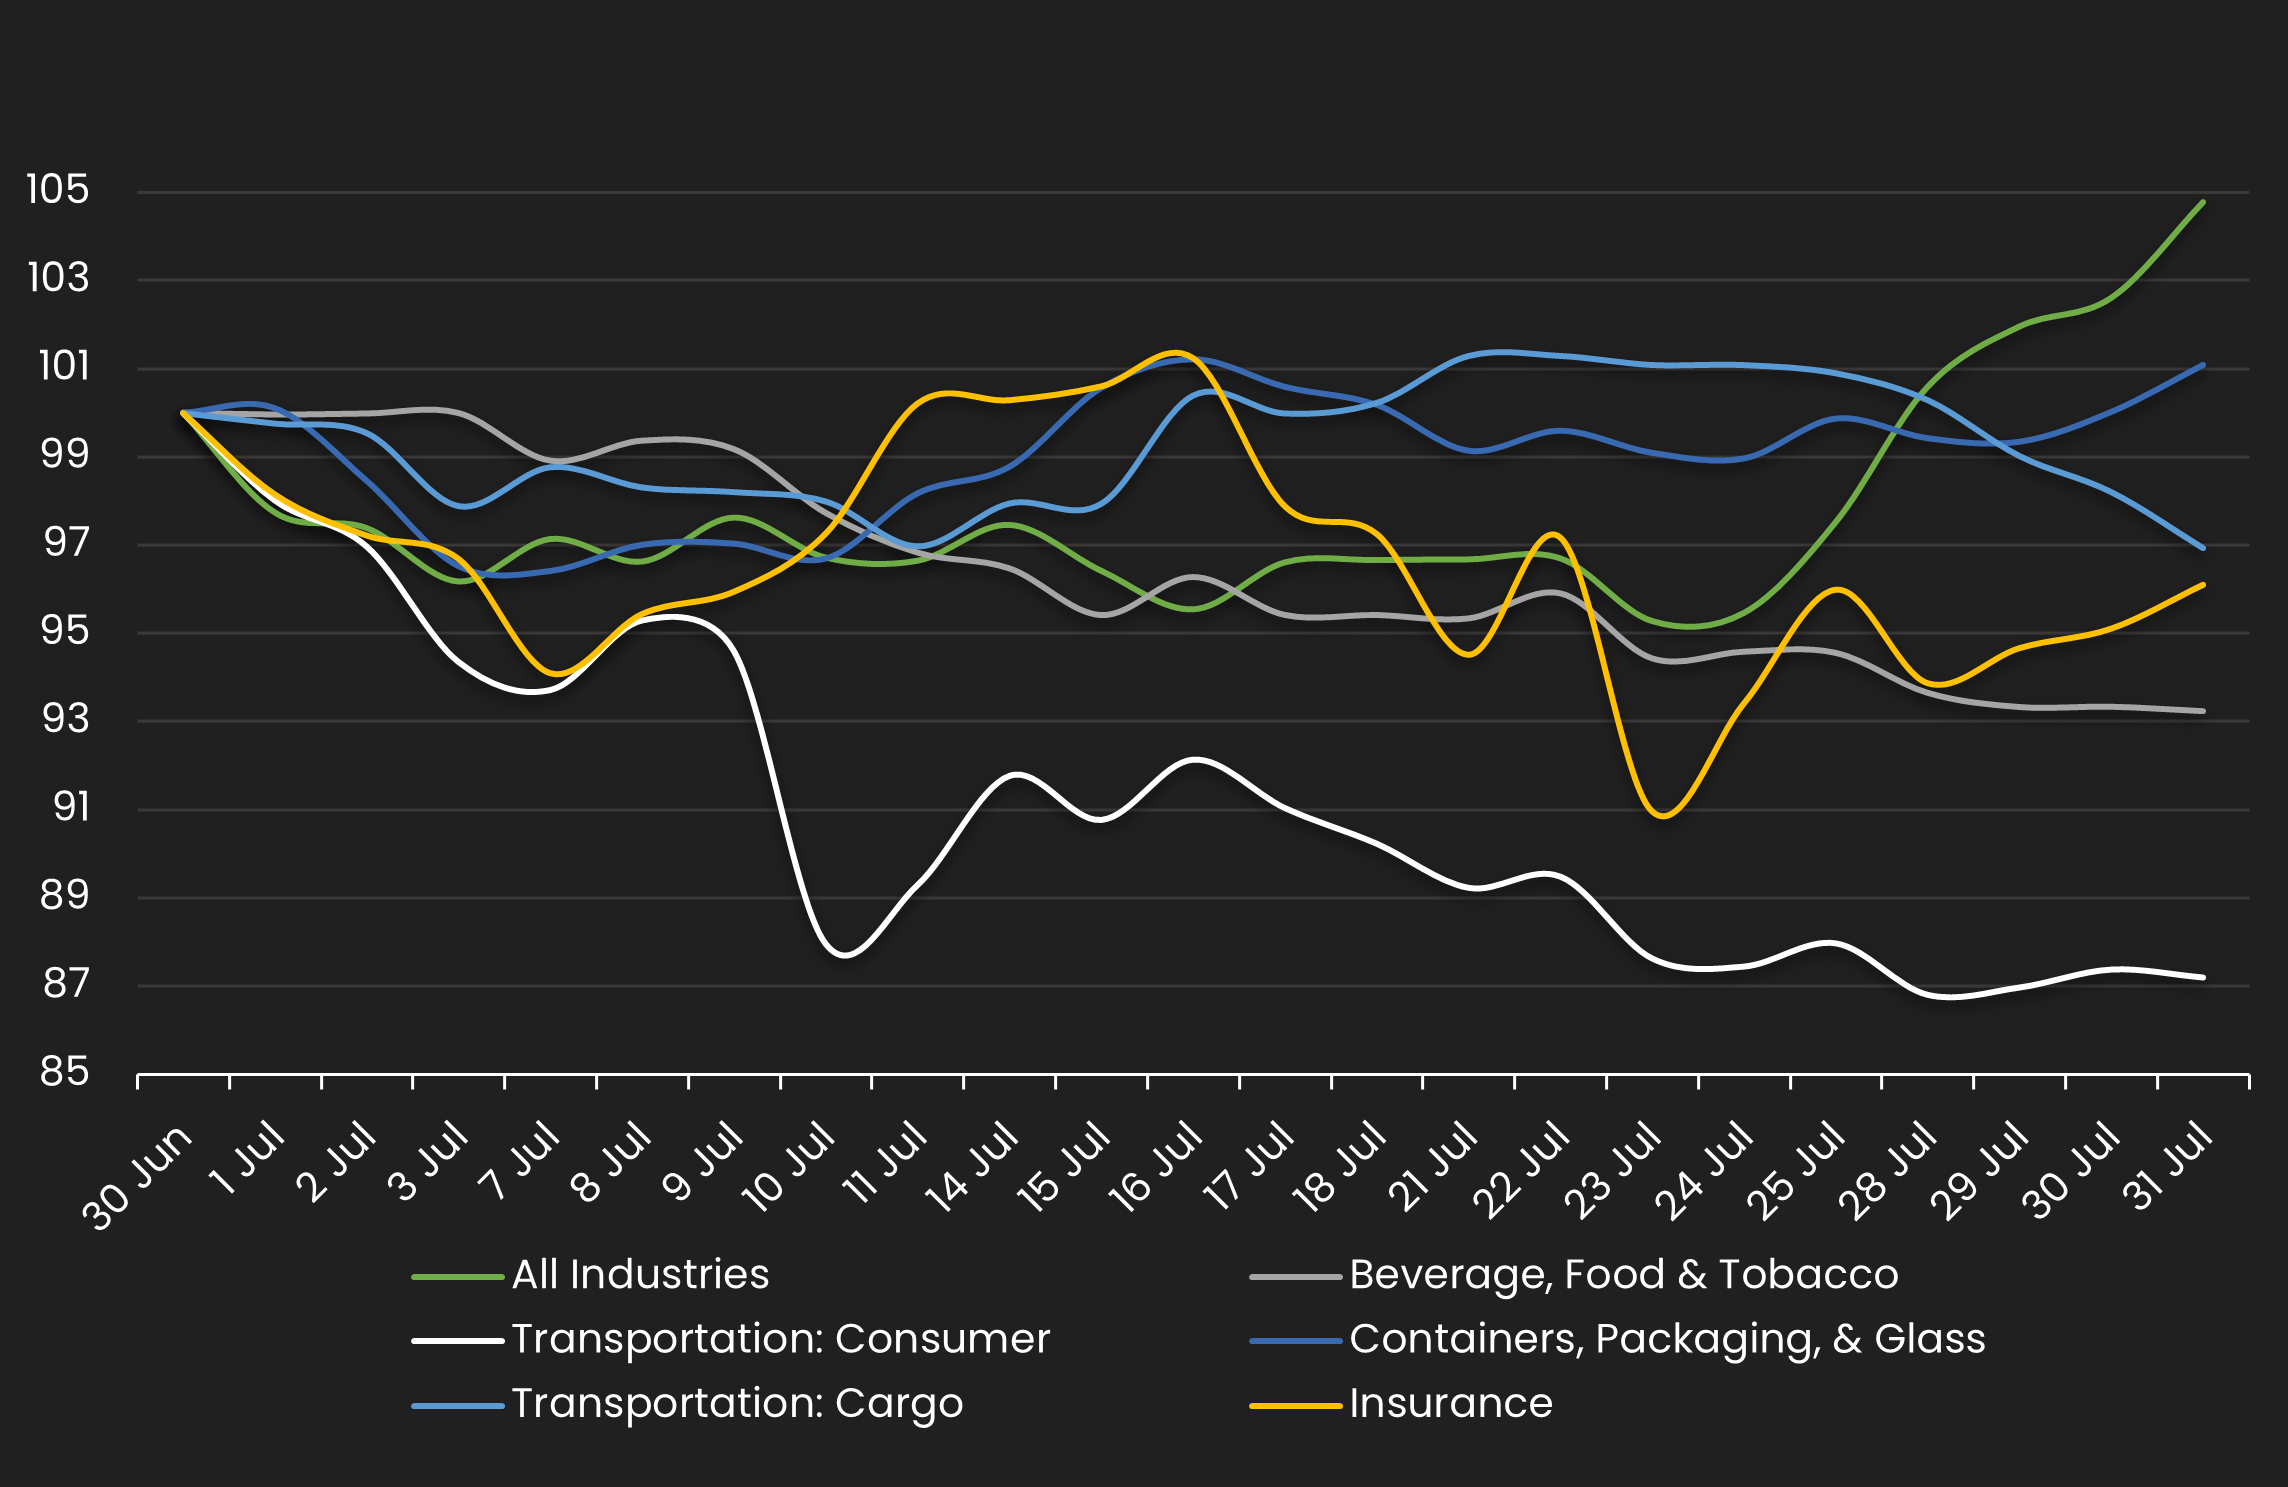
HY Spread by Industries – Monthly Comparison
Exhibits the HY spread by industry for the month ending 6/30/24 vs. the month ending 7/31/25
| INDUSTRIES | PREVIOUS SPREAD | CURRENT SPREAD | BPS CHANGE | MONTHLY PERFORMANCE | CDS COUNT |
|---|---|---|---|---|---|
| All Industries | 129 | 135 | 6 | Wider | 184 |
| Beverage, Food & Tobacco | 233 | 218 | -16 | Tighter | 7 |
| Transportation: Consumer | 124 | 108 | -16 | Tighter | 5 |
| Containers, Packaging, & Glass | 92 | 93 | 1 | Wider | 6 |
| Transportation: Cargo | 161 | 156 | -5 | Tighter | 3 |
| Insurance | 107 | 103 | -4 | Tighter | 2 |
Stay up-to-date with monthly summaries.
Related Resources
About SOLVE
SOLVE is the leading market data platform provider for fixed-income securities, trusted by sophisticated buy-side and sell-side firms worldwide. Founded in 2011, SOLVE leverages its AI-driven technology and deep industry expertise to offer unparalleled transparency into markets, reduce risk, and save hundreds of hours across front-office workflows. With the largest real-time datasets for Securitized Products, Municipal Bonds, Corporate Bonds, Syndicated Bank Loans, Convertible Bonds, CDS, and Private Credit, SOLVE empowers clients to transform the way they bring new securities to market, trade on secondary markets, and value highly illiquid securities. Headquartered in Connecticut, with offices across the globe, SOLVE is the definitive source for market pricing in fixed-income markets.
