High Yield CDS Market Summary – December 2022
GET OUR CDS MARKET SUMMARIES STRAIGHT TO YOUR INBOX. LEARN MORE
High Yield CDS Market Summary:December 2022
Our newsletter presents key trends derived from observable Credit Default Swaps pricing data over a monthly period.
Top 10 Outperformers
Showcases the top 10 HY CDS “outperformers” based on the largest mid spread decreases between 12/1/22 – 12/31/22
| RANK | BOND NAME | ISSUER | % CHANGE | BPS CHANGE | SPRD | SPRD-1 MONTH | DEALERS |
|---|---|---|---|---|---|---|---|
| 1 | LPX 5Y | LP PINEWOOD SPV LLC | -21.2% | -38 | 140 | 178 | 3 |
| 2 | FCX 5Y | FREEPORT-MCMORAN COPPER & GOLD | -16.1% | -26 | 136 | 162 | 3 |
| 3 | RRD 5Y | DONNELLEY R R & SONS CO | -15.9% | -58 | 308 | 366 | 3 |
| 4 | TCKCN 5Y | TECK RESOURCES LIMITED | -15.8% | -27 | 144 | 171 | 3 |
| 5 | MBIA_AA 5Y | MBIA INC | -15.2% | -56 | 312 | 368 | 3 |
| 6 | HAOHUA 5Y | CNAC CENTURY HK CO LTD | -13.8% | -24 | 152 | 177 | 2 |
| 7 | HCA 5Y | HCA INC | -13.1% | -17 | 116 | 133 | 6 |
| 8 | MDC 5Y | M.D.C. HOLDINGS, INC | -10.7% | -25 | 207 | 232 | 7 |
| 9 | TOL 5Y | TOLL BROS INC | -10.6% | -25 | 211 | 236 | 3 |
| 10 | KBH 5Y | KB HOME | -10.5% | -38 | 321 | 359 | 5 |
Top 10 Underperformers
Showcases the top 10 HY CDS “underperformers” based on the largest mid spread increases between 12/1/22 – 12/31/22
| RANK | BOND NAME | ISSUER | % CHANGE | BPS CHANGE | SPREAD | SPREAD-1 MONTH | DEALERS |
|---|---|---|---|---|---|---|---|
| 1 | NRG 5Y | NRG ENERGY INC | 33.0% | 105 | 422 | 317 | 3 |
| 2 | AXL 5Y | AMERICAN AXLE & MFG HLDGS INC | 28.4% | 137 | 622 | 484 | 3 |
| 3 | AMKR 5Y | AMKOR TECHNOLOGY INC | 16.7% | 24 | 167 | 143 | 4 |
| 4 | TDC 5Y | NORDIC TEL CO HLDG APS | 13.7% | 17 | 142 | 125 | 3 |
| 5 | AMD 5Y | ADVANCED MICRO DEVICES INC | 13.5% | 10 | 87 | 76 | 3 |
| 6 | GASSM 5Y | GNFT | 13.5% | 12 | 101 | 89 | 2 |
| 7 | SIRI 5Y | SCS HOLDINGS INC | 12.9% | 23 | 201 | 178 | 4 |
| 8 | GM 5Y | GENERAL MOTORS CO | 12.6% | 24 | 214 | 190 | 7 |
| 9 | CSTM 5Y | CONSTELLIUM NV | 11.9% | 39 | 365 | 326 | 3 |
| 10 | MMC 5Y | KROLL INC | 11.4% | 3 | 30 | 27 | 6 |
Normalized HY Spread by Region
Displays the HY CDS spread by region between 12/1/22 – 12/31/22 Results are based on 5 select regions, however, we offer data across 12 regions
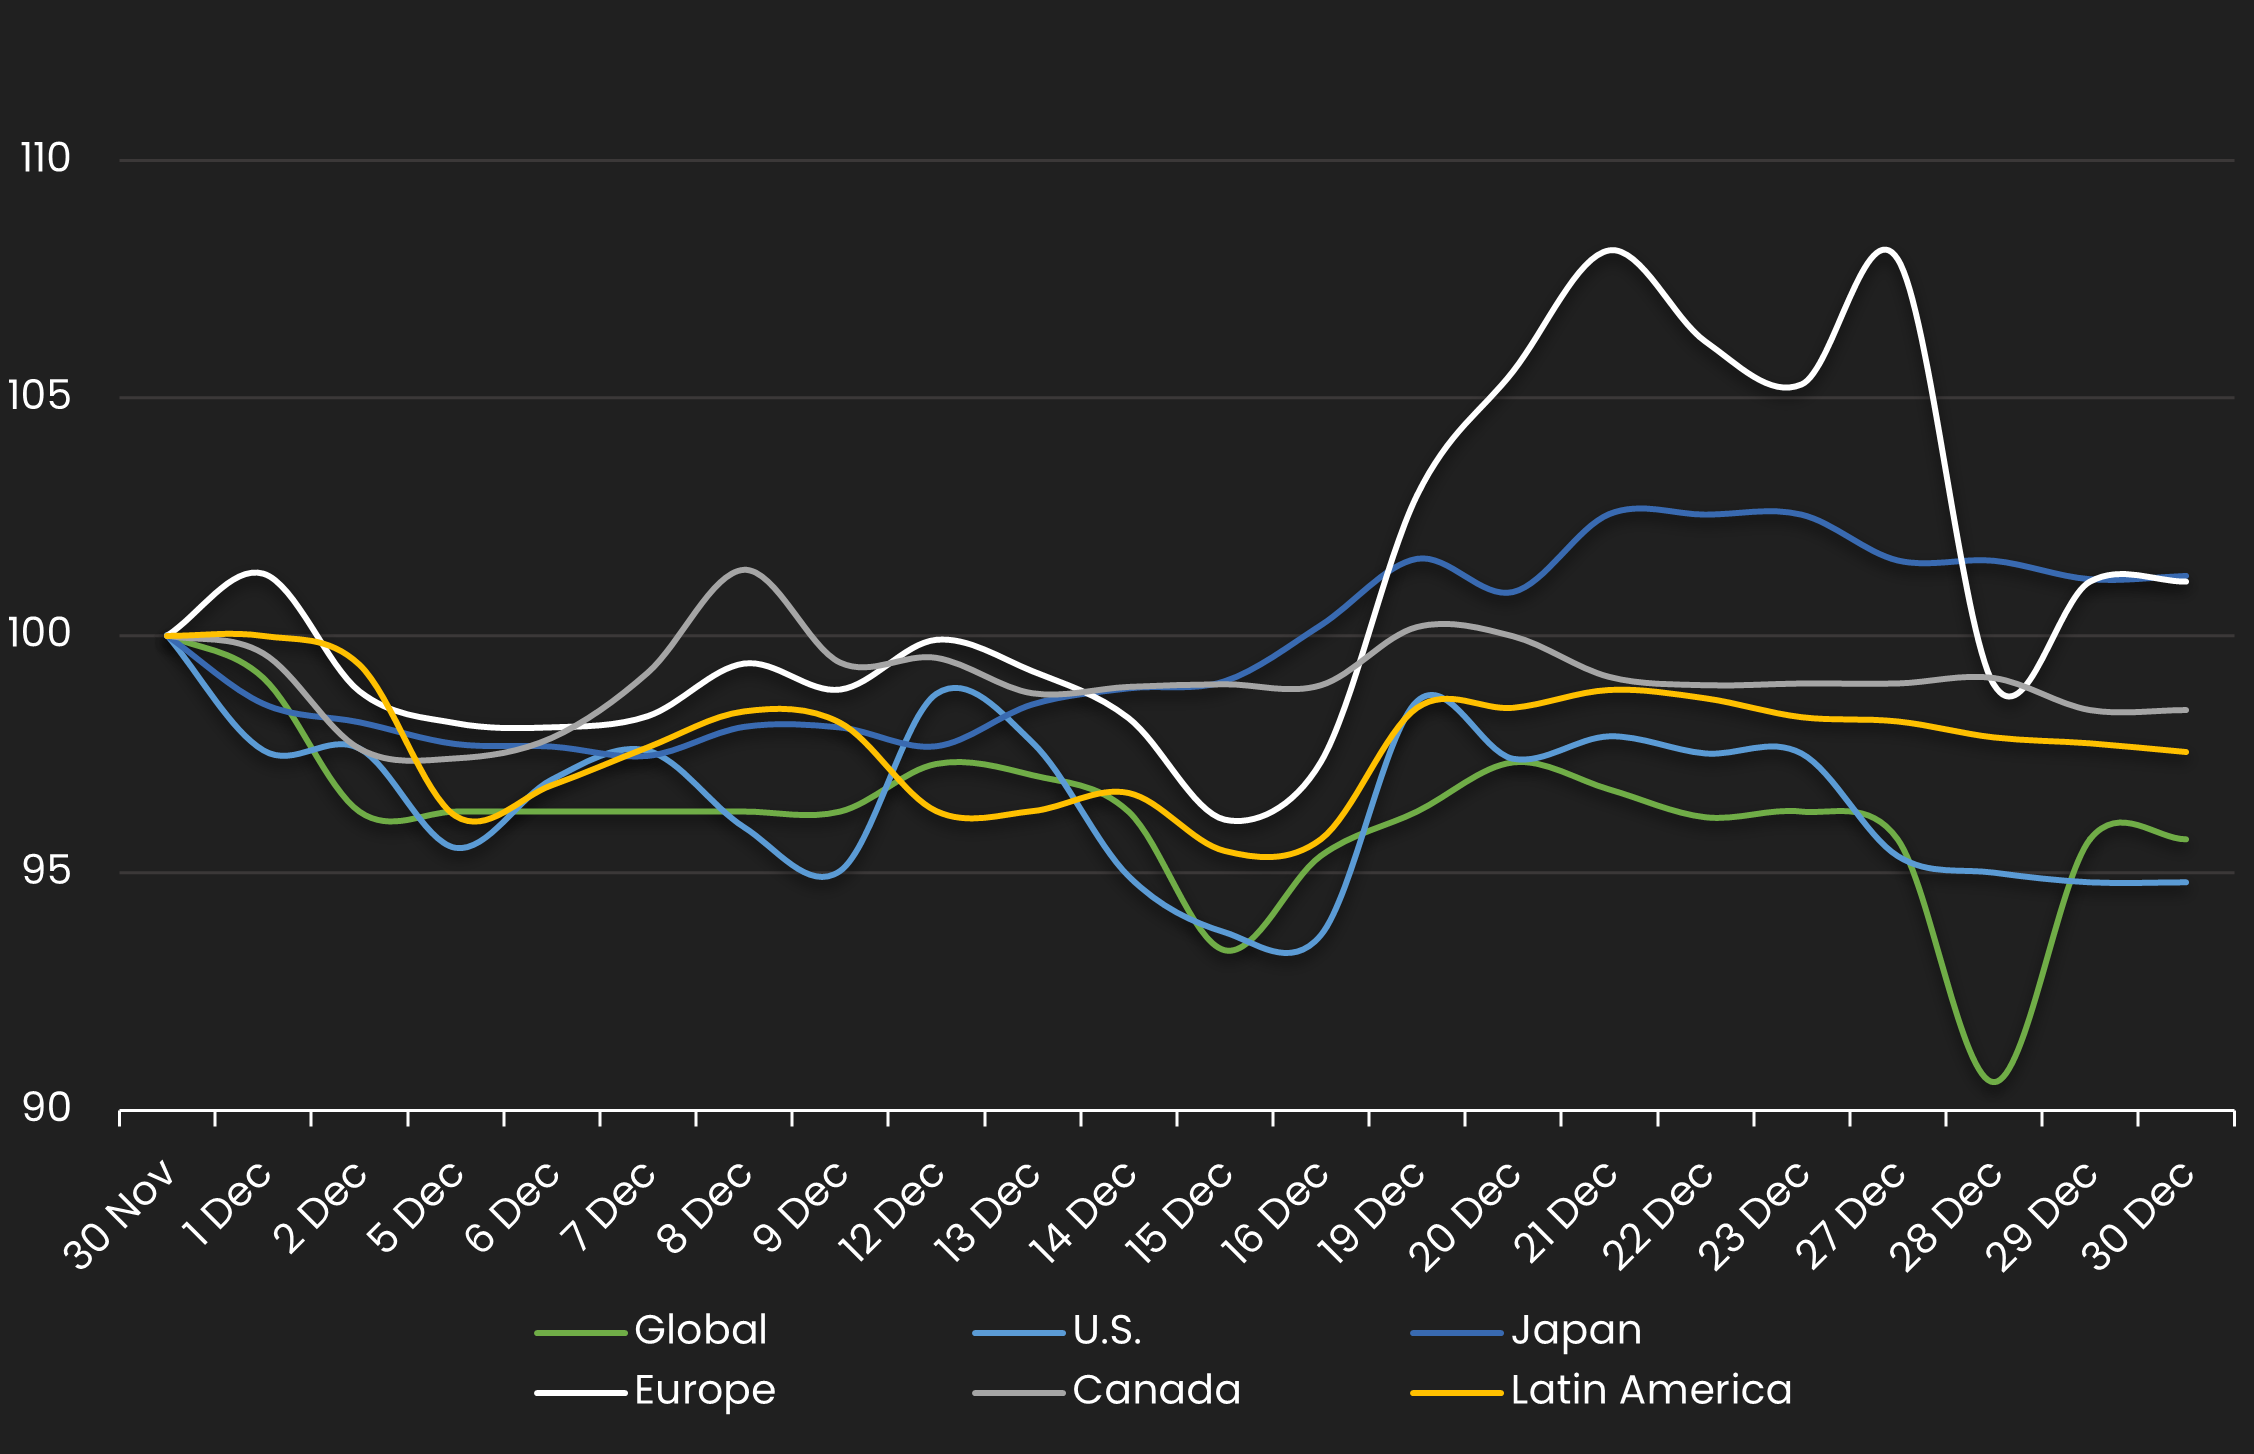
HY Spread by Region – Monthly Comparison
Exhibits the HY mid spread by region for the month ending 11/30/22 vs. the month ending 12/31/22
| REGION | PREVIOUS SPREAD | CURRENT SPREAD | BPS CHANGE | MONTHLY PERFORMANCE | CDS COUNT |
|---|---|---|---|---|---|
| Global | 171 | 164 | -7 | Tighter | 248 |
| U.S. | 165 | 156 | -9 | Tighter | 136 |
| Japan | 241 | 244 | 3 | Wider | 4 |
| Europe | 208 | 211 | 2 | Wider | 51 |
| Canada | 112 | 110 | -2 | Tighter | 6 |
| Latin America | 285 | 278 | -7 | Tighter | 8 |
Normalized HY Spread by Industry
Displays the HY CDS spread by industry between 12/1/22 – 12/31/22 Results are based on 5 select industry sectors, however, we offer data across 36 sectors
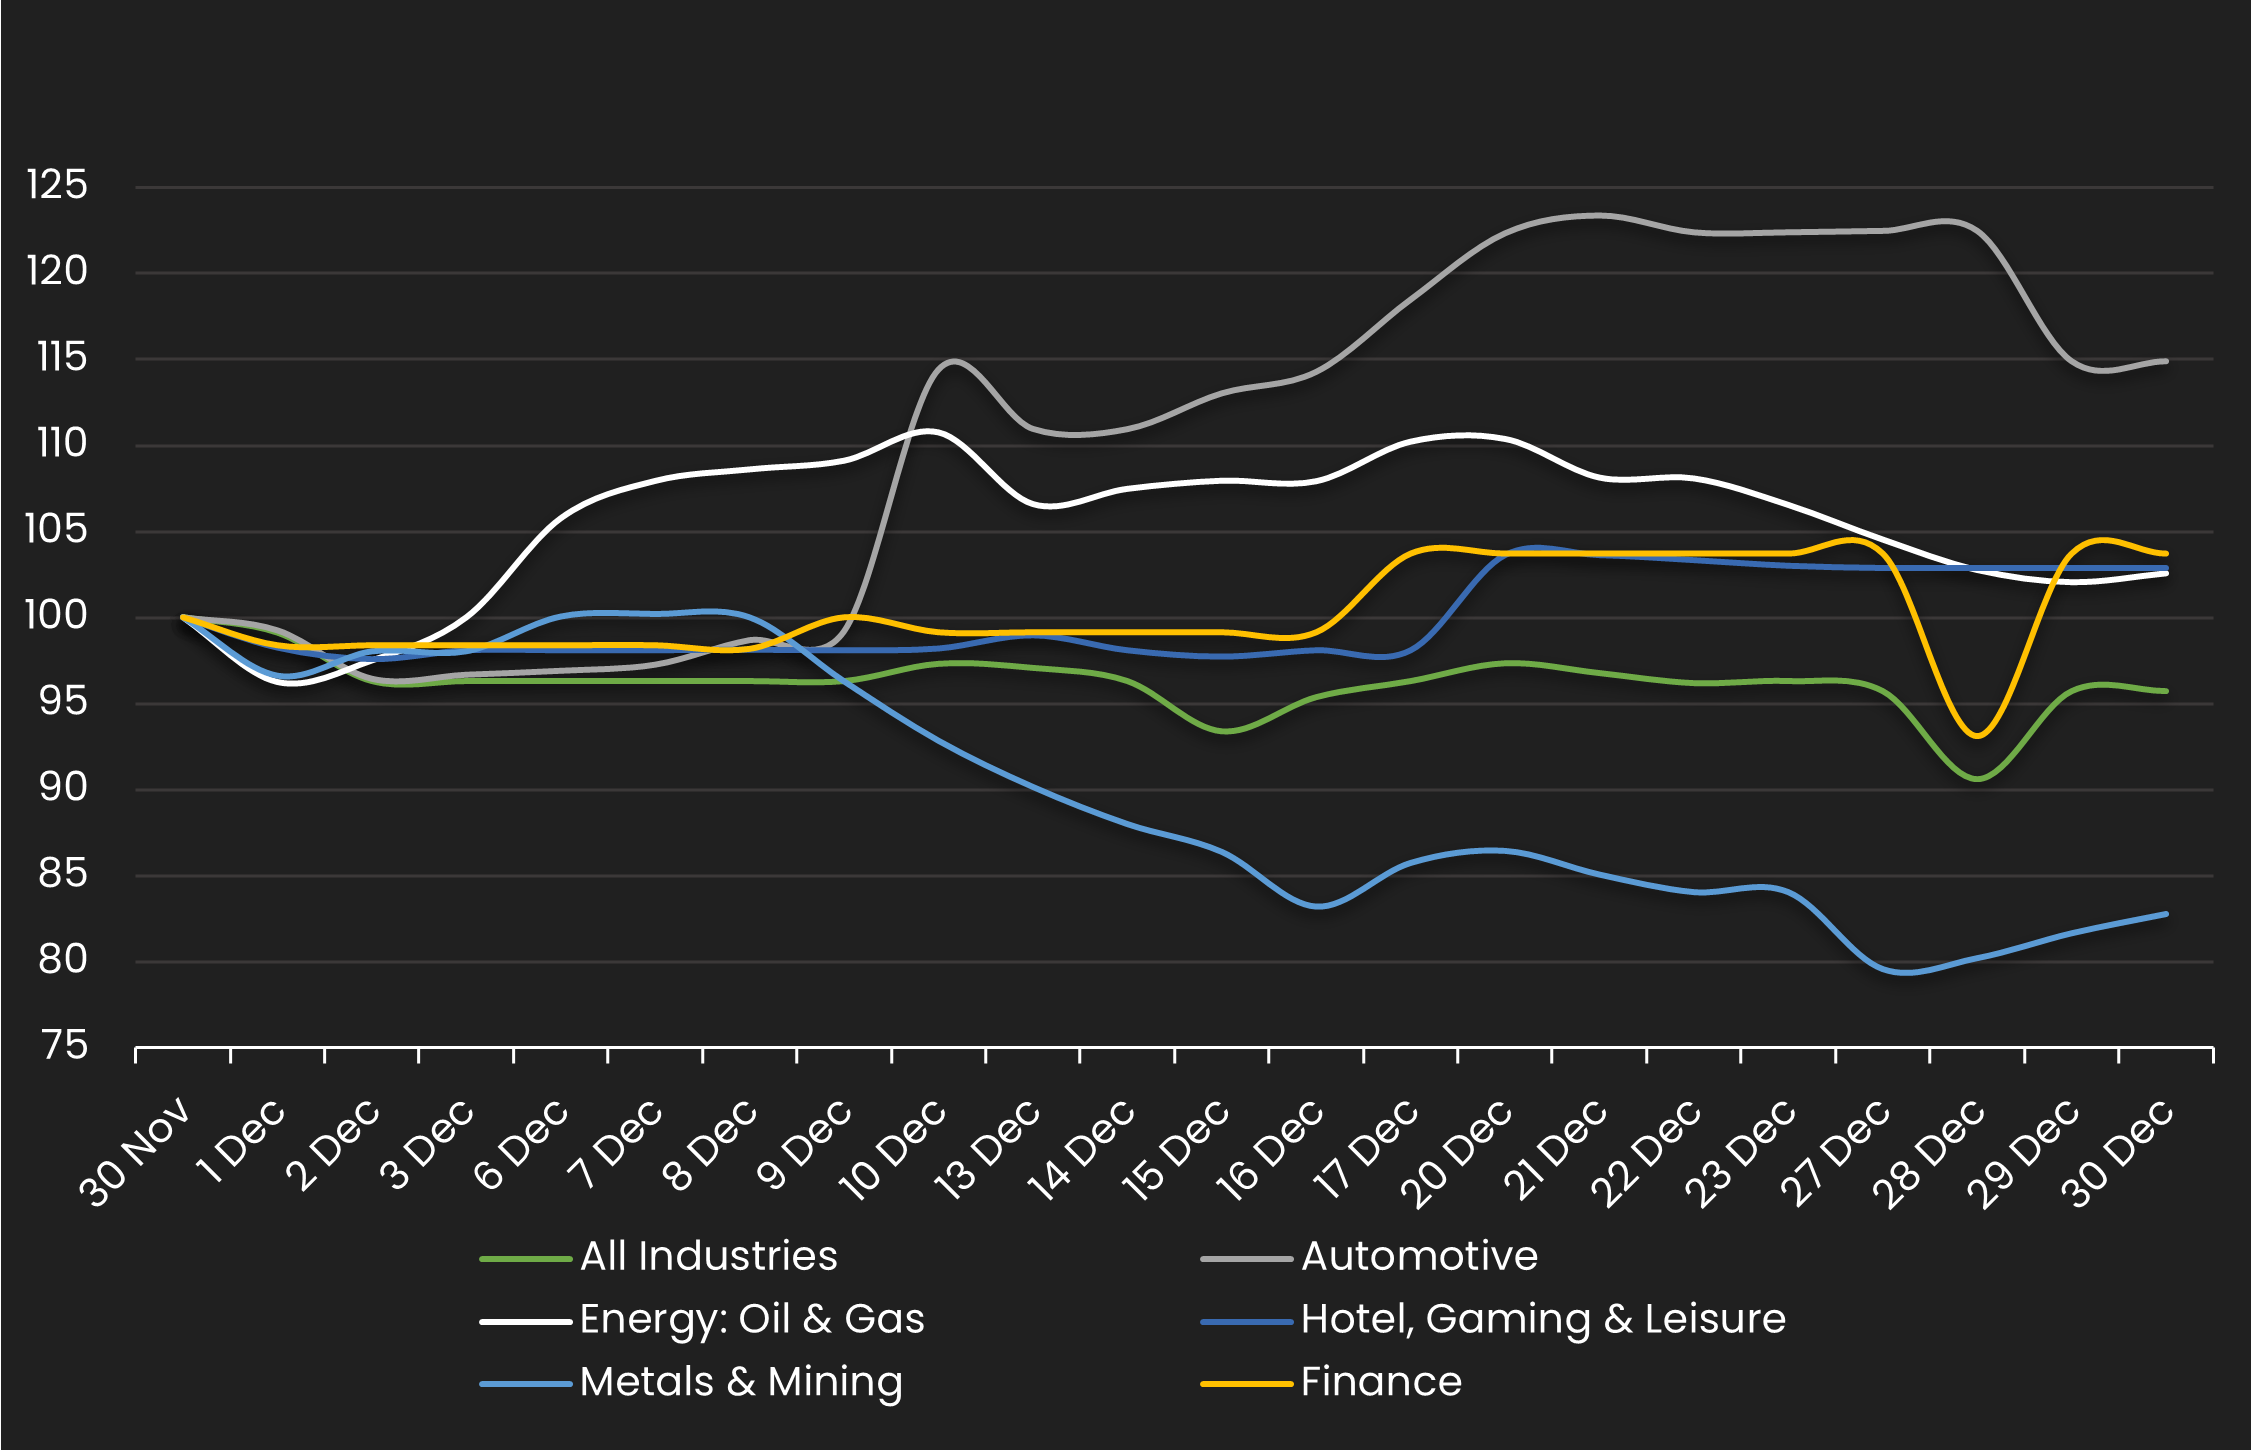
HY Spread by Industries – Monthly Comparison
Exhibits the HY spread by industry for the month ending 11/30/22 vs. the month ending 12/31/22
| INDUSTRIES | PREVIOUS SPREAD | CURRENT SPREAD | BPS CHANGE | MONTHLY PERFORMANCE | CDS COUNT |
|---|---|---|---|---|---|
| All Industries | 171 | 164 | -7 | Tighter | 248.00 |
| Automotive | 245 | 281 | 36 | Wider | 9.00 |
| Energy: Oil & Gas | 140 | 143 | 4 | Wider | 15.00 |
| Hotel, Gaming & Leisure | 321 | 330 | 9 | Wider | 11.00 |
| Metals & Mining | 178 | 147 | -31 | Tighter | 9.00 |
| Finance | 135 | 140 | 5 | Wider | 23.00 |
Stay up-to-date with monthly summaries.
Related Resources
About SOLVE
SOLVE is the leading market data platform provider for fixed-income securities, trusted by sophisticated buy-side and sell-side firms worldwide. Founded in 2011, SOLVE leverages its AI-driven technology and deep industry expertise to offer unparalleled transparency into markets, reduce risk, and save hundreds of hours across front-office workflows. With the largest real-time datasets for Securitized Products, Municipal Bonds, Corporate Bonds, Syndicated Bank Loans, Convertible Bonds, CDS, and Private Credit, SOLVE empowers clients to transform the way they bring new securities to market, trade on secondary markets, and value highly illiquid securities. Headquartered in Connecticut, with offices across the globe, SOLVE is the definitive source for market pricing in fixed-income markets.
