BDC Filing Season: Q1 2026 Week 1
BDC Filing Season Q1 2026 Week 1
BDC data provided by the Workstation BDC Data, a SOLVE product. For more information about our BDC data or our other products please contact marketpulse@solvefixedincome.com.
Filing Recap
BDC Filing season is in full swing. This report will analyze 41 BDCs that filed this week. Aggregate Fair Value reported by these BDCs is 117.39 Billion USD which is approximately 21.31% of aggregate AUM of all BDCs.
| Name | Number of Investments | % Portfolio | Cost | % Gain/Loss | Principal Value | Fair Value | FV Yield | Filtered Yield | Cost Yield |
|---|---|---|---|---|---|---|---|---|---|
| Blue Owl Capital Corp. | 351 | 100.00% | 15,404,547 | -0.331% | 17,674,737 | 15,353,572 | 5.25% | 5.24% | 6.36% |
| Blackstone Secured Lending Fund | 700 | 100.00% | 14,648,197 | -2.422% | 14,375,045 | 14,293,416 | 11.09% | 8.97% | 9.09% |
| Blue Owl Technology Finance Corp. | 295 | 100.00% | 14,420,559 | -2.288% | 17,743,588 | 14,090,629 | 5.37% | 5.36% | 6.37% |
| Sixth Street Lending Partners | 122 | 100.00% | 8,595,040 | 0.434% | 8,614,635 | 8,632,315 | 7.51% | 6.92% | 7.87% |
| Golub Capital BDC Inc. | 1,797 | 100.00% | 8,563,254 | -1.866% | 7,956,162 | 8,403,483 | 9.83% | 9.38% | 9.29% |
| Prospect Capital | 203 | 100.00% | 6,192,901 | 1.769% | 8,475,492 | 6,302,465 | — | 11.06% | 25.91% |
| Hercules Capital Inc. | 361 | 100.00% | 4,778,449 | -1.013% | 4,564,314 | 4,730,067 | 8.74% | 8.63% | 8.09% |
| Morgan Stanley Direct Lending Fund | 607 | 100.00% | 3,868,936 | -2.571% | — | 3,769,463 | 10.70% | 9.31% | 9.32% |
| Sixth Street Specialty Lending Inc. | 219 | 100.00% | 3,324,332 | -0.328% | 3,197,149 | 3,313,441 | 12.26% | 7.72% | 8.90% |
| T. Rowe Price OHA Private Credit Fund | 384 | 100.00% | 3,038,758 | -1.813% | 1,158,474 | 2,983,663 | 16.89% | 9.29% | 13.98% |
| MidCap Financial Investment Corp. | 611 | 100.00% | 3,213,462 | -7.522% | 3,247,736 | 2,971,742 | 49.12% | 8.59% | 18.45% |
| Oaktree Specialty Lending Corp. | 374 | 100.00% | 3,119,163 | -9.667% | 3,676,960 | 2,817,628 | — | 9.30% | — |
| BlackRock Private Credit Fund | 470 | 100.00% | 2,391,097 | 10.072% | 2,435,281 | 2,631,923 | 9.29% | 8.75% | 8.75% |
| Trinity Capital Inc. | 516 | 100.00% | 2,488,011 | 0.610% | 2,244,979 | 2,503,185 | 11.91% | 10.51% | 9.15% |
| SLR Investment Corp. | 107 | 100.00% | 2,532,774 | -1.209% | 1,650,791 | 2,502,148 | 9.83% | 9.59% | 7.66% |
| New Mountain Finance Corp | 360 | 100.00% | 2,525,646 | -8.404% | 2,007,751 | 2,313,379 | 14.15% | 9.83% | 11.56% |
| Nuveen Churchill Direct Lending Corp. | 558 | 100.00% | 2,092,695 | -2.225% | 7,452,193 | 2,046,124 | 9.74% | 9.37% | 9.23% |
| Cion Investment Corp. | 237 | 100.00% | 1,964,713 | -8.410% | 1,676,677 | 1,799,474 | 39.14% | 14.71% | 29.12% |
| BlackRock TCP Capital Corp. | 324 | 100.00% | 1,535,497 | -3.489% | 1,433,976 | 1,481,927 | — | 10.90% | 43.25% |
| Fidus Investment Corp | 246 | 100.00% | 1,384,412 | 2.392% | 1,252,163 | 1,417,534 | 11.37% | 11.10% | 11.18% |
| Grand Total | 12,604 | 100% | 119,724,040 | -1.949% | — | 117,390,792 | — | 9.35% | — |
Non-Accruals
At least 34 BDCs that filed this week have reported Non–Accruals amounting to 2.7 Billion USD at Cost. Blackstone Secured Lending Fund and Blue Owl Capital Corp. are leading the Non-Accruals list.
| Name | Number of Investments | % Portfolio | Cost | % Gain/Loss | Principal Value | Fair Value | FV Yield | Filtered Yield | Cost Yield |
|---|---|---|---|---|---|---|---|---|---|
| Blackstone Secured Lending Fund | 13 | 2.98% | 673,783 | -36.696% | 710,964 | 426,532 | 43.5% | — | 11.9% |
| Blue Owl Capital Corp. | 15 | 1.00% | 309,642 | -50.486% | 357,366 | 153,316 | — | — | — |
| MidCap Financial Investment Corp. | 31 | 3.50% | 170,541 | -38.996% | 191,276 | 104,036 | 59.5% | — | 20.4% |
| Golub Capital BDC Inc. | 27 | 0.92% | 143,770 | -45.937% | 169,938 | 77,727 | 58.0% | 11.5% | 12.5% |
| Oaktree Specialty Lending Corp. | 37 | 2.47% | 167,301 | -58.474% | 212,362 | 69,473 | — | — | — |
| New Mountain Finance Corp | 13 | 2.18% | 90,630 | -44.431% | 91,332 | 50,362 | 45.4% | — | 10.3% |
| Sixth Street Lending Partners | 4 | 0.58% | 64,593 | -22.314% | 65,196 | 50,180 | — | — | 16.5% |
| Sixth Street Specialty Lending Inc. | 7 | 1.43% | 63,874 | -25.732% | 69,445 | 47,438 | 98.8% | — | 13.6% |
| Prospect Capital | 13 | 0.70% | 281,104 | -84.347% | 828,091 | 44,000 | — | — | — |
| Morgan Stanley Direct Lending Fund | 8 | 0.96% | 52,759 | -31.661% | 53,135 | 36,055 | 38.1% | — | 11.8% |
| BlackRock TCP Capital Corp. | 17 | 2.40% | 110,545 | -67.844% | 151,091 | 35,547 | — | — | — |
| Gladstone Capital Corp. | 7 | 3.09% | 43,935 | -35.930% | 43,935 | 28,149 | 10.7% | 10.7% | 11.0% |
| Cion Investment Corp. | 12 | 1.45% | 99,964 | -73.903% | 140,407 | 26,088 | — | — | — |
| Trinity Capital Inc. | 6 | 0.97% | 41,190 | -40.779% | 40,238 | 24,393 | 75.1% | — | 6.5% |
| Barings BDC | 12 | 1.01% | 48,169 | -50.325% | 53,149 | 23,928 | — | — | 8.9% |
| Horizon Technology Finance Corp. | 11 | 3.17% | 30,086 | -22.599% | 31,393 | 23,287 | 17.9% | — | 16.9% |
| Blue Owl Technology Finance Corp. | 3 | 0.13% | 40,668 | -54.918% | 43,393 | 18,334 | — | — | — |
| TriplePoint Venture Growth BDC Corp. | 9 | 2.03% | 38,633 | -58.401% | 43,702 | 16,071 | — | — | 9.0% |
| WhiteHorse Finance Inc. | 7 | 2.46% | 29,627 | -51.244% | 36,257 | 14,445 | — | — | 62.2% |
| BCP Investment Corp | 12 | 2.57% | 34,417 | -64.323% | 53,487 | 12,279 | — | — | — |
| Grand Total | 334 | 1.21% | 2,740,754 | -51.24% | 3,610,807 | 1,336,455 | — | 10.81% | — |
Payment in-Kind (PIK)
BDCs are increasingly using payment-in-kind (PIK) as a credit management tool to preserve liquidity. In the filings from this week, PIK accounted for 17.9% of BDCs’ portfolios, amounting to 21.4 billion USD at Cost.
| Name | Number of Investments | % Portfolio | Cost | % Gain/Loss | Principal Value | Fair Value | FV Yield | Filtered Yield | Cost Yield |
|---|---|---|---|---|---|---|---|---|---|
| Blue Owl Technology Finance Corp. | 43 | 18.68% | 2,781,873 | -5.398% | — | 2,631,701 | — | — | — |
| Blue Owl Capital Corp. | 57 | 14.99% | 2,505,908 | -8.161% | — | 2,301,393 | — | — | — |
| Prospect Capital | 52 | 35.16% | 2,564,065 | -13.587% | 2,654,413 | 2,215,688 | — | 10.16% | 11.33% |
| Blackstone Secured Lending Fund | 84 | 15.00% | 2,315,679 | -7.410% | 2,350,898 | 2,144,085 | 12.99% | 9.94% | 9.68% |
| Hercules Capital Inc. | 61 | 44.86% | 2,148,504 | -1.239% | 2,143,188 | 2,121,875 | 8.04% | 7.82% | 7.22% |
| Golub Capital BDC Inc. | 224 | 17.75% | 1,581,847 | -5.689% | 1,630,818 | 1,491,855 | 11.50% | 10.78% | 10.36% |
| Sixth Street Lending Partners | 18 | 15.61% | 1,339,891 | 0.556% | 1,334,223 | 1,347,340 | 9.57% | 8.64% | 9.14% |
| Morgan Stanley Direct Lending Fund | 70 | 13.32% | 565,912 | -11.305% | — | 501,936 | 17.55% | 10.23% | 10.45% |
| Barings BDC | 74 | 18.11% | 482,304 | -10.992% | — | 429,291 | 21.65% | 8.88% | 10.36% |
| New Mountain Finance Corp | 44 | 18.02% | 489,734 | -14.861% | 334,545 | 416,953 | 24.45% | 12.07% | 11.59% |
| Sixth Street Specialty Lending Inc. | 26 | 12.40% | 422,540 | -2.755% | 406,476 | 410,900 | 17.37% | 9.75% | 10.71% |
| T. Rowe Price OHA Private Credit Fund | 50 | 13.68% | 441,491 | -7.561% | 244,658 | 408,111 | 26.62% | 10.42% | 16.89% |
| Cion Investment Corp. | 37 | 19.79% | 449,707 | -20.826% | 490,972 | 356,049 | 42.18% | 15.30% | 32.41% |
| Fidus Investment Corp | 32 | 24.35% | 360,843 | -4.326% | 370,375 | 345,234 | 13.92% | 13.52% | 13.15% |
| Oaktree Specialty Lending Corp. | 38 | 10.51% | 321,075 | -7.760% | 346,452 | 296,158 | 7.65% | 7.65% | 7.32% |
| BlackRock TCP Capital Corp. | 50 | 17.78% | 332,834 | -20.849% | 348,445 | 263,440 | — | 12.57% | 13.56% |
| Barings Capital Investment Corp | 63 | 17.47% | 253,548 | -10.932% | — | 225,830 | 23.53% | 8.76% | 10.49% |
| Nuveen Churchill Direct Lending Corp. | 84 | 9.84% | 230,516 | -12.643% | 239,904 | 201,372 | 14.77% | 12.82% | 12.17% |
| Trinity Capital Inc. | 14 | 7.62% | 197,769 | -3.499% | 197,154 | 190,850 | 5.34% | 1.75% | 2.65% |
| Grand Total | 1,421 | 16.99% | 21,461,876 | -7.94% | — | 19,758,563 | — | 9.71% | 10.25% |
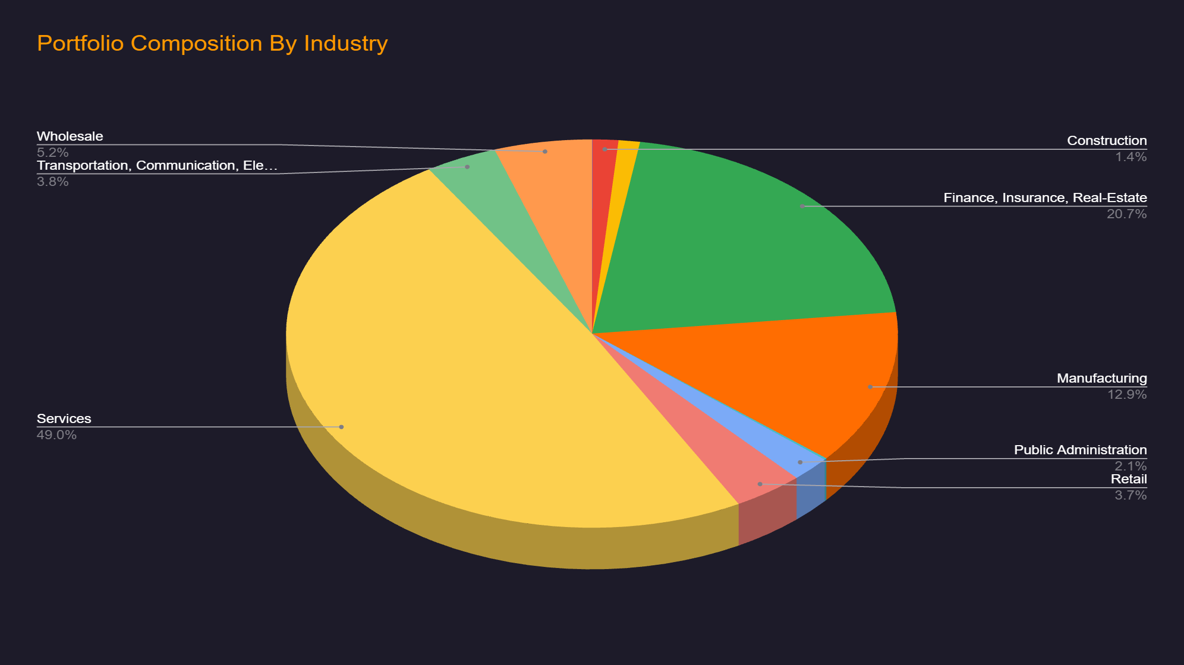
Portfolio Composition By Industry
The chart below is a bird’s-eye view of the BDCs aggregate Industry Diversification.
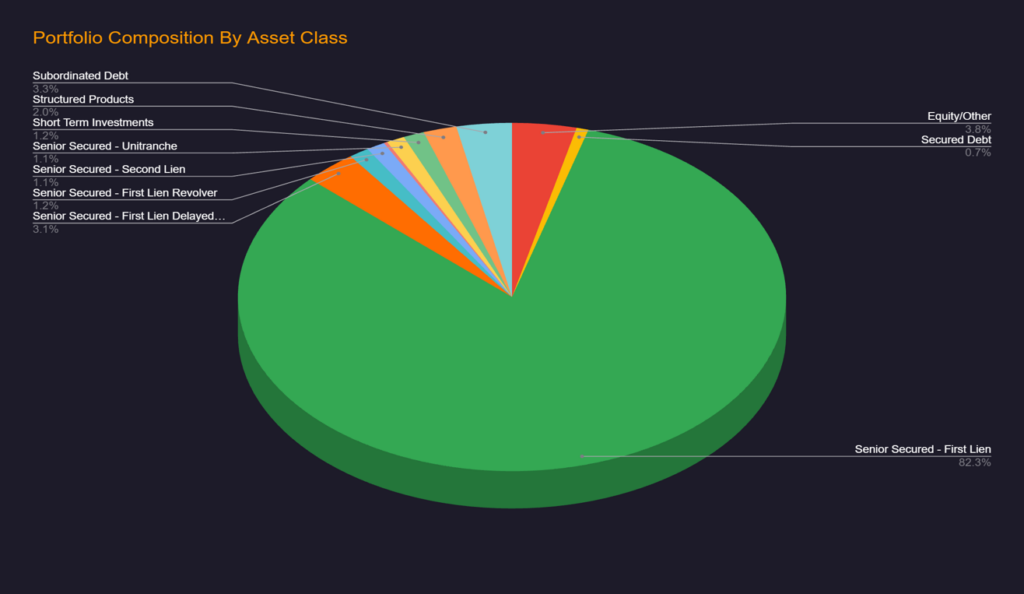
Portfolio Composition By Asset Class
The chart below is an overview of the BDCs aggregate Diversification by Asset Class.
BDC Investments Maturing in the next 12 Months
The table below summarizes aggregate investments of this week’s BDCs that are maturing in the next 12 months, which combined are worth more than 6.5 Billion USD at cost.
| BDC | Cost (1000) | FV (1000) |
|---|---|---|
| Prospect Capital | 1,531,251 | 1,406,518 |
| Golub Capital BDC Inc. | 809,374 | 790,128 |
| Blackstone Secured Lending Fund | 432,390 | 393,788 |
| Hercules Capital Inc. | 385,127 | 383,785 |
| MidCap Financial Investment Corp. | 305,765 | 263,985 |
| Blue Owl Technology Finance Corp. | 266,778 | 263,247 |
| Cion Investment Corp. | 265,468 | 231,252 |
| BlackRock TCP Capital Corp. | 254,760 | 240,241 |
| Trinity Capital Inc. | 212,168 | 205,627 |
| Barings BDC | 207,359 | 196,177 |
| Sixth Street Specialty Lending, Inc. | 204,351 | 202,300 |
| Blue Owl Capital Corp. | 176,760 | 164,505 |
| Fidus Investment Corp | 159,709 | 159,134 |
| TriplePoint Venture Growth BDC Corp. | 146,947 | 112,179 |
| Oaktree Specialty Lending Corp. | 140,557 | 96,423 |
| Morgan Stanley Direct Lending Fund | 124,039 | 109,301 |
| Gladstone Capital Corp. | 97,854 | 76,219 |
| Sixth Street Lending Partners | 97,128 | 98,293 |
| Nuveen Churchill Direct Lending Corp. | 91,778 | 84,806 |
| Barings Capital Investment Corp | 91,163 | 84,837 |
| SLR Investment Corp. | 79,382 | 78,717 |
| Saratoga Investment Corp. | 74,203 | 70,415 |
| OFS Capital Corp | 56,400 | 50,185 |
| WhiteHorse Finance Inc. | 51,989 | 49,407 |
| BlackRock Private Credit Fund | 50,557 | 50,717 |
| Horizon Technology Finance Corp. | 41,588 | 34,013 |
| Great Elm Capital Corp. | 38,204 | 33,191 |
| Advanced Flower Capital Inc. | 33,080 | 26,369 |
| SCP Private Credit Income BDC LLC | 24,151 | 22,810 |
| BlackRock Direct Lending Corp. | 21,123 | 20,790 |
| New Mountain Finance Corp | 16,989 | 14,919 |
| Rand Capital Corp. | 12,637 | 7,574 |
| Palmer Square Capital BDC Inc. | 11,007 | 1,918 |
| Oxford Square Capital Corp. | 6,540 | 1 |
| PhenixFIN Corp. | 4,236 | 3,990 |
| SuRo Capital Corp. | 140 | 72 |
| Grand Total | 6,522,952 | 6,027,833 |
Top 10 BDC Investments
BDCs’ portfolio quality can be measured by taking a deeper dive into the BDC’s top 10 investments. While these investments are small in number, they are the primary determinant of a BDC’s portfolio performance. Top 10 Investments of BDCs that filed this week amount to 29.4 Billion USD (Cost) accounting for 24.61% of their aggregate holdings (Cost).
| BDC | Cost (1000) | FV (1000) |
|---|---|---|
| Prospect Capital | 3,335,306 | 3,392,685 |
| Blue Owl Capital Corp. | 3,250,655 | 3,402,045 |
| Blackstone Secured Lending Fund | 2,908,546 | 2,680,931 |
| Sixth Street Lending Partners | 2,763,098 | 2,809,656 |
| Blue Owl Technology Finance Corp. | 2,292,964 | 2,271,477 |
| Hercules Capital Inc. | 1,226,183 | 1,231,835 |
| Golub Capital BDC Inc. | 1,080,452 | 1,062,123 |
| SLR Investment Corp. | 1,078,761 | 1,084,374 |
| New Mountain Finance Corp | 888,524 | 759,367 |
| Sixth Street Specialty Lending, Inc. | 720,568 | 691,754 |
| Oaktree Specialty Lending Corp. | 683,306 | 543,405 |
| Trinity Capital Inc. | 587,391 | 611,759 |
| Morgan Stanley Direct Lending Fund | 575,695 | 546,896 |
| Cion Investment Corp. | 572,931 | 483,403 |
| T. Rowe Price OHA Private Credit Fund | 550,542 | 534,181 |
| Barings BDC | 537,239 | 583,749 |
| MidCap Financial Investment Corp. | 517,523 | 456,157 |
| Saratoga Investment Corp. | 497,463 | 475,627 |
| BlackRock TCP Capital Corp. | 492,917 | 457,781 |
| 5C Lending Partners Corp. | 447,784 | 440,844 |
| BlackRock Private Credit Fund | 430,242 | 429,732 |
| TriplePoint Venture Growth BDC Corp. | 357,082 | 273,853 |
| Gladstone Capital Corp. | 349,363 | 353,520 |
| Fidus Investment Corp | 338,016 | 330,329 |
| Advanced Flower Capital Inc. | 307,558 | 240,370 |
| Horizon Technology Finance Corp. | 301,056 | 286,286 |
| Nuveen Churchill Direct Lending Corp. | 260,668 | 259,161 |
| Barings Capital Investment Corp | 260,186 | 288,610 |
| WhiteHorse Finance Inc. | 254,507 | 246,022 |
| PhenixFIN Corp. | 229,171 | 204,244 |
| BCP Investment Corp | 197,768 | 162,329 |
| Great Elm Capital Corp. | 181,854 | 120,988 |
| Oxford Square Capital Corp. | 173,295 | 90,764 |
| SCP Private Credit Income BDC LLC | 146,922 | 132,151 |
| OFS Capital Corp | 142,448 | 116,019 |
| Palmer Square Capital BDC Inc. | 131,254 | 102,403 |
| SuRo Capital Corp. | 126,958 | 309,628 |
| OHA Senior Private Lending Fund (U) LLC | 123,938 | 122,827 |
| Rand Capital Corp. | 48,771 | 35,710 |
| SLR HC BDC LLC | 47,363 | 46,614 |
| BlackRock Direct Lending Corp. | 47,132 | 46,512 |
| Grand Total | 29,463,399 | 28,718,121 |
Source: SOLVE; Copyright (c) 2025.Redistribution Strictly Prohibited. Data can not be used in any way to populate a database nor shared with unauthorized users. See ADI Terms. All rights reserved. +1 (646) 699-5041.
BDC Filing Season Recaps are written by Sourav Srimal, Andrew Robartes, and Nayan Raj. For more information about our BDC data or our other products please contact marketpluse@solvefixedincome.com.
Sourav Srimal
Chief Growth Officer
ssrimal@solvefixedincome.com
Andrew Robartes
Data Analyst
arobartes@solvefixedincome.com
Ivan Chestaro
Data Analyst
ichestaro@solvefixedincome.com
SOLVE’s BDC Data & Analytics empowers businesses like yours with detailed and standardized BDC portfolio and position data within minutes of filing with the SEC. Why Choose SOLVE’s BDC Data & Analytics solution?
Stay up-to-date with weekly summaries.
Related Resources
About SOLVE
SOLVE is the leading market data platform provider for fixed-income securities, trusted by sophisticated buy-side and sell-side firms worldwide. Founded in 2011, SOLVE leverages its AI-driven technology and deep industry expertise to offer unparalleled transparency into markets, reduce risk, and save hundreds of hours across front-office workflows. With the largest real-time datasets for Securitized Products, Municipal Bonds, Corporate Bonds, Syndicated Bank Loans, Convertible Bonds, CDS, and Private Credit, SOLVE empowers clients to transform the way they bring new securities to market, trade on secondary markets, and value highly illiquid securities. Headquartered in Connecticut, with offices across the globe, SOLVE is the definitive source for market pricing in fixed-income markets.
