Syndicated Bank Loan Market Summary – Week Ending 3/6/26
Our newsletter presents key trends derived from observable Syndicated Bank Loan pricing data over a weekly period.
New Issues
Loans issued during the week ending 3/6/26
| Issuer | Amount (MM) | Loan Type | Maturity | Rate |
| Emeria SASU | 73 | Term Loan | 3/28/2028 | E+525 |
| Shelf Drilling Holdings LTD | 175 | Revolving Credit | 9/27/2028 | S+325 |
| Pinnacle Bidco PLC | 176 | Revolving Credit | 6/27/2028 | – |
| iSolved Inc. | 75 | Revolving Credit | 10/16/2028 | S+450 |
Forward Calendar
Forward calendar during the week ending 3/6/26
| Issuer | Banks | Expected Issue Date |
| AECOM | BofA | Q1 2026 |
| Herbalife | BofA, RBB | Q1 2026 |
| Technimark | ANT | Q1 2026 |
Largest Loans
Highlights the weekly price movements and quote depth for the 20 largest bank loans between 2/27/26-3/6/26
| Rank | Size (MM) | Name | Change | PRC | PRC-1W | Dealers |
| 1 | 7250 | HOLOGIC INC (USD) TL S+225 1/14/2033 | 0.00 | 99.21 | 98.73 | 11 |
| 2 | 6272 | UKG INC (USD) TL S+250 2/9/2031 | 0.01 | 95.69 | 94.85 | 17 |
| 3 | 6145.2 | MAGNOLIA (USD) TL L+375 2/1/2028 | -0.01 | 84.79 | 85.30 | 13 |
| 4 | 5500 | DAYFORCE INC (USD) TL B S+300 10/7/2032 | 0.01 | 92.53 | 91.58 | 21 |
| 5 | 5080 | ALLIED UNIVERSAL HOLDCO LLC (USD) TL B S+325 8/5/2032 | 0.00 | 100.11 | 99.89 | 17 |
| 6 | 4741 | INTERNET BRANDS (USD) TL B3 S+425 4/20/2028 | 0.00 | 81.17 | 80.93 | 16 |
| 7 | 4588.66 | AMWINS GROUP INC (USD) TL B S+200 1/30/2032 | 0.01 | 99.42 | 98.57 | 18 |
| 8 | 4395 | ENSEMBLE HEALTH (USD) TL B S+300 1/28/2033 | 0.02 | 97.97 | 96.01 | 11 |
| 9 | 4300 | MASMOVIL IBERCOM SA (EUR) TL B E+275 3/20/2031 | 0.00 | 99.77 | 100.09 | 14 |
| 10 | 4230 | TK ELEVATOR HOLDCO GMBH (USD) TL B S+325 4/11/2030 | 0.00 | 99.88 | 99.93 | 14 |
| 11 | 4204 | JANE STREET (USD) TL B S+200 12/10/2031 | 0.01 | 97.54 | 96.36 | 16 |
| 12 | 4084 | INSPIRE BRANDS (USD) TL S+250 12/15/2030 | 0.00 | 99.80 | 99.56 | 13 |
| 13 | 4073.83 | MEDLINE BORROWER LP (USD) TL B S+200 10/23/2028 | 0.00 | 100.20 | 100.14 | 10 |
| 14 | 4001 | CITADEL SECS GLOBAL HLDGS LLC (USD) TL B S+200 10/28/2031 | 0.00 | 99.99 | 99.58 | 13 |
| 15 | 3935 | SS&C TECHS INC (USD) TL B8 S+200 5/2/2031 | 0.00 | 99.49 | 99.15 | 12 |
| 16 | 3830.35 | ALLIANT HLDGS INTERMEDIATE LLC (USD) TL B S+250 9/19/2031 | 0.01 | 98.81 | 97.59 | 18 |
| 17 | 3736.25 | UFC (USD) TL B5 S+200 11/21/2031 | 0.00 | 99.90 | 100.00 | 14 |
| 18 | 3640 | TRANSDIGM INC (USD) TL J S+250 2/12/2031 | 0.00 | 99.99 | 99.97 | 17 |
| 19 | 3600 | GLOBAL MEDICAL RESPONSE INC (USD) TL S+350 9/10/2032 | 0.00 | 100.02 | 99.91 | 15 |
| 20 | 3573 | CENTRAL PARENT LLC (USD) TL B S+325 7/6/2029 | 0.06 | 66.75 | 63.00 | 16 |
| Average | 4558.96 | 0.01 | 95.65 | 100.13 | 14.8 |
Top 10 Performers
Showcases the top 10 loan performers based on the largest bid price increases between 2/27/26-3/6/26
| Rank | Name | Change | PRC | PRC-1W | Dealers |
| 1 | RACKSPACE TECH GLOBAL INC (USD) 2ND OUT TL B S+275 5/15/2028 | ▲ 17.49% | 47.96 | 40.82 | 14 |
| 2 | CONAIR HLDGS LLC (USD) TL L+375 5/17/2028 | ▲ 10.27% | 59.04 | 53.54 | 9 |
| 3 | UNITED DRUG PLC (EUR) TL B E+400 8/19/2028 | ▲ 6.04% | 88.27 | 83.24 | 7 |
| 4 | MAGENTA BUYER LLC (EUR) TL B E+350 3/1/2029 | ▲ 3.14% | 90.00 | 87.26 | 13 |
| 5 | REALPAGE INC (USD) TL B S+375 4/24/2028 | ▲ 2.63% | 94.87 | 92.45 | 13 |
| 6 | SURF HOLDINGS (USD) TL B L+350 3/5/2027 | ▲ 2.45% | 95.18 | 92.91 | 13 |
| 7 | BROADSTREET PARTNERS INC (USD) TL B S+250 6/16/2031 | ▲ 2.16% | 97.39 | 95.33 | 15 |
| 8 | ENSEMBLE HEALTH (USD) TL B S+300 1/28/2033 | ▲ 2.05% | 97.97 | 96.01 | 11 |
| 9 | FINASTRA (USA) INC (USD) TL B S+400 9/15/2032 | ▲ 1.86% | 92.55 | 90.86 | 11 |
| 10 | RED VENTURES (USD) TL B S+275 3/3/2030 | ▲ 1.85% | 85.18 | 83.63 | 12 |
Bottom 10 Performers
Showcases the bottom 10 loan performers based on the largest bid price decreases between 2/27/26-3/6/26
| Rank | Name | Change | PRC | PRC-1W | Dealers |
| 1 | BARRACUDA (USD) TL S+450 5/17/2029 | ▼ 15.12% | 58.04 | 68.38 | 16 |
| 2 | AD EDUCATION (EUR) TL B E+400 10/22/2031 | ▼ 12.64% | 69.78 | 79.88 | 13 |
| 3 | TEMPO ACQUISITION (USD) TL B S+200 8/31/2028 | ▼ 11.21% | 66.32 | 74.69 | 9 |
| 4 | SAPEC AGRO SA (EUR) TL B E+500 9/13/2030 | ▼ 8.46% | 90.85 | 99.24 | 11 |
| 5 | INEOS STYROLUTION GROUP GMBH (USD) TL B S+425 10/1/2031 | ▼ 6.73% | 70.99 | 76.11 | 4 |
| 6 | SOLERA (EUR) TL B E+400 6/4/2028 | ▼ 6.26% | 81.21 | 86.63 | 13 |
| 7 | DYNAMO NEWCO II GMBH (USD) TL B S+325 9/30/2031 | ▼ 5.37% | 94.66 | 100.03 | 4 |
| 8 | KANTAR (EUR) TL B E+450 1/30/2029 | ▼ 4.98% | 84.59 | 89.02 | 11 |
| 9 | QLIK TECHNOLOGIES (USD) TL B S+325 10/26/2030 | ▼ 4.25% | 78.05 | 81.51 | 13 |
| 10 | JETBLUE AIRWAYS CORP (USD) TL B S+475 8/27/2029 | ▼ 4.09% | 92.57 | 96.52 | 7 |
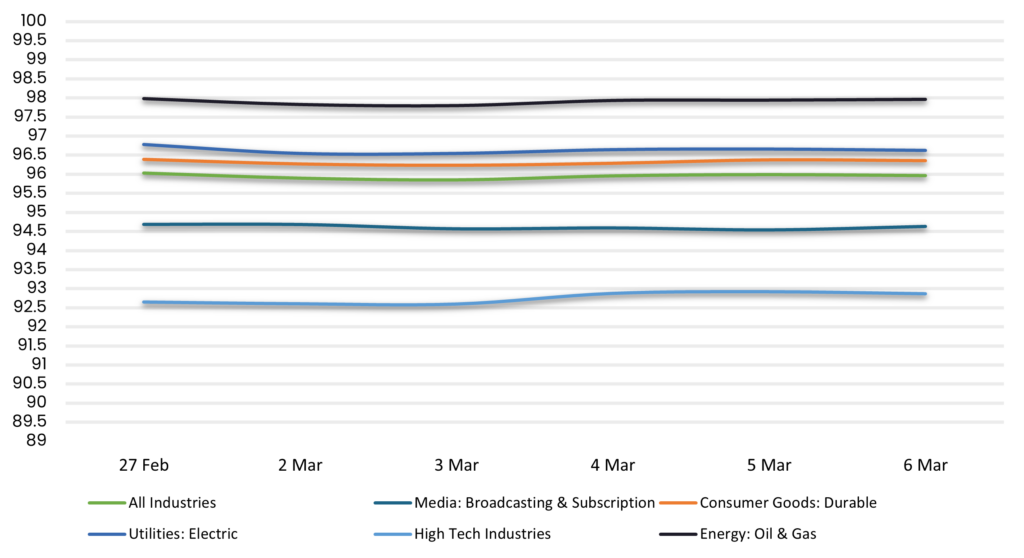
Avg Bid Price by Sector
Displays the average loan bid price by sector between 2/27/26-3/6/26. Results are based on select industry sectors, however, we offer data across 36 sectors
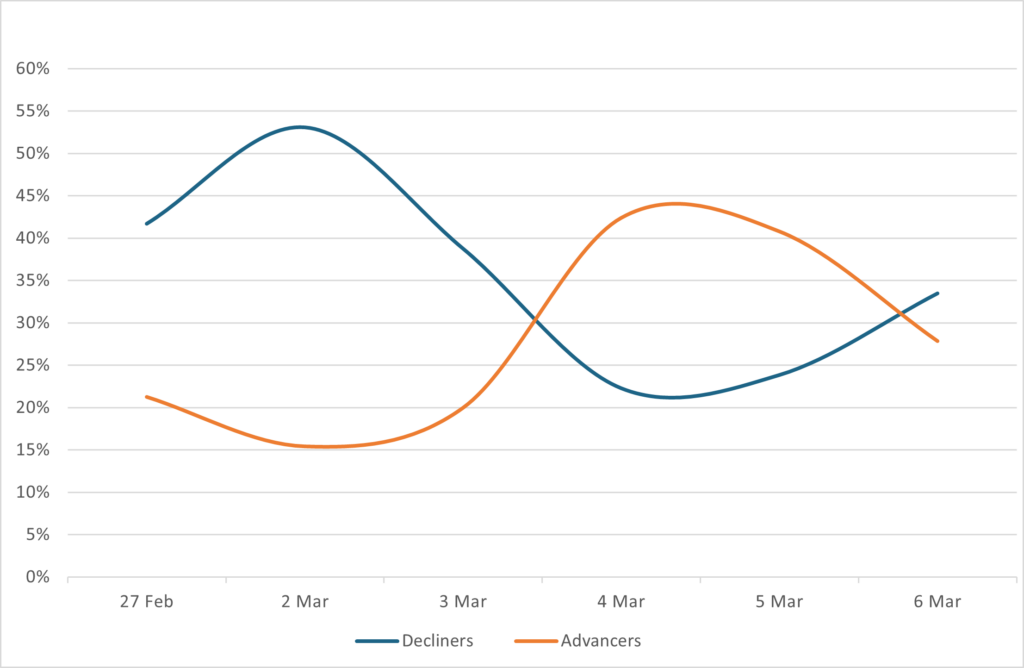
Sentiment
Reveals the percent of loans increasing in price (advancers) vs. loans decreasing in price (decliners) between 2/27/26-3/6/26
Top Quote Volume Movers: This Week vs Last Week
Exhibits the loans with the largest increase in quote volume for the week ending 2/27/26 vs. the week ending 3/6/26
| Rank | Tranche | Prior Week | This Week | Increase | % Increase |
| 1 | CERBA HEALTHCARE (EUR) TL D E+500 2/16/2029 | 26 | 62 | 36 | ▲ 138% |
| 2 | CREATIVE PLANNING LLC (USD) TL B S+200 5/10/2031 | 14 | 50 | 36 | ▲ 257% |
| 3 | CERBA HEALTHCARE (EUR) TL C E+400 2/16/2029 | 18 | 42 | 24 | ▲ 133% |
| 4 | RECKITT BENCKISER PLC (EUR) TL B E+400 9/29/2032 | 32 | 54 | 22 | ▲ 69% |
| 5 | ASTORIA ENERGY (USD) TL B S+225 6/23/2032 | 25 | 46 | 21 | ▲ 84% |
| 6 | PHENNA GROUP (EUR) TL B E+325 6/19/2031 | 15 | 35 | 20 | ▲ 133% |
| 7 | CEVA SANTE ANIMALE (EUR) TL B E+350 11/30/2030 | 58 | 78 | 20 | ▲ 34% |
| 8 | SGG (EUR) TL B E+350 7/28/2028 | 38 | 57 | 19 | ▲ 50% |
| 9 | APPLUS SERVICES SA (EUR) TL B E+350 7/11/2029 | 18 | 36 | 18 | ▲ 100% |
| 10 | HUB INTL LTD (USD) TL B S+250 6/20/2030 | 100 | 118 | 18 | ▲ 18% |
Most Quoted Loans
Ranks the loans that were quoted by the highest number of dealers between 2/27/26-3/6/26
| Rank | Tranche | Dealers |
| 1 | DAYFORCE INC (USD) TL B S+300 10/7/2032 | 21 |
| 2 | HUB INTL LTD (USD) TL B S+250 6/20/2030 | 20 |
| 3 | MAVIS TIRE EXPRESS SERVS TOPCO CORP (USD) TL B S+300 5/4/2028 | 19 |
| 4 | MICHAELS STORES (USD) TL L+425 4/15/2028 | 19 |
| 5 | CD&R FIREFLY BIDCO PLC (EUR) TL B E+325 4/29/2029 | 19 |
| 6 | ALLIANT HLDGS INTERMEDIATE LLC (USD) TL B S+250 9/19/2031 | 18 |
| 7 | WHITE CAP BUYER LLC (USD) TL B S+325 10/19/2029 | 18 |
| 8 | BMC SOFTWARE (USD) TL B S+325 7/30/2031 | 18 |
| 9 | AMWINS GROUP INC (USD) TL B S+200 1/30/2032 | 18 |
| 10 | UKG INC (USD) TL S+250 2/9/2031 | 17 |
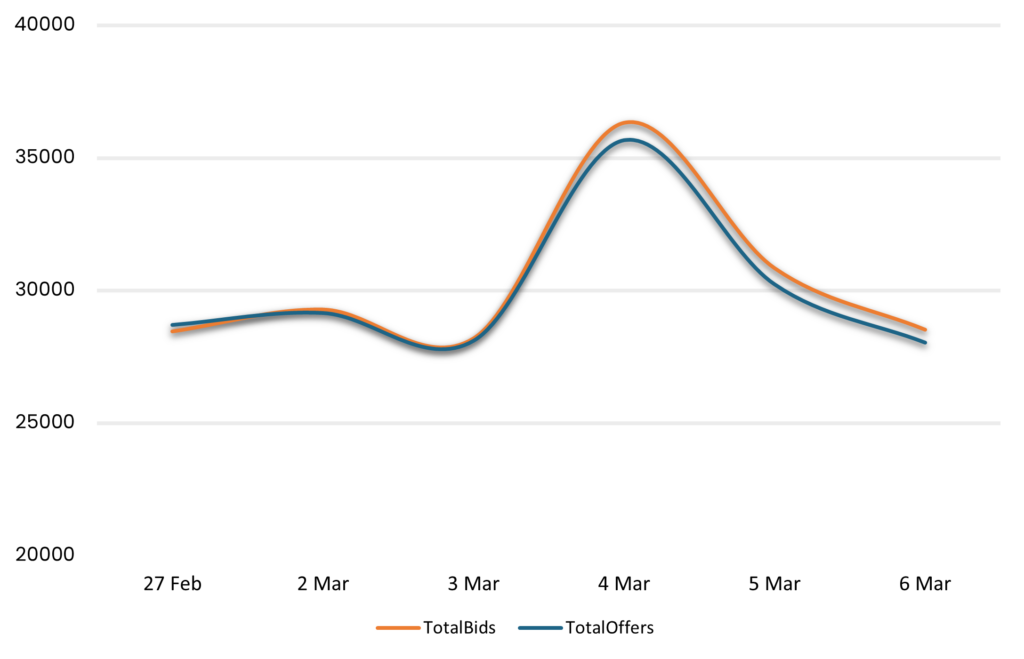
Bid and Offer Volume
Reveals the total number of quotes by bid and offer between 2/27/26-3/6/26
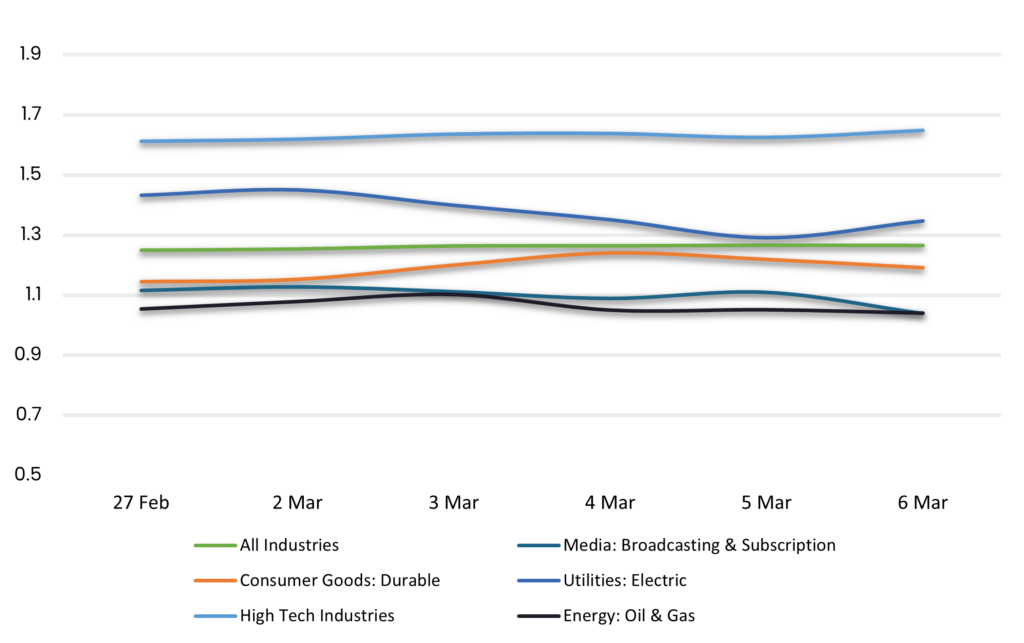
Sector Bid-Offer Spread
Results are based on select industry sectors, however, we offer data across 36 sectors
Related Resources
About SOLVE
SOLVE is the leading market data platform provider for fixed-income securities, trusted by sophisticated buy-side and sell-side firms worldwide. Founded in 2011, SOLVE leverages its AI-driven technology and deep industry expertise to offer unparalleled transparency into markets, reduce risk, and save hundreds of hours across front-office workflows. With the largest real-time datasets for Securitized Products, Municipal Bonds, Corporate Bonds, Syndicated Bank Loans, Convertible Bonds, CDS, and Private Credit, SOLVE empowers clients to transform the way they bring new securities to market, trade on secondary markets, and value highly illiquid securities. Headquartered in Connecticut, with offices across the globe, SOLVE is the definitive source for market pricing in fixed-income markets.
