Municipal Bond Market Summary – Week Ending 1/30/26
Our newsletter presents key trends derived from observable Municipal Bond pricing data over a weekly period.
Top 10 Performers
Showcases the top 10 Muni Bond performers based on price movements between 1/23/26-1/30/26
| Rank | Bond Name | Coupon | Maturity | Change | PRC | PRC-1W | Dealers |
| 1 | WILLOUGHBY-EASTLAKE O | 3.750% | 12/01/41 | ▲ 3.81% | 96.34 | 92.80 | 2 |
| 2 | DERRY TWP-C | 3.000% | 12/15/35 | ▲ 3.60% | 97.82 | 94.42 | 3 |
| 3 | SALES TAX SECURITIZTN | 3.411% | 01/01/43 | ▲ 3.49% | 80.55 | 77.83 | 6 |
| 4 | PARKER WTR & SAN DT | 4.000% | 11/01/52 | ▲ 3.20% | 93.34 | 90.45 | 2 |
| 5 | NATIONAL PARK CMNTY | 3.750% | 03/01/48 | ▲ 3.09% | 89.62 | 86.94 | 2 |
| 6 | KENTUCKY BOND CORP | 3.000% | 02/01/46 | ▲ 2.99% | 78.97 | 76.67 | 3 |
| 7 | UNIV OF ILLINOIS-A | 4.000% | 04/01/43 | ▲ 2.96% | 99.67 | 96.81 | 2 |
| 8 | KAUFMAN CO MUD #3-A | 4.000% | 03/01/42 | ▲ 2.91% | 98.93 | 96.14 | 2 |
| 9 | AMERICAN MUN PWR OH | 7.834% | 02/15/41 | ▲ 2.84% | 120.67 | 117.33 | 4 |
| 10 | OAK PARK SD-III | 4.125% | 11/01/48 | ▲ 2.72% | 96.52 | 93.97 | 2 |
Bottom 10 Performers
Showcases the bottom 10 Muni Bond performers based on price movements between 1/23/26-1/30/26
| Rank | Bond Name | Coupon | Maturity | Change | PRC | PRC-1W | Dealers |
| 1 | FLYING HORSE MET DT-A | 4.000% | 12/01/50 | ▼ -3.12% | 91.47 | 94.42 | 4 |
| 2 | GEORGIA ST HSG & FIN | 3.550% | 12/01/39 | ▼ -2.65% | 95.49 | 98.09 | 2 |
| 3 | SPARTANBURG REGL HLTH | 4.000% | 04/15/45 | ▼ -2.49% | 94.58 | 97.00 | 2 |
| 4 | N ESTRN LOCAL SD-A | 3.750% | 11/01/54 | ▼ -2.36% | 85.68 | 87.74 | 2 |
| 5 | SANGER FIN AUTH-A | 4.000% | 02/01/40 | ▼ -2.07% | 91.94 | 93.87 | 2 |
| 6 | NEW YORK CITY NY HSG | 3.150% | 11/01/36 | ▼ -2.06% | 95.64 | 97.66 | 3 |
| 7 | BETHLEHEM AREA SCH DI | 3.000% | 02/01/36 | ▼ -2.02% | 96.13 | 98.11 | 2 |
| 8 | TOLEDO LUCAS PORT-A | 4.000% | 11/15/42 | ▼ -2.02% | 90.14 | 91.99 | 2 |
| 9 | CROWLEY ISD | 4.250% | 02/01/54 | ▼ -1.98% | 96.05 | 97.99 | 2 |
| 10 | LEHIGH CO AUTH WTR | 3.232% | 12/01/50 | ▼ -1.97% | 66.99 | 68.33 | 2 |
Top 10 State Performers
Showcases the top 10 Muni State performers based on yield movements between 1/23/26-1/30/26
| Rank | State | Change | YLD | YLD-1W |
| 1 | DC | ▼ 27 bps | 3.14% | 3.42% |
| 2 | AK | ▼ 17 bps | 3.33% | 3.50% |
| 3 | RI | ▼ 12 bps | 3.10% | 3.22% |
| 4 | CO | ▼ 12 bps | 3.39% | 3.50% |
| 5 | NE | ▼ 11 bps | 3.29% | 3.40% |
| 6 | SC | ▼ 11 bps | 3.21% | 3.31% |
| 7 | IL | ▼ 10 bps | 3.60% | 3.70% |
| 8 | KS | ▼ 10 bps | 3.40% | 3.50% |
| 9 | VA | ▼ 10 bps | 3.12% | 3.22% |
| 10 | MT | ▼ 9 bps | 3.31% | 3.40% |
Bottom 10 State Performers
Showcases the bottom 10 Muni State performers based on yield movements between 1/23/26-1/30/26
| Rank | State | Change | YLD | YLD-1W |
| 1 | NM | ▲ 7 bps | 3.41% | 3.34% |
| 2 | AR | ▲ 5 bps | 3.55% | 3.50% |
| 3 | DE | ▲ 4 bps | 3.04% | 2.99% |
| 4 | AL | ▲ 4 bps | 3.68% | 3.64% |
| 5 | NH | ▲ 4 bps | 3.21% | 3.17% |
| 6 | MS | ▲ 4 bps | 3.66% | 3.62% |
| 7 | OH | ▲ 3 bps | 3.40% | 3.37% |
| 8 | OR | ▲ 2 bps | 3.34% | 3.32% |
| 9 | SD | ▲ 2 bps | 3.35% | 3.32% |
| 10 | MD | ▲ 2 bps | 3.03% | 3.02% |
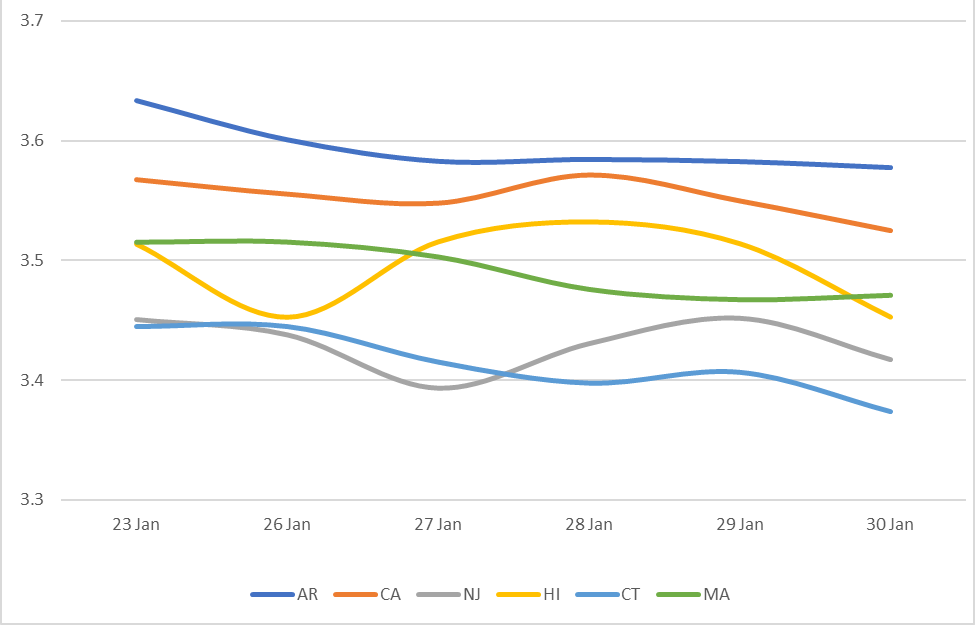
10 Year Yield by State – All
Displays the average Muni 10 year yield by state between 1/23/26-1/30/26 (General Obligation and Revenue Bonds). Results are based on 6 select states, however, we offer data across all 50 states and U.S. territories
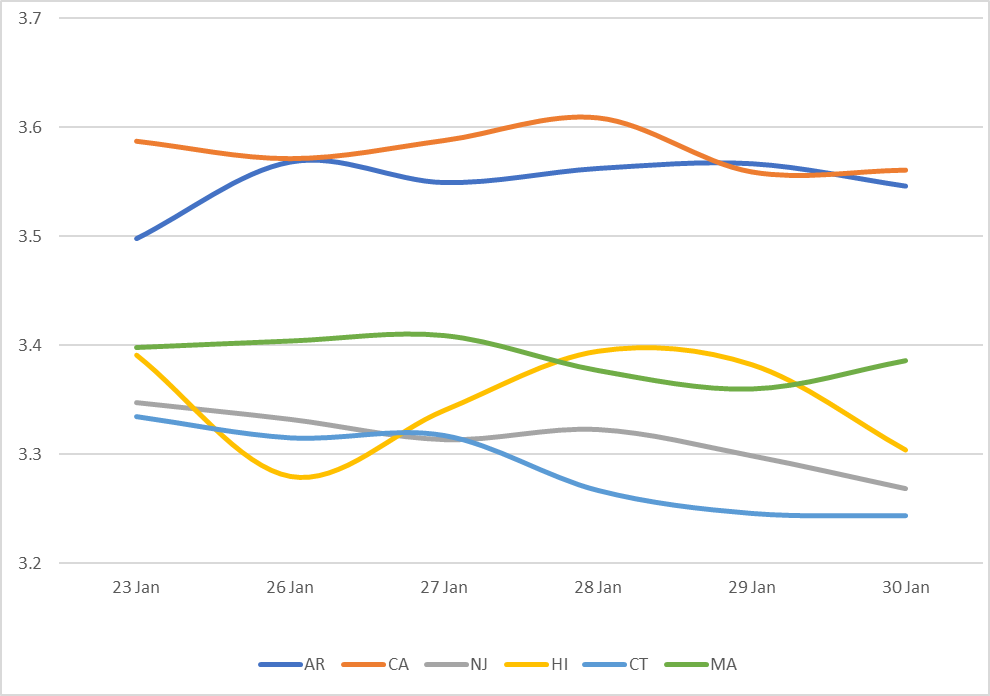
10 Year Yield by State – GO Only
Displays the average Muni 10 year yield by state between 1/23/26-1/30/26 (General Obligation Bonds only). Results are based on 6 select states, however, we offer data across all 50 states and U.S. territories
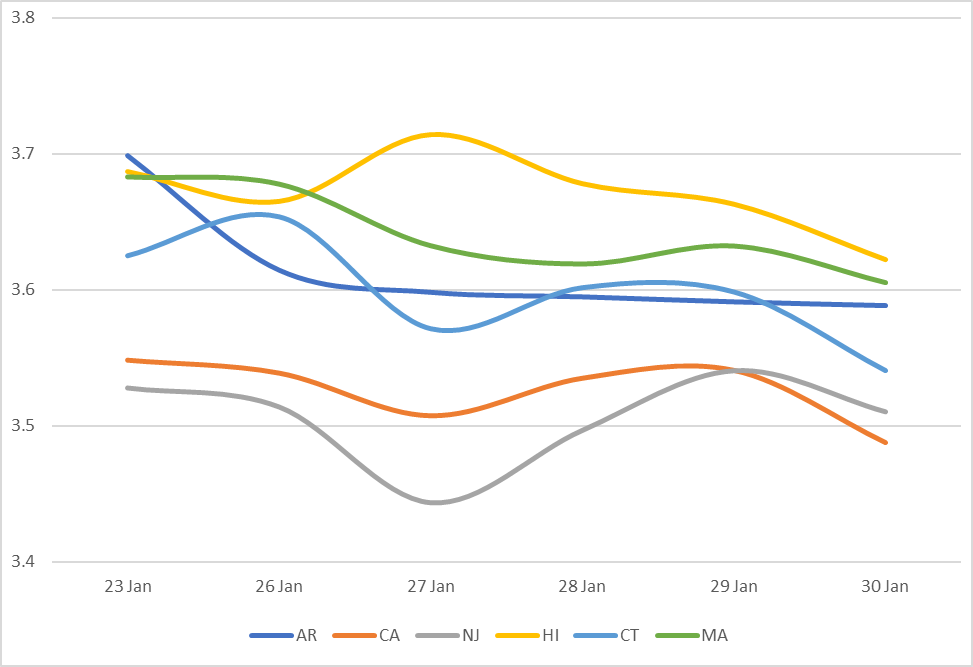
10 Year Yield by State – Rev Only
Displays the average Muni 10 year yield by state between 1/23/26-1/30/26 (Revenue Bonds only). Results are based on 6 select states, however, we offer data across all 50 states and U.S. territories
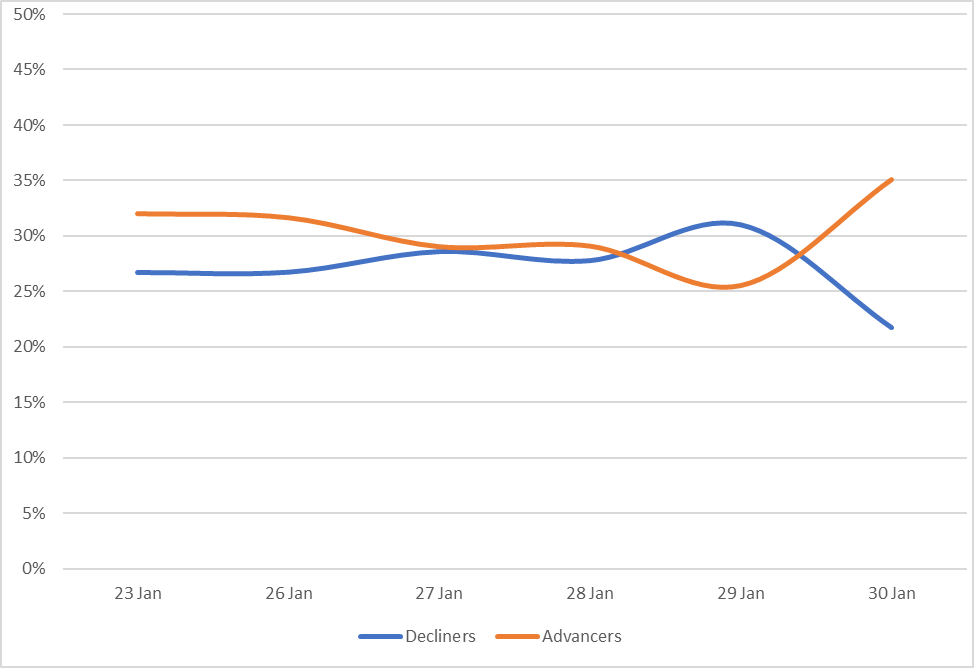
Sentiment
Reveals the percent of Muni bonds increasing in price (advancers) vs. decreasing in price (decliners) between 1/23/26-1/30/26
Top Quote Volume Movers: This Week vs Last Week
Exhibits the Munis with the largest increase in quote volume for the week ending 1/23/26 vs. the week ending 1/30/26
| Rank | Tranche | Coupon | Maturity | Prior Week | This Week | Increase | % Increase |
| 1 | WASHINGTON ST-R-2026A | 5.000% | 07/01/38 | 20 | 116 | 96 | 480% |
| 2 | OK WTR RESOURCES BRD | 5.250% | 04/01/55 | 58 | 150 | 92 | 159% |
| 3 | NEW YORK CITY -C | 4.000% | 08/01/37 | 42 | 115 | 73 | 174% |
| 4 | CALIFORNIA | 3.000% | 10/01/49 | 22 | 93 | 71 | 323% |
| 5 | MET TRANS AUTH NY DED | 4.000% | 11/15/43 | 10 | 79 | 69 | 690% |
| 6 | LANCASTER ISD-B-REF | 5.000% | 02/15/32 | 1 | 69 | 68 | 6800% |
| 7 | SALT RIVER-A-REF | 5.000% | 01/01/43 | 39 | 106 | 67 | 172% |
| 8 | NY TRANSITIONAL FIN-B | 5.000% | 05/01/45 | 103 | 169 | 66 | 64% |
| 9 | LAS VEGAS NV NEW CONV | 3.000% | 07/01/38 | 10 | 74 | 64 | 640% |
| 10 | BLACK BELT ENERGY GAS | 5.000% | 12/01/35 | 163 | 227 | 64 | 39% |
Most Quoted Munis
Ranks the Munis that were quoted by the highest number of dealers between 1/23/26-1/30/26
| Rank | Tranche | Coupon | Maturity | Dealers |
| 1 | TX WTR DEV BRD | 4.750% | 10/15/55 | 63 |
| 2 | NY TRANSITIONAL FIN-B | 5.000% | 05/01/51 | 57 |
| 3 | NY TRANSITIONAL FIN-B | 5.250% | 05/01/48 | 56 |
| 4 | PROSPER ISD-REF | 5.250% | 02/15/55 | 54 |
| 5 | SAN DIEGO UNIF SD-C-3 | 5.000% | 07/01/50 | 51 |
| 6 | NEW YORK-D | 5.250% | 10/01/51 | 50 |
| 7 | BLACK BELT ENERGY GAS | 5.000% | 12/01/35 | 48 |
| 8 | MIAMI-DADE CO-A | 5.000% | 10/01/55 | 48 |
| 9 | KY PUB ENERGY AUTH-C | 5.000% | 05/01/36 | 47 |
| 10 | OHIO ST UNIV-A-REF | 5.000% | 06/01/35 | 47 |
Related Resources
About SOLVE
SOLVE is the leading market data platform provider for fixed-income securities, trusted by sophisticated buy-side and sell-side firms worldwide. Founded in 2011, SOLVE leverages its AI-driven technology and deep industry expertise to offer unparalleled transparency into markets, reduce risk, and save hundreds of hours across front-office workflows. With the largest real-time datasets for Securitized Products, Municipal Bonds, Corporate Bonds, Syndicated Bank Loans, Convertible Bonds, CDS, and Private Credit, SOLVE empowers clients to transform the way they bring new securities to market, trade on secondary markets, and value highly illiquid securities. Headquartered in Connecticut, with offices across the globe, SOLVE is the definitive source for market pricing in fixed-income markets.
