Syndicated Bank Loan Market Summary – Week Ending 1/9/26
Our newsletter presents key trends derived from observable Syndicated Bank Loan pricing data over a weekly period.
New Issues
Loans issued during the week ending 1/9/26
| Issuer | Amount (MM) | Loan Type | Maturity | Rate |
| CyrusOne | 4000 | Delayed-draw Term Loan | 3/25/2027 | – |
| Coreweave Compute Acquisition Co. IV LLC | 3679 | Delayed-draw Term Loan | 5/16/2029 | S+350 |
| Asia Cube Global Communications LTD | 3168 | Term Loan | 10/17/2031 | HIBOR+210 |
| Al Rajhi Banking and Investment Corp. | 2255 | Term Loan | 6/18/2030 | – |
| Zegona Finance LLC | 1665 | Term Loan | 7/1/2029 | E+225 |
| Upstream Rehabilitation | 906 | Term Loan | 11/20/2029 | S+425 |
Forward Calendar
Forward calendar during the week ending 1/9/26
| Issuer | Banks | Expected Issue Date |
| Gibraltar Industries Inc | BofA, WFC | Q1 2026 |
Largest Loans
Highlights the weekly price movements and quote depth for the 20 largest bank loans between 1/2/26-1/9/26
| Rank | Size (MM) | Name | Change | PRC | PRC-1W | Dealers |
| 1 | 6272 | UKG INC (USD) TL S+250 2/9/2031 | 0.00% | 99.87 | 100.0704881 | 19 |
| 2 | 6145.2 | MAGNOLIA (USD) TL L+375 2/1/2028 | 0.00% | 93.16 | 92.73516528 | 13 |
| 3 | 5621 | SOLAREDGE TECHS INC (USD) TL B S+250 7/31/2031 | 0.00% | 100.39 | 100.4128498 | 13 |
| 4 | 5500 | DAYFORCE INC (USD) TL B S+300 10/7/2032 | 0.00% | 99.48 | 99.67122957 | 20 |
| 5 | 5080 | ALLIED UNIVERSAL HOLDCO LLC (USD) TL B S+325 8/5/2032 | 0.00% | 100.55 | 100.4664817 | 18 |
| 6 | 4741 | INTERNET BRANDS (USD) TL B3 S+425 4/20/2028 | -0.04% | 89.24 | 92.75131349 | 14 |
| 7 | 4664.41 | PROOFPOINT (USD) TL B S+300 8/31/2028 | 0.00% | 100.53 | 100.4278099 | 15 |
| 8 | 4510.57 | RADIATE HOLDCO LLC (USD) 1ST OUT TL S+500 9/25/2029 | 0.07% | 81.96 | 76.33834283 | 10 |
| 9 | 4300 | MASMOVIL IBERCOM SA (EUR) TL B E+275 3/20/2031 | 0.00% | 100.25 | 100.1013069 | 14 |
| 10 | 4230 | TK ELEVATOR (US) NEWCO INC TL B | 0.00% | 100.71 | 100.625 | 16 |
| 11 | 4204 | JANE STREET (USD) TL B S+200 12/10/2031 | 0.00% | 99.84 | 99.49122388 | 16 |
| 12 | 4084 | INSPIRE BRANDS (USD) TL S+250 12/15/2030 | 0.00% | 100.37 | 100.25 | 15 |
| 13 | 4073.83 | MEDLINE BORROWER LP (USD) TL B S+200 10/23/2028 | 0.00% | 100.38 | 100.25 | 11 |
| 14 | 4001 | CITADEL (USD) TL B S+200 10/28/2031 | 0.00% | 100.63 | 100.5388765 | 15 |
| 15 | 3935 | SS&C TECHS INC (USD) TL B8 S+200 5/2/2031 | 0.00% | 100.64 | 100.5633747 | 13 |
| 16 | 3914 | BROADSTREET PARTNERS INC (USD) TL B S+275 6/16/2031 | 0.00% | 100.38 | 100.2914211 | 16 |
| 17 | 3830.35 | ALLIANT HLDGS INTERMEDIATE LLC (USD) TL B S+250 9/19/2031 | 0.00% | 100.36 | 100.2388426 | 18 |
| 18 | 3736.25 | UFC (USD) TL B5 S+200 11/21/2031 | 0.00% | 100.61 | 100.4596306 | 15 |
| 19 | 3640 | TRANSDIGM INC (USD) TL J S+250 2/12/2031 | 0.00% | 100.38 | 100.3170843 | 15 |
| 20 | 3600 | GLOBAL MEDICAL RESPONSE INC (USD) TL S+350 9/10/2032 | 0.00% | 100.69 | 100.2283768 | 14 |
| Average | 4504.1305 | 0.00284083% | 98.52067028 | 84.53411758 | 15 |
Top 10 Performers
Showcases the top 10 loan performers based on the largest bid price increases between 1/2/26-1/9/26
| Rank | Name | Change | PRC | PRC-1W | Dealers |
| 1 | MAGENTA BUYER LLC (USD) 3RD OUT TL S+625 7/27/2028 | ▲ 16.93% | 24.60 | 21.04 | 9 |
| 2 | STEINHOFF EUROPE (AT) AG (EUR) PIK 2L TL B2 E+1075 12/31/2021 | ▲ 11.32% | 33.90 | 30.45 | 8 |
| 3 | BRIGHTSPEED (USD) TL B S+500 10/30/2029 | ▲ 10.15% | 70.86 | 64.33 | 8 |
| 4 | CSC SERVICEWORKS INC (USD) TL L+400 3/4/2028 | ▲ 8.07% | 83.12 | 76.92 | 13 |
| 5 | RADIATE HOLDCO LLC (USD) 1ST OUT TL S+500 9/25/2029 | ▲ 7.36% | 81.96 | 76.34 | 10 |
| 6 | VET INTERMEDIATE (USD) TL B S+500 9/19/2029 | ▲ 5.61% | 94.47 | 89.45 | 10 |
| 7 | OSCAR ACQUISITIONCO LLC (USD) TL B S+425 4/29/2029 | ▲ 4.12% | 74.07 | 71.14 | 14 |
| 8 | CLUB CAR (USD) TL L+400 6/1/2028 | ▲ 3.18% | 93.69 | 90.80 | 8 |
| 9 | TECTUM HOLDINGS INC (USD) TL B S+500 1/31/2028 | ▲ 2.91% | 79.15 | 76.92 | 16 |
| 10 | AVATAR PURCHASER (USD) TL B S+300 8/28/2030 | ▲ 2.81% | 91.70 | 89.19 | 8 |
Bottom 10 Performers
Showcases the bottom 10 loan performers based on the largest bid price decreases between 1/2/26-1/9/26
| Rank | Name | Change | PRC | PRC-1W | Dealers |
| 1 | VIBRANTZ TECHS INC (USD) TL S+425 4/21/2029 | ▼ 11.29% | 48.54 | 54.72 | 13 |
| 2 | ENTERTAINMENT PARTNERS (USD) TL B L+350 11/6/2028 | ▼ 6.20% | 67.05 | 71.48 | 5 |
| 3 | INEOS STYROLUTION GROUP GMBH (USD) TL B S+425 3/9/2029 | ▼ 5.86% | 66.60 | 70.75 | 7 |
| 4 | NAPA MANAGEMENT SERVICES (USD) TL B L+525 2/23/2029 | ▼ 5.18% | 64.77 | 68.31 | 10 |
| 5 | INTERNET BRANDS (USD) TL B4 S+425 12/11/2031 | ▼ 4.82% | 81.35 | 85.47 | 12 |
| 6 | TRICORBRAUN (USD) TL B S+325 3/6/2031 | ▼ 3.23% | 93.44 | 96.56 | 17 |
| 7 | KINDERCARE LEARNING CENTER TL B | ▼ 2.43% | 94.69 | 97.05 | 10 |
| 8 | KNOWLTON DEVELOPMENT (USD) TL B S+350 8/15/2028 | ▼ 2.07% | 96.44 | 98.48 | 6 |
| 9 | CRASH CHAMPIONS LLC (USD) TL B S+475 2/6/2029 | ▼ 1.30% | 93.11 | 94.33 | 15 |
| 10 | BELLIS ACQUISITION CO PLC (EUR) TL B E+425 5/2/2031 | ▼ 1.26% | 88.97 | 90.11 | 17 |
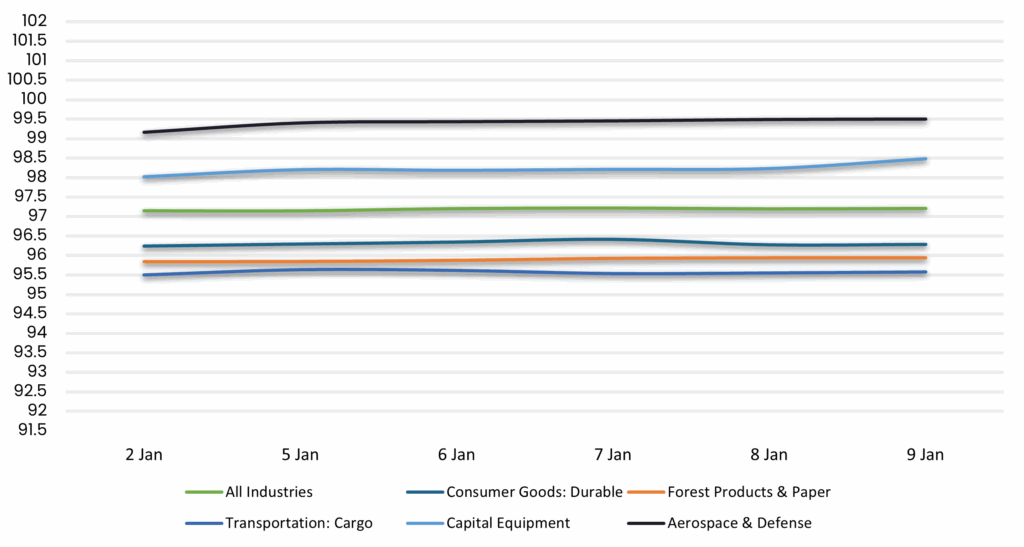
Avg Bid Price by Sector
Displays the average loan bid price by sector between 1/2/26-1/9/26. Results are based on select industry sectors, however, we offer data across 36 sectors
Sentiment
Reveals the percent of loans increasing in price (advancers) vs. loans decreasing in price (decliners) between 1/2/26-1/9/26

Top Quote Volume Movers: This Week vs Last Week
Exhibits the loans with the largest increase in quote volume for the week ending 1/2/26 vs. the week ending 1/9/26
| Rank | Tranche | Prior Week | This Week | Increase | % Increase |
| 1 | FERTITTA ENTERTAINMENT LLC (USD) TL B S+325 1/27/2029 | 56 | 130 | 74 | ▲ 132% |
| 2 | UKG INC (USD) TL S+250 2/9/2031 | 60 | 130 | 70 | ▲ 117% |
| 3 | BMC SOFTWARE (USD) TL B S+325 7/30/2031 | 59 | 128 | 69 | ▲ 117% |
| 4 | FIESTA PURCHASER INC (USD) TL B S+275 2/12/2031 | 32 | 98 | 66 | ▲ 206% |
| 5 | UFC (USD) TL B5 S+200 11/21/2031 | 48 | 112 | 64 | ▲ 133% |
| 6 | HARBOR FREIGHT (USD) TL B S+250 6/5/2031 | 52 | 114 | 62 | ▲ 119% |
| 7 | WHITE CAP BUYER LLC (USD) TL B S+325 10/19/2029 | 62 | 123 | 61 | ▲ 98% |
| 8 | FRONERI (USD) TL B4 S+200 9/16/2031 | 40 | 100 | 60 | ▲ 150% |
| 9 | TELENET FIN (LUX) NOTES SARL (USD) TL L+200 4/30/2028 | 32 | 92 | 60 | ▲ 188% |
| 10 | INTL GAME TECH PLC (USD) TL B S+475 7/1/2032 | 18 | 77 | 59 | ▲ 328% |
Most Quoted Loans
Ranks the loans that were quoted by the highest number of dealers between 1/2/26-1/9/26
| Rank | Tranche | Dealers |
| 1 | WHITE CAP BUYER LLC (USD) TL B S+325 10/19/2029 | 20 |
| 2 | HUB INTL LTD (USD) TL B S+250 6/20/2030 | 20 |
| 3 | DAYFORCE INC (USD) TL B S+300 10/7/2032 | 20 |
| 4 | WHATABURGER (USD) TL B S+250 8/3/2028 | 19 |
| 5 | UKG INC (USD) TL S+250 2/9/2031 | 19 |
| 6 | EMRLD BORROWER LP (USD) TL B S+225 5/31/2030 | 19 |
| 7 | TENNECO INC (USD) TL B S+500 11/6/2028 | 18 |
| 8 | CULLIGAN (USD) TL B S+325 7/30/2028 | 18 |
| 9 | BMC SOFTWARE (USD) TL B S+325 7/30/2031 | 18 |
| 10 | FERTITTA ENTERTAINMENT LLC (USD) TL B S+325 1/27/2029 | 18 |
Bid and Offer Volume
Reveals the total number of quotes by bid and offer between 1/2/26-1/9/26

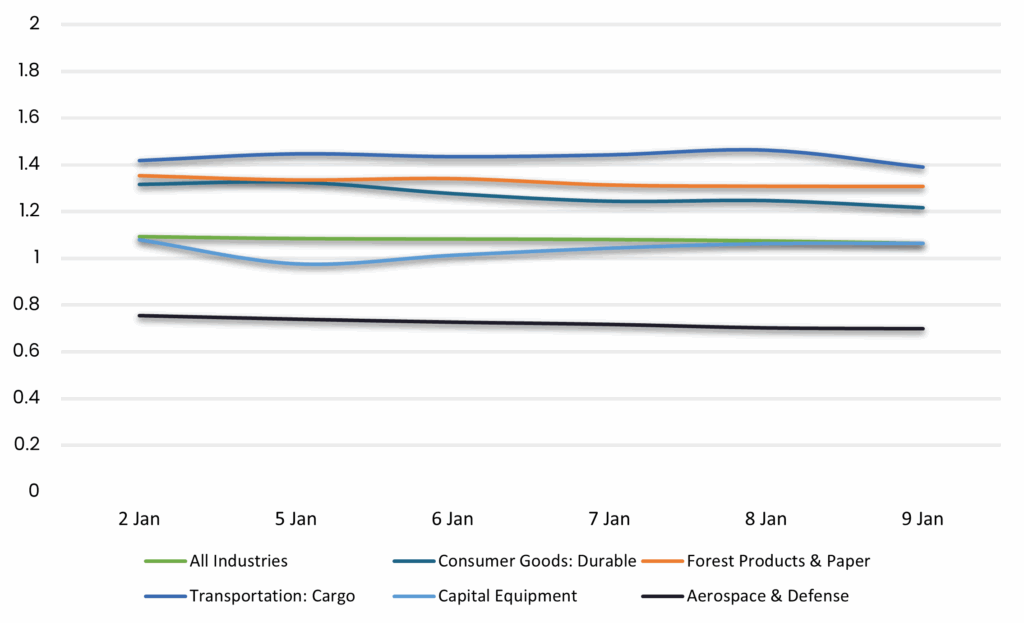
Sector Bid-Offer Spread
Results are based on select industry sectors, however, we offer data across 36 sectors
Related Resources
About SOLVE
SOLVE is the leading market data platform provider for fixed-income securities, trusted by sophisticated buy-side and sell-side firms worldwide. Founded in 2011, SOLVE leverages its AI-driven technology and deep industry expertise to offer unparalleled transparency into markets, reduce risk, and save hundreds of hours across front-office workflows. With the largest real-time datasets for Securitized Products, Municipal Bonds, Corporate Bonds, Syndicated Bank Loans, Convertible Bonds, CDS, and Private Credit, SOLVE empowers clients to transform the way they bring new securities to market, trade on secondary markets, and value highly illiquid securities. Headquartered in Connecticut, with offices across the globe, SOLVE is the definitive source for market pricing in fixed-income markets.
