Municipal Bond Market Summary – Week Ending 11/14/25
Our newsletter presents key trends derived from observable Municipal Bond pricing data over a weekly period.
Top 10 Performers
Showcases the top 10 Muni Bond performers based on price movements between 11/7/25-11/14/25
| Rank | Bond Name | Coupon | Maturity | Change | PRC | PRC-1W | Dealers |
| 1 | PUB FIN AUTH-A-1 | 5.625% | 07/01/55 | ▲ 3.17% | 105.39 | 102.15 | 3 |
| 2 | TRIBOROUGH BRIDGE-A | 5.250% | 05/15/57 | ▲ 3.10% | 105.87 | 102.69 | 7 |
| 3 | MINNESOTA ST-COPS-REV | 5.000% | 11/01/39 | ▲ 2.23% | 115.10 | 112.59 | 2 |
| 4 | PA HIGHER EDUCTNL FAC | 2.125% | 06/15/41 | ▲ 2.21% | 72.21 | 70.65 | 2 |
| 5 | MIAMI-DADE CO-BAM | 4.000% | 10/01/49 | ▲ 1.86% | 92.42 | 90.74 | 7 |
| 6 | JEFFERSON ESD-B | 2.125% | 09/01/41 | ▲ 1.85% | 75.99 | 74.61 | 3 |
| 7 | JONESBOR CITY WTR | 4.250% | 06/01/45 | ▲ 1.84% | 100.38 | 98.57 | 2 |
| 8 | CLOVERDALE UNIF SD-B | 4.000% | 08/01/49 | ▲ 1.84% | 97.85 | 96.08 | 2 |
| 9 | CO HLTH FACS AUTH | 4.000% | 01/15/45 | ▲ 1.82% | 95.17 | 93.47 | 2 |
| 10 | CHICAGO BRD OF EDU-A | 4.000% | 12/01/47 | ▲ 1.66% | 79.28 | 77.98 | 9 |
Bottom 10 Performers
Showcases the bottom 10 Muni Bond performers based on price movements between 11/7/25-11/14/25
| Rank | Bond Name | Coupon | Maturity | Change | PRC | PRC-1W | Dealers |
| 1 | CA GILSCD 3.36 08/01/2047 | 3.364% | 08/01/47 | ▼ -2.79% | 75.52 | 77.69 | 5 |
| 2 | AZ PHODEV 4.00 12/01/2051 | 4.000% | 12/01/51 | ▼ -2.71% | 67.88 | 69.76 | 2 |
| 3 | IN WESEDU 5.00 07/15/2038 | 5.000% | 07/15/38 | ▼ -2.63% | 112.20 | 115.23 | 11 |
| 4 | MD MDSMED 4.00 01/01/2051 | 4.000% | 01/01/51 | ▼ -2.52% | 84.24 | 86.42 | 2 |
| 5 | OH WADSCD 3.00 12/01/2045 | 3.000% | 12/01/45 | ▼ -2.52% | 77.63 | 79.64 | 2 |
| 6 | NY NYSHSG 3.65 11/01/2047 | 3.650% | 11/01/47 | ▼ -2.23% | 86.00 | 87.96 | 2 |
| 7 | CO DENGEN 4.00 08/01/2051 | 4.000% | 08/01/51 | ▼ -2.20% | 94.65 | 96.77 | 11 |
| 8 | IN INSFIN 4.00 11/01/2043 | 4.000% | 11/01/43 | ▼ -2.18% | 86.64 | 88.57 | 5 |
| 9 | FL PASUTL 4.00 10/01/2044 | 4.000% | 10/01/44 | ▼ -2.02% | 96.06 | 98.04 | 3 |
| 10 | MI MRTSCD 3.20 05/01/2046 | 3.200% | 05/01/46 | ▼ -2.01% | 80.82 | 82.48 | 2 |
Top 10 State Performers
Showcases the top 10 Muni State performers based on yield movements between 11/7/25-11/14/25
| Rank | State | Change | YLD | YLD-1W |
| 1 | VT | -13 bps | 3.10% | 3.23% |
| 2 | AZ | -12 bps | 3.42% | 3.54% |
| 3 | NJ | -11 bps | 3.43% | 3.54% |
| 4 | AK | -9 bps | 2.97% | 3.06% |
| 5 | MO | -8 bps | 3.48% | 3.56% |
| 6 | IN | -5 bps | 3.40% | 3.46% |
| 7 | SC | -5 bps | 3.24% | 3.29% |
| 8 | VA | -4 bps | 3.45% | 3.49% |
| 9 | KY | -3 bps | 3.41% | 3.44% |
| 10 | NY | -2 bps | 3.76% | 3.78% |
Bottom 10 State Performers
Showcases the bottom 10 Muni State performers based on yield movements between 11/7/25-11/14/25
| Rank | State | Change | YLD | YLD-1W |
| 1 | RI | 17 bps | 3.35% | 3.18% |
| 2 | CT | 15 bps | 3.44% | 3.30% |
| 3 | AR | 14 bps | 3.78% | 3.64% |
| 4 | NV | 11 bps | 3.41% | 3.30% |
| 5 | UT | 11 bps | 3.35% | 3.24% |
| 6 | MT | 11 bps | 3.34% | 3.24% |
| 7 | NC | 11 bps | 3.23% | 3.12% |
| 8 | DC | 8 bps | 3.38% | 3.30% |
| 9 | ND | 8 bps | 3.40% | 3.32% |
| 10 | GA | 7 bps | 3.38% | 3.31% |
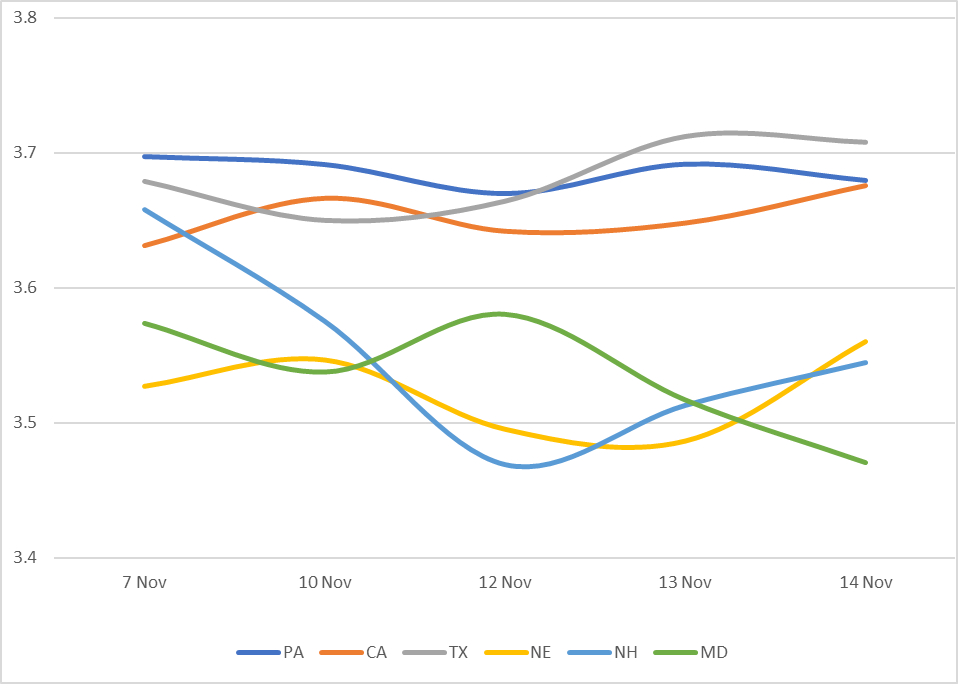
10 Year Yield by State – All
Displays the average Muni 10 year yield by state between 11/7/25-11/14/25 (General Obligation and Revenue Bonds) Results are based on 5 select states, however, we offer data across all 50 states and U.S. territories
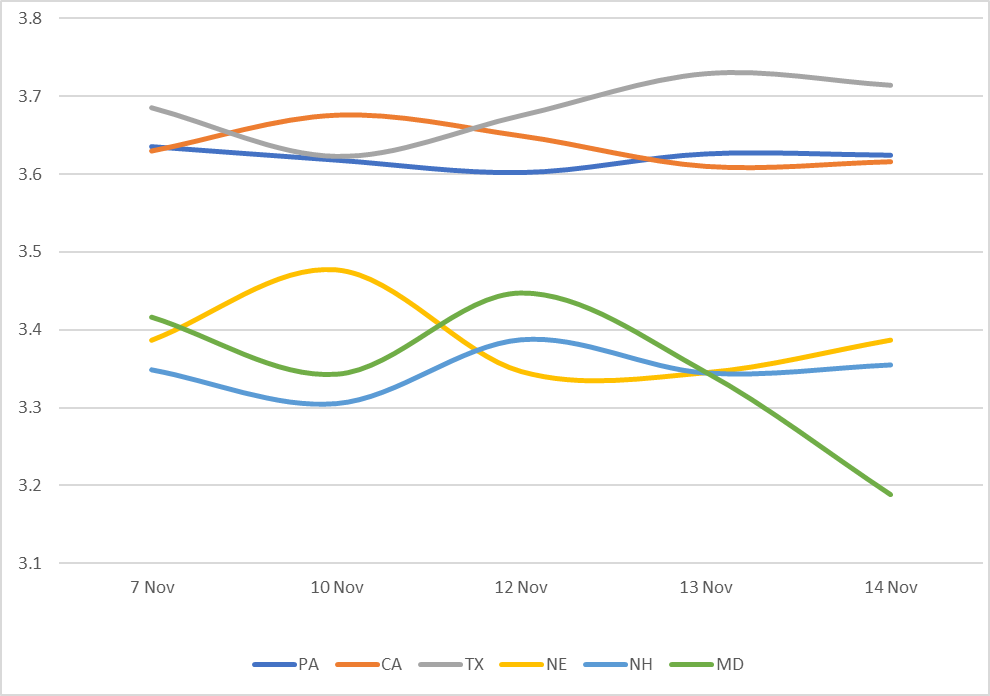
10 Year Yield by State – GO Only
Displays the average Muni 10 year yield by state between 11/7/25-11/14/25 (General Obligation Bonds only) Results are based on 5 select states, however, we offer data across all 50 states and U.S. territories
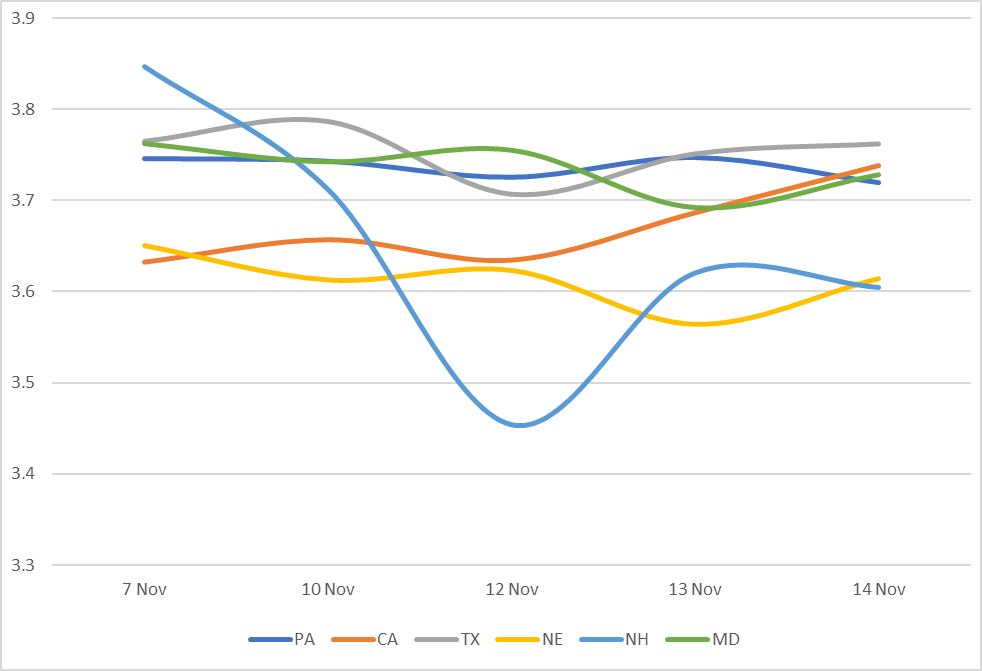
10 Year Yield by State – Rev Only
Displays the average Muni 10 year yield by state between 11/7/25-11/14/25 (Revenue Bonds only) Results are based on 5 select states, however, we offer data across all 50 states and U.S. territories
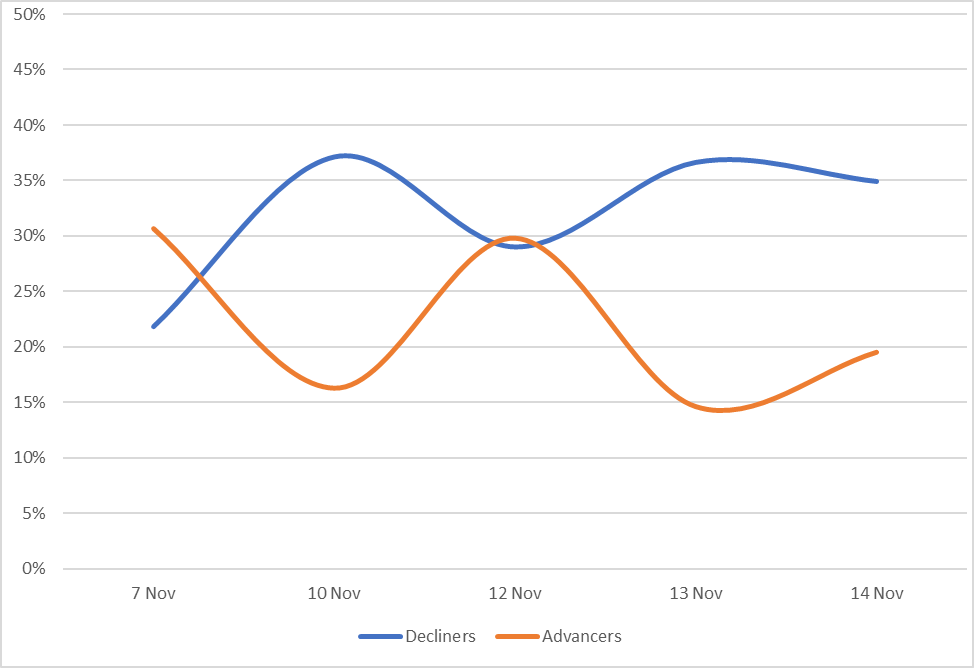
Sentiment
Reveals the percent of Muni bonds increasing in price (advancers) vs. decreasing in price (decliners) between 11/7/25-11/14/25
Top Quote Volume Movers: This Week vs Last Week
Exhibits the Munis with the largest increase in quote volume for the week ending 11/7/25 vs. the week ending 11/14/25
| Rank | Tranche | Coupon | Maturity | Prior Week | This Week | Increase | % Increase |
| 1 | NEW YORK B-1-REF | 5.000% | 08/01/29 | 28 | 106 | 78 | 279% |
| 2 | CALIFORNIA ST-REF | 5.000% | 03/01/30 | 34 | 105 | 71 | 209% |
| 3 | ANAHEIM HSG -A | 5.000% | 10/01/32 | 31 | 100 | 69 | 223% |
| 4 | POWAY UNIF SCH DIST-B | 5.000% | 09/01/32 | 31 | 100 | 69 | 223% |
| 5 | POWAY UNIF SCH DIST-B | 5.000% | 09/01/33 | 31 | 100 | 69 | 223% |
| 6 | UKIAH CA USD CAP APP | 0.000% | 08/01/32 | 13 | 79 | 66 | 508% |
| 7 | POWAY USD-CABS-IMPT | 0.000% | 08/01/33 | 18 | 79 | 61 | 339% |
| 8 | NEWPORT MESA CALIF UNI SCH | 0.000% | 08/01/37 | 22 | 81 | 59 | 268% |
| 9 | SANTA ANA USD-B | 0.000% | 08/01/32 | 12 | 71 | 59 | 492% |
| 10 | WEST CONTRA COSTA CALIF UNI | 0.000% | 08/01/32 | 12 | 71 | 59 | 492% |
Most Quoted Munis
Ranks the Munis that were quoted by the highest number of dealers between 11/7/25-11/14/25
| Rank | Tranche | Coupon | Maturity | Dealers |
| 1 | NEW YORK-D | 5.250% | 10/01/51 | 66 |
| 2 | TX WTR DEV BRD | 4.750% | 10/15/55 | 61 |
| 3 | NY TRANSITIONAL FIN-B | 5.000% | 05/01/51 | 60 |
| 4 | SEQUOIA UNION HIGH SD | 5.000% | 07/01/54 | 50 |
| 5 | NY TRANSITIONAL FIN-B | 5.250% | 05/01/55 | 49 |
| 6 | CLARK CO SCH DT-B-REF | 5.000% | 06/15/43 | 48 |
| 7 | SALT RIVER PROJ-C | 5.250% | 01/01/55 | 48 |
| 8 | CA HLTH FACS-A2-BAM | 4.000% | 11/01/44 | 46 |
| 9 | COLUMBUS-A | 5.000% | 10/01/39 | 46 |
| 10 | MD HLTH HGR EDL-C-REF | 5.250% | 07/01/50 | 46 |
Related Resources
About SOLVE
SOLVE is the leading market data platform provider for fixed-income securities, trusted by sophisticated buy-side and sell-side firms worldwide. Founded in 2011, SOLVE leverages its AI-driven technology and deep industry expertise to offer unparalleled transparency into markets, reduce risk, and save hundreds of hours across front-office workflows. With the largest real-time datasets for Securitized Products, Municipal Bonds, Corporate Bonds, Syndicated Bank Loans, Convertible Bonds, CDS, and Private Credit, SOLVE empowers clients to transform the way they bring new securities to market, trade on secondary markets, and value highly illiquid securities. Headquartered in Connecticut, with offices across the globe, SOLVE is the definitive source for market pricing in fixed-income markets.
