Syndicated Bank Loan Market Summary – Week Ending 11/14/25
Our newsletter presents key trends derived from observable Syndicated Bank Loan pricing data over a weekly period.
New Issues
Loans issued during the week ending 11/14/25
| Issuer | Amount (MM) | Loan Type | Maturity | Rate |
| Homeservices of America | 200 | Delayed-draw Term Loan | 1/14/2024 | S+50 |
| Best Food Of Nature Holdco III | 405 | Term Loan | 9/5/2029 | S+400 |
| BWX Technologies Inc. | 250 | Term Loan | 10/12/2027 | S+150 |
Forward Calendar
Forward calendar during the week ending 11/14/25
| Issuer | Deal Information | Banks | Expected Issue Date |
| Blackstone Mortgage Trust | $500MM TLB | MS | Q4 2025 |
| Insignia Financial Group | $671.5MM TLB | UBS, STD, DB, NTXS | Q4 2025 |
| Simply Good Foods USA | $400MM TLB | BCLY | Q4 2025 |
Largest Loans
Highlights the weekly price movements and quote depth for the 20 largest bank loans between 11/7/25-11/14/25
| Rank | Size (MM) | Name | Change | PRC | PRC-1W | Dealers |
| 1 | 6272 | UKG INC (USD) TL S+250 2/9/2031 | 0.00% | 99.93 | 99.84768917 | 14 |
| 2 | 6145.2 | MAGNOLIA (USD) TL L+375 2/1/2028 | 0.00% | 85.34 | 85.59403468 | 15 |
| 3 | 5621 | SOLAREDGE TECHS INC (USD) TL B S+250 7/31/2031 | 0.00% | 100.16 | 100.2034812 | 11 |
| 4 | 5080 | ALLIED UNIVERSAL HOLDCO LLC (USD) TL B S+325 8/5/2032 | 0.00% | 100.43 | 100.404356 | 16 |
| 5 | 4741 | INTERNET BRANDS (USD) TL B S+425 4/20/2028 | 0.00% | 89.56 | 89.62765531 | 12 |
| 6 | 4664.41 | PROOFPOINT (USD) TL B S+300 8/31/2028 | 0.00% | 100.45 | 100.4566787 | 15 |
| 7 | 4300 | MASMOVIL IBERCOM SA (EUR) TL B E+275 3/20/2031 | 0.00% | 100.08 | 99.93355294 | 14 |
| 8 | 4230 | TK ELEVATOR (US) NEWCO INC TL B | 0.00% | 100.59 | 100.6351422 | 14 |
| 9 | 4226 | INSPIRE BRANDS (USD) TL B S+250 12/15/2027 | 0.00% | 100.00 | 100 | 12 |
| 10 | 4204 | JANE STREET (USD) TL B S+200 12/10/2031 | 0.00% | 98.95 | 98.86926835 | 16 |
| 11 | 4073.83 | MEDLINE BORROWER LP (USD) TL B S+200 10/23/2028 | 0.00% | 100.07 | 100.0765959 | 11 |
| 12 | 4001 | CITADEL (USD) TL B S+200 10/28/2031 | 0.00% | 100.38 | 100.3785204 | 14 |
| 13 | 3935 | SS&C TECHS INC (USD) TL B8 S+200 5/2/2031 | 0.00% | 100.33 | 100.3085249 | 15 |
| 14 | 3914 | BROADSTREET PARTNERS INC (USD) TL B S+275 6/16/2031 | 0.00% | 100.29 | 100.3278272 | 17 |
| 15 | 3900 | DIRECTV FNCG LLC (USD) TL L+500 8/2/2027 | 0.00% | 100.00 | 100 | 11 |
| 16 | 3830.35 | ALLIANT HLDGS INTERMEDIATE LLC (USD) TL B S+250 9/19/2031 | 0.00% | 99.99 | 99.96716338 | 18 |
| 17 | 3640 | TRANSDIGM INC (USD) TL J S+250 2/12/2031 | 0.00% | 100.13 | 100.0985941 | 15 |
| 18 | 3600 | GLOBAL MEDICAL RESPONSE INC (USD) TL S+350 9/10/2032 | 0.00% | 100.50 | 100.5355889 | 11 |
| 19 | 3573 | CDK GLOBAL (USD) TL B S+325 7/6/2029 | 0.00% | 82.67 | 82.91356197 | 16 |
| 20 | 3500 | MEDLINE BORROWER LP (USD) TL B S+200 10/21/2030 | 0.00% | 100.07 | 100 | 11 |
| Average | 4372.5395 | 0.00% | 97.99480482 | 100.2351403 | 13.9 |
Top 10 Performers
Showcases the top 10 loan performers based on the largest bid price increases between 11/7/25-11/14/25
| Rank | Name | Change | PRC | PRC-1W | Dealers |
| 1 | INOVIE (EUR) TL B E+500 3/3/2028 | ▲ 5.20% | 92.68 | 88.10 | 14 |
| 2 | FONCIA GROUPE (EUR) TL B E+525 3/27/2028 | ▲ 4.93% | 90.31 | 86.06 | 14 |
| 3 | ATNAHS PHARMA UK LTD (EUR) TL B E+425 2/6/2030 | ▲ 4.60% | 50.87 | 48.63 | 13 |
| 4 | EPIQ SYSTEMS (USD) TL S+425 4/26/2029 | ▲ 4.27% | 90.58 | 86.86 | 10 |
| 5 | BABILOU (EUR) TL B E+400 11/21/2030 | ▲ 4.06% | 92.59 | 88.98 | 14 |
| 6 | ORBITER GROUP (EUR) TL B E+400 10/18/2028 | ▲ 3.53% | 92.12 | 88.99 | 16 |
| 7 | GI REVELATION (USD) TL B S+375 5/14/2028 | ▲ 2.99% | 88.20 | 85.64 | 12 |
| 8 | STARK GROUP (EUR) TL B E+500 5/4/2028 | ▲ 2.80% | 92.52 | 90.00 | 11 |
| 9 | HELP AT HOME (USD) TL S+500 9/17/2031 | ▲ 1.75% | 91.14 | 89.57 | 10 |
| 10 | PRE-PAID LEGAL SERVICES (USD) TL B S+325 12/15/2028 | ▲ 1.75% | 95.89 | 94.24 | 10 |
Bottom 10 Performers
Showcases the bottom 10 loan performers based on the largest bid price decreases between 11/7/25-11/14/25
| Rank | Name | Change | PRC | PRC-1W | Dealers |
| 1 | JELD-WEN (USD) TL B S+200 7/28/2028 | ▼ 9.12% | 81.61 | 89.80 | 11 |
| 2 | MULTI-COLOR (USD) TL B L+500 10/29/2028 | ▼ 7.25% | 68.13 | 73.45 | 16 |
| 3 | INEOS FIN PLC (EUR) TL B E+375 6/4/2031 | ▼ 6.03% | 84.16 | 89.57 | 11 |
| 4 | XAI CORP (USD) TL B S+725 6/2/2030 | ▼ 5.35% | 96.41 | 101.86 | 7 |
| 5 | PLY GEM (USD) TL B S+475 5/2/2031 | ▼ 4.48% | 78.36 | 82.03 | 9 |
| 6 | SKILLSOFT (USD) TL B S+525 7/16/2028 | ▼ 4.03% | 81.63 | 85.05 | 9 |
| 7 | TECTUM HOLDINGS INC (USD) TL B S+500 1/31/2028 | ▼ 3.93% | 84.19 | 87.64 | 16 |
| 8 | CORNERSTONE BLDG BRANDS INC (USD) TL L+325 4/12/2028 | ▼ 3.25% | 83.75 | 86.57 | 14 |
| 9 | KINDERCARE LEARNING CENTER TL B | ▼ 2.32% | 97.30 | 99.62 | 8 |
| 10 | CLUB CAR (USD) TL L+400 6/1/2028 | ▼ 2.12% | 93.36 | 95.37 | 10 |
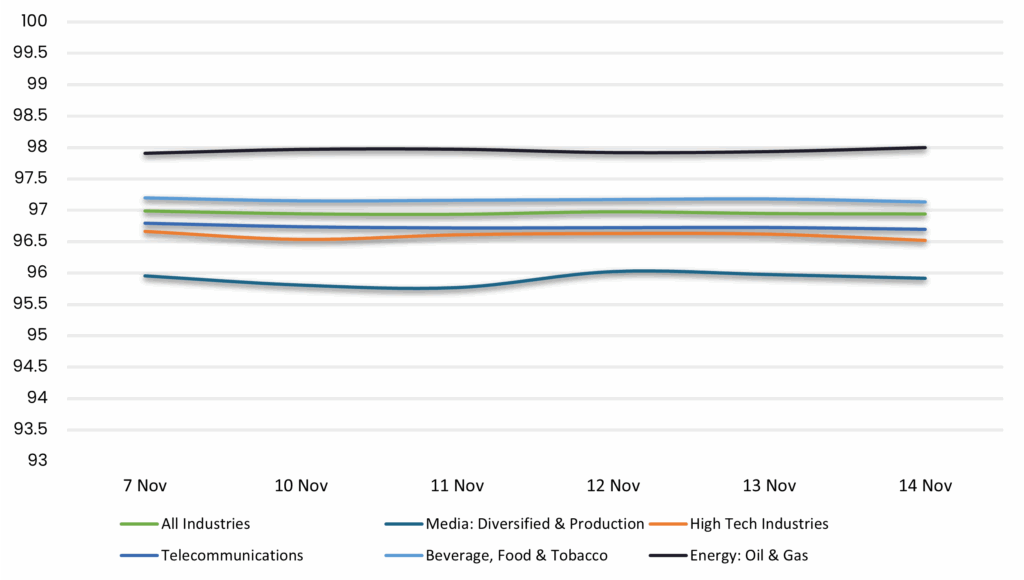
Avg Bid PX by Sector
Displays the average loan bid price by sector between 11/7/25-11/14/25 Results are based on 5 select industry sectors, however, we offer data across 36 sectors
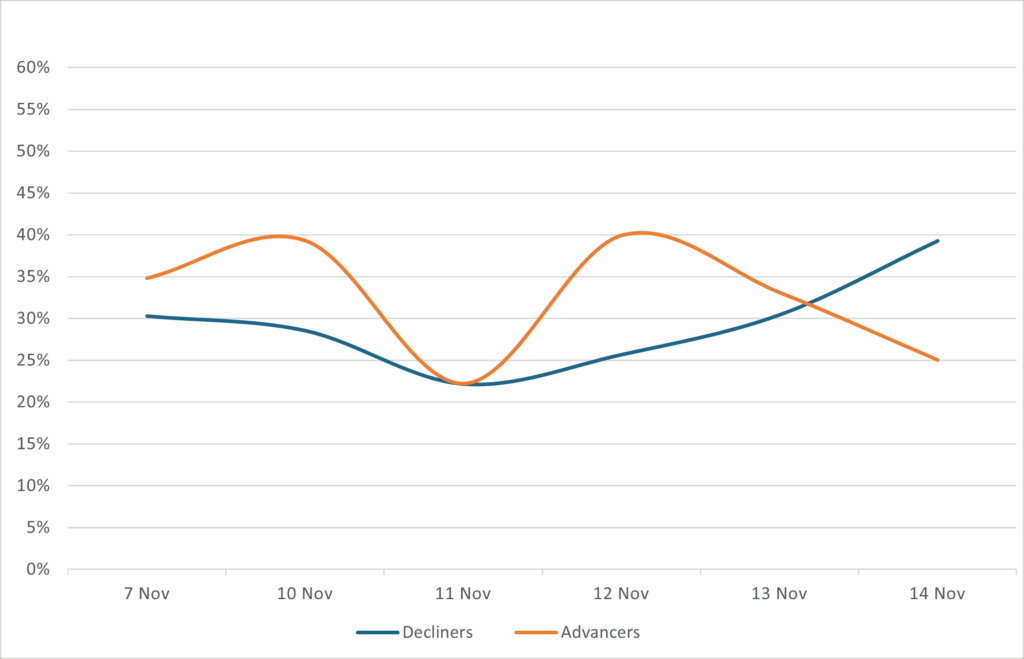
Sentiment
Reveals the percent of loans increasing in price (advancers) vs. loans decreasing in price (decliners) between 11/7/25-11/14/25
Top Quote Volume Movers: This Week vs Last Week
Exhibits the loans with the largest increase in quote volume for the week ending 11/7/25 vs. the week ending 11/14/25
| Rank | Tranche | Prior Week | This Week | Increase | % Increase |
| 1 | STYROLUTION (USD) TL B S+375 3/2/2030 | 6 | 23 | 17 | ▲ 283% |
| 2 | INCEPTION FINCO (USD) TL B S+375 4/18/2031 | 10 | 26 | 16 | ▲ 160% |
| 3 | CONTINENTAL WIND LLC (USD) TL S+200 12/14/2027 | 10 | 21 | 11 | ▲ 110% |
| 4 | ARCHROMA / SK SPICE (EUR) TL B E+550 6/10/2027 | 12 | 23 | 11 | ▲ 92% |
| 5 | INEOS FIN PLC (EUR) TL B E+375 6/4/2031 | 33 | 44 | 11 | ▲ 33% |
| 6 | STADA ARZNEIMITTEL (EUR) TL B E+350 2/21/2030 | 59 | 70 | 11 | ▲ 19% |
| 7 | NEXANS SA (EUR) TL B E+425 6/17/2032 | 0 | 10 | 10 | ▲ NA |
| 8 | VEONET (EUR) TL B E+475 4/8/2029 | 32 | 42 | 10 | ▲ 31% |
| 9 | CIRCET GROUPE (EUR) TL B E+375 7/8/2028 | 0 | 10 | 10 | ▲ NA |
| 10 | OUTFRONT MEDIA CAP LLC (USD) TL B S+200 9/16/2032 | 14 | 24 | 10 | ▲ 71% |
Most Quoted Loans
Ranks the loans that were quoted by the highest number of dealers between 11/7/25-11/14/25
| Rank | Tranche | Dealers |
| 1 | AMWINS GROUP INC (USD) TL B S+225 1/23/2032 | 19 |
| 2 | APRIL SA (EUR) TL B E+300 4/4/2031 | 19 |
| 3 | TRICORBRAUN (USD) TL B S+325 3/6/2031 | 18 |
| 4 | AVOLON HLDGS FNDG LTD (USD) TL B6 S+175 6/21/2030 | 18 |
| 5 | WHATABURGER (USD) TL B S+250 8/3/2028 | 18 |
| 6 | TRONOX INC (USD) TL B S+250 4/4/2029 | 18 |
| 7 | HUB INTL LTD (USD) TL B S+250 6/20/2030 | 18 |
| 8 | BMC SOFTWARE (USD) TL B S+325 7/30/2031 | 18 |
| 9 | INTL GAME TECH PLC (USD) TL B S+475 7/1/2032 | 18 |
| 10 | FERTITTA ENTERTAINMENT LLC (USD) TL B S+325 1/27/2029 | 18 |
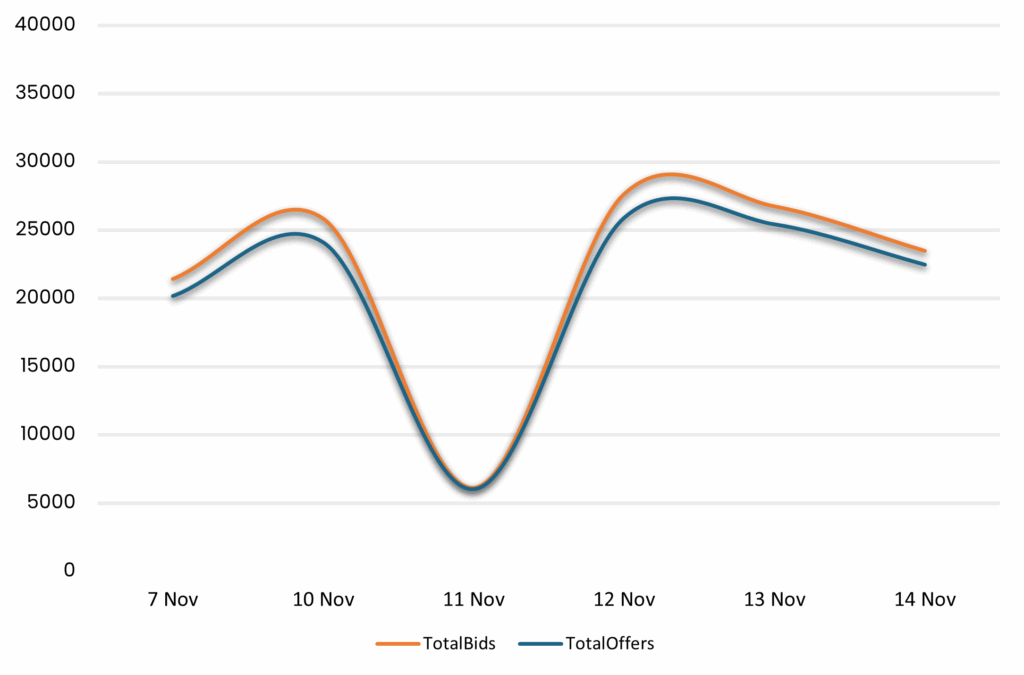
Bid and Offer Volume
Reveals the total number of quotes by bid and offer between 11/7/25-11/14/25
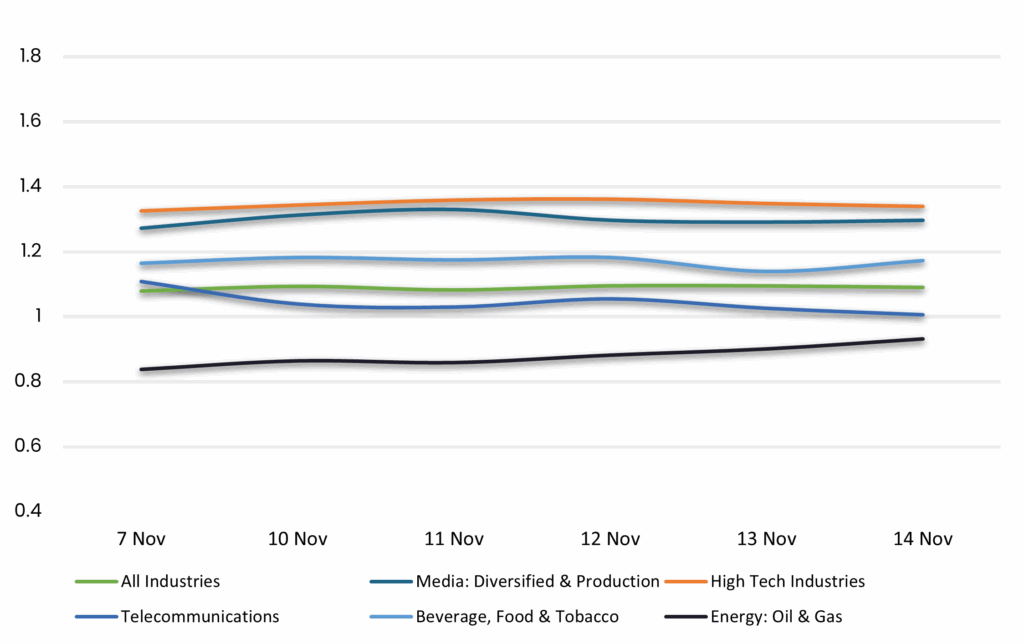
Sector Bid-Offer Spread
Results are based on 5 select industry sectors, however, we offer data across 36 sectors
Related Resources
About SOLVE
SOLVE is the leading market data platform provider for fixed-income securities, trusted by sophisticated buy-side and sell-side firms worldwide. Founded in 2011, SOLVE leverages its AI-driven technology and deep industry expertise to offer unparalleled transparency into markets, reduce risk, and save hundreds of hours across front-office workflows. With the largest real-time datasets for Securitized Products, Municipal Bonds, Corporate Bonds, Syndicated Bank Loans, Convertible Bonds, CDS, and Private Credit, SOLVE empowers clients to transform the way they bring new securities to market, trade on secondary markets, and value highly illiquid securities. Headquartered in Connecticut, with offices across the globe, SOLVE is the definitive source for market pricing in fixed-income markets.
