Syndicated Bank Loan Market Summary – Week Ending 6/13/25
GET OUR BANK LOAN MARKET SUMMARIES STRAIGHT TO YOUR INBOX. LEARN MORE
Syndicated Bank Loan Market Summary: Week Ending 6/13/25
Our newsletter presents key trends derived from observable Syndicated Bank Loan pricing data over a weekly period.
New Issues
Loans issued during the week ending 6/13/25
| ISSUER | AMOUNT (MM) | LOAN TYPE | MATURITY | RATE |
|---|---|---|---|---|
| TIC Bidco LTD | 30 | Delayed-draw Term Loan | 12/6/2031 | SN+500 |
| Occidental Petroleum Corp. | 2000 | Term Loan | 7/29/2025 | S+225 |
| Aspect Software Inc. | 39 | Term Loan | 5/5/2028 | S+700 |
| Trident AcquisitionCo LLC | 325 | Term Loan | 12/31/2031 | S+225 |
forward calendar
Forward calendar during the week ending 6/13/25
| Issuer | Deal Information | Banks | Expected Issue Date |
|---|---|---|---|
| Altera Corp. | $1.5B TL | BCLY,CITI,RBC,DB,KKR,BMO | Q2 2025 |
| Jostens Inc. | $447MM TL | BofA | Q2 2025 |
| Sazerac Co. Inc. | $1B TLB (Ba3/BB-) | WF | Q2 2025 |
Largest Loans
Highlights the weekly price movements and quote depth for the 20 largest bank loans between 6/6/25-6/13/25
| RANK | SIZE (MM) | NAME | CHANGE | PRC | PRC-1W | DEALERS |
|---|---|---|---|---|---|---|
| 1 | 7,631 | MEDLINE BORROWER LP (USD) TL S+225 10/21/2028 | 0.01% | 99.87 | 99.86 | 10 |
| 2 | 6,145 | MAGNOLIA (USD) TL L+375 2/1/2028 | -3.48% | 83.42 | 86.43 | 15 |
| 3 | 4,750 | ZAYO (USD) TL L+300 3/9/2027 | -0.35% | 94.82 | 95.16 | 15 |
| 4 | 4,741 | INTERNET BRANDS (USD) TL B S+425 4/20/2028 | -3.11% | 92.59 | 95.56 | 11 |
| 5 | 4,525 | TRANSDIGM INC (USD) TL I S+275 8/24/2028 | -0.07% | 100.18 | 100.25 | 15 |
| 6 | 4,479 | CLOUD SOFTWARE GROUP INC (USD) TL B S+350 3/30/2029 | -0.11% | 99.75 | 99.86 | 11 |
| 7 | 4,300 | MASMOVIL IBERCOM SA (EUR) TL B E+275 3/20/2031 | -0.07% | 99.69 | 99.76 | 13 |
| 8 | 4,230 | TK ELEVATOR (US) NEWCO INC TL B | -0.08% | 100.09 | 100.17 | 14 |
| 9 | 4,226 | INSPIRE BRANDS (USD) TL B S+250 12/15/2027 | -0.10% | 99.77 | 99.87 | 14 |
| 10 | 4,204 | JANE STREET (USD) TL B S+200 12/10/2031 | -0.08% | 99.69 | 99.77 | 15 |
| 11 | 4,001 | CITADEL (USD) TL B S+200 10/28/2031 | -0.24% | 100.10 | 100.34 | 12 |
| 12 | 3,935 | SS&C TECHS INC (USD) TL B8 S+200 5/2/2031 | -0.07% | 100.26 | 100.34 | 13 |
| 13 | 3,900 | DIRECTV FNCG LLC (USD) TL L+500 8/2/2027 | -0.05% | 100.14 | 100.19 | 11 |
| 14 | 3,859 | ALLIANT HLDGS I INC (USD) TL B S+325 9/12/2031 | -0.13% | 99.43 | 99.56 | 19 |
| 15 | 3,640 | TRANSDIGM INC (USD) TL J S+250 2/12/2031 | -0.09% | 99.89 | 99.97 | 15 |
| 16 | 3,573 | CDK GLOBAL (USD) TL B S+325 7/6/2029 | -5.27% | 83.92 | 88.59 | 16 |
| 17 | 3,491 | WESTINGHOUSE (USD) TL B S+250 1/5/2031 | 0.03% | 99.81 | 99.78 | 15 |
| 18 | 3,420 | RCN GRANDE (USD) TL L+325 9/25/2026 | -0.36% | 87.42 | 87.74 | 11 |
| 19 | 3,393 | GENESYS TELECOM (USD) TL B S+250 1/23/2032 | 0.06% | 99.72 | 99.66 | 10 |
| 20 | 3,380 | SOLERA (USD) TL B L+400 6/2/2028 | 0.13% | 96.83 | 96.71 | 15 |
| AVERAGE | 4,291 | -0.67% | 96.87 | 100.00 | 13.5 |
Top 10 Performers
Showcases the top 10 loan performers based on the largest bid price increases between 6/6/25-6/13/25
| RANK | NAME | CHANGE | PRC | PRC-1W | DEALERS |
|---|---|---|---|---|---|
| 1 | MICHAELS STORES (USD) TL L+425 4/15/2028 | 5.02% | 76.23 | 72.59 | 9 |
| 2 | INMARSAT (USD) TL B S+450 9/13/2029 | 3.54% | 94.73 | 91.49 | 10 |
| 3 | AMERICAN BATH (USD) TL L+375 11/23/2027 | 3.44% | 97.82 | 94.56 | 14 |
| 4 | KOFAX (USD) TL S+525 7/20/2029 | 3.03% | 89.72 | 87.08 | 9 |
| 5 | SKILLSOFT (USD) TL B S+525 7/16/2028 | 2.30% | 90.18 | 88.15 | 10 |
| 6 | DAVE & BUSTER’S (USD) TL B S+325 6/29/2029 | 2.00% | 96.44 | 94.54 | 11 |
| 7 | RESTORATION HARDWARE (USD) TL B L+250 10/20/2028 | 1.92% | 96.36 | 94.55 | 8 |
| 8 | VIASAT INC (USD) TL B S+375 3/2/2029 | 1.31% | 95.69 | 94.45 | 10 |
| 9 | MAGNERA CORP TL B | 1.15% | 96.85 | 95.75 | 5 |
| 10 | ENDO FIN HLDGS INC (USD) TL S+400 4/23/2031 | 0.81% | 98.69 | 97.90 | 7 |
Bottom 10 Performers
Showcases the bottom 10 loan performers based on the largest bid price decreases between 6/6/25-6/13/25
| RANK | NAME | CHANGE | PRC | PRC-1W | DEALERS |
|---|---|---|---|---|---|
| 1 | CDK GLOBAL (USD) TL B S+325 7/6/2029 | -5.27% | 83.92 | 88.59 | 16 |
| 2 | INTERNET BRANDS (USD) TL B4 S+425 12/11/2031 | -4.75% | 84.78 | 89.02 | 13 |
| 3 | MAGNOLIA (USD) TL L+375 2/1/2028 | -3.48% | 83.42 | 86.43 | 14 |
| 4 | TECTUM HOLDINGS INC (USD) TL B L+375 1/31/2028 | -2.79% | 89.04 | 91.59 | 8 |
| 5 | ELECTRONICS FOR IMAGING (USD) TL L+500 7/23/2026 | -2.12% | 71.97 | 73.53 | 8 |
| 6 | KIK CUSTOM (USD) TL B S+400 6/26/2031 | -1.97% | 85.43 | 87.15 | 13 |
| 7 | VET INTERMEDIATE (USD) TL B S+500 9/19/2029 | -1.88% | 87.90 | 89.58 | 8 |
| 8 | OSMOSE (USD) TL L+325 6/23/2028 | -1.61% | 97.39 | 98.98 | 8 |
| 9 | LESLIE’S POOLMART (USD) TL B L+275 3/9/2028 | -1.50% | 72.97 | 74.08 | 13 |
| 10 | AMERICAN TRAILER WORLD (USD) TL L+375 3/3/2028 | -1.48% | 80.64 | 81.85 | 16 |
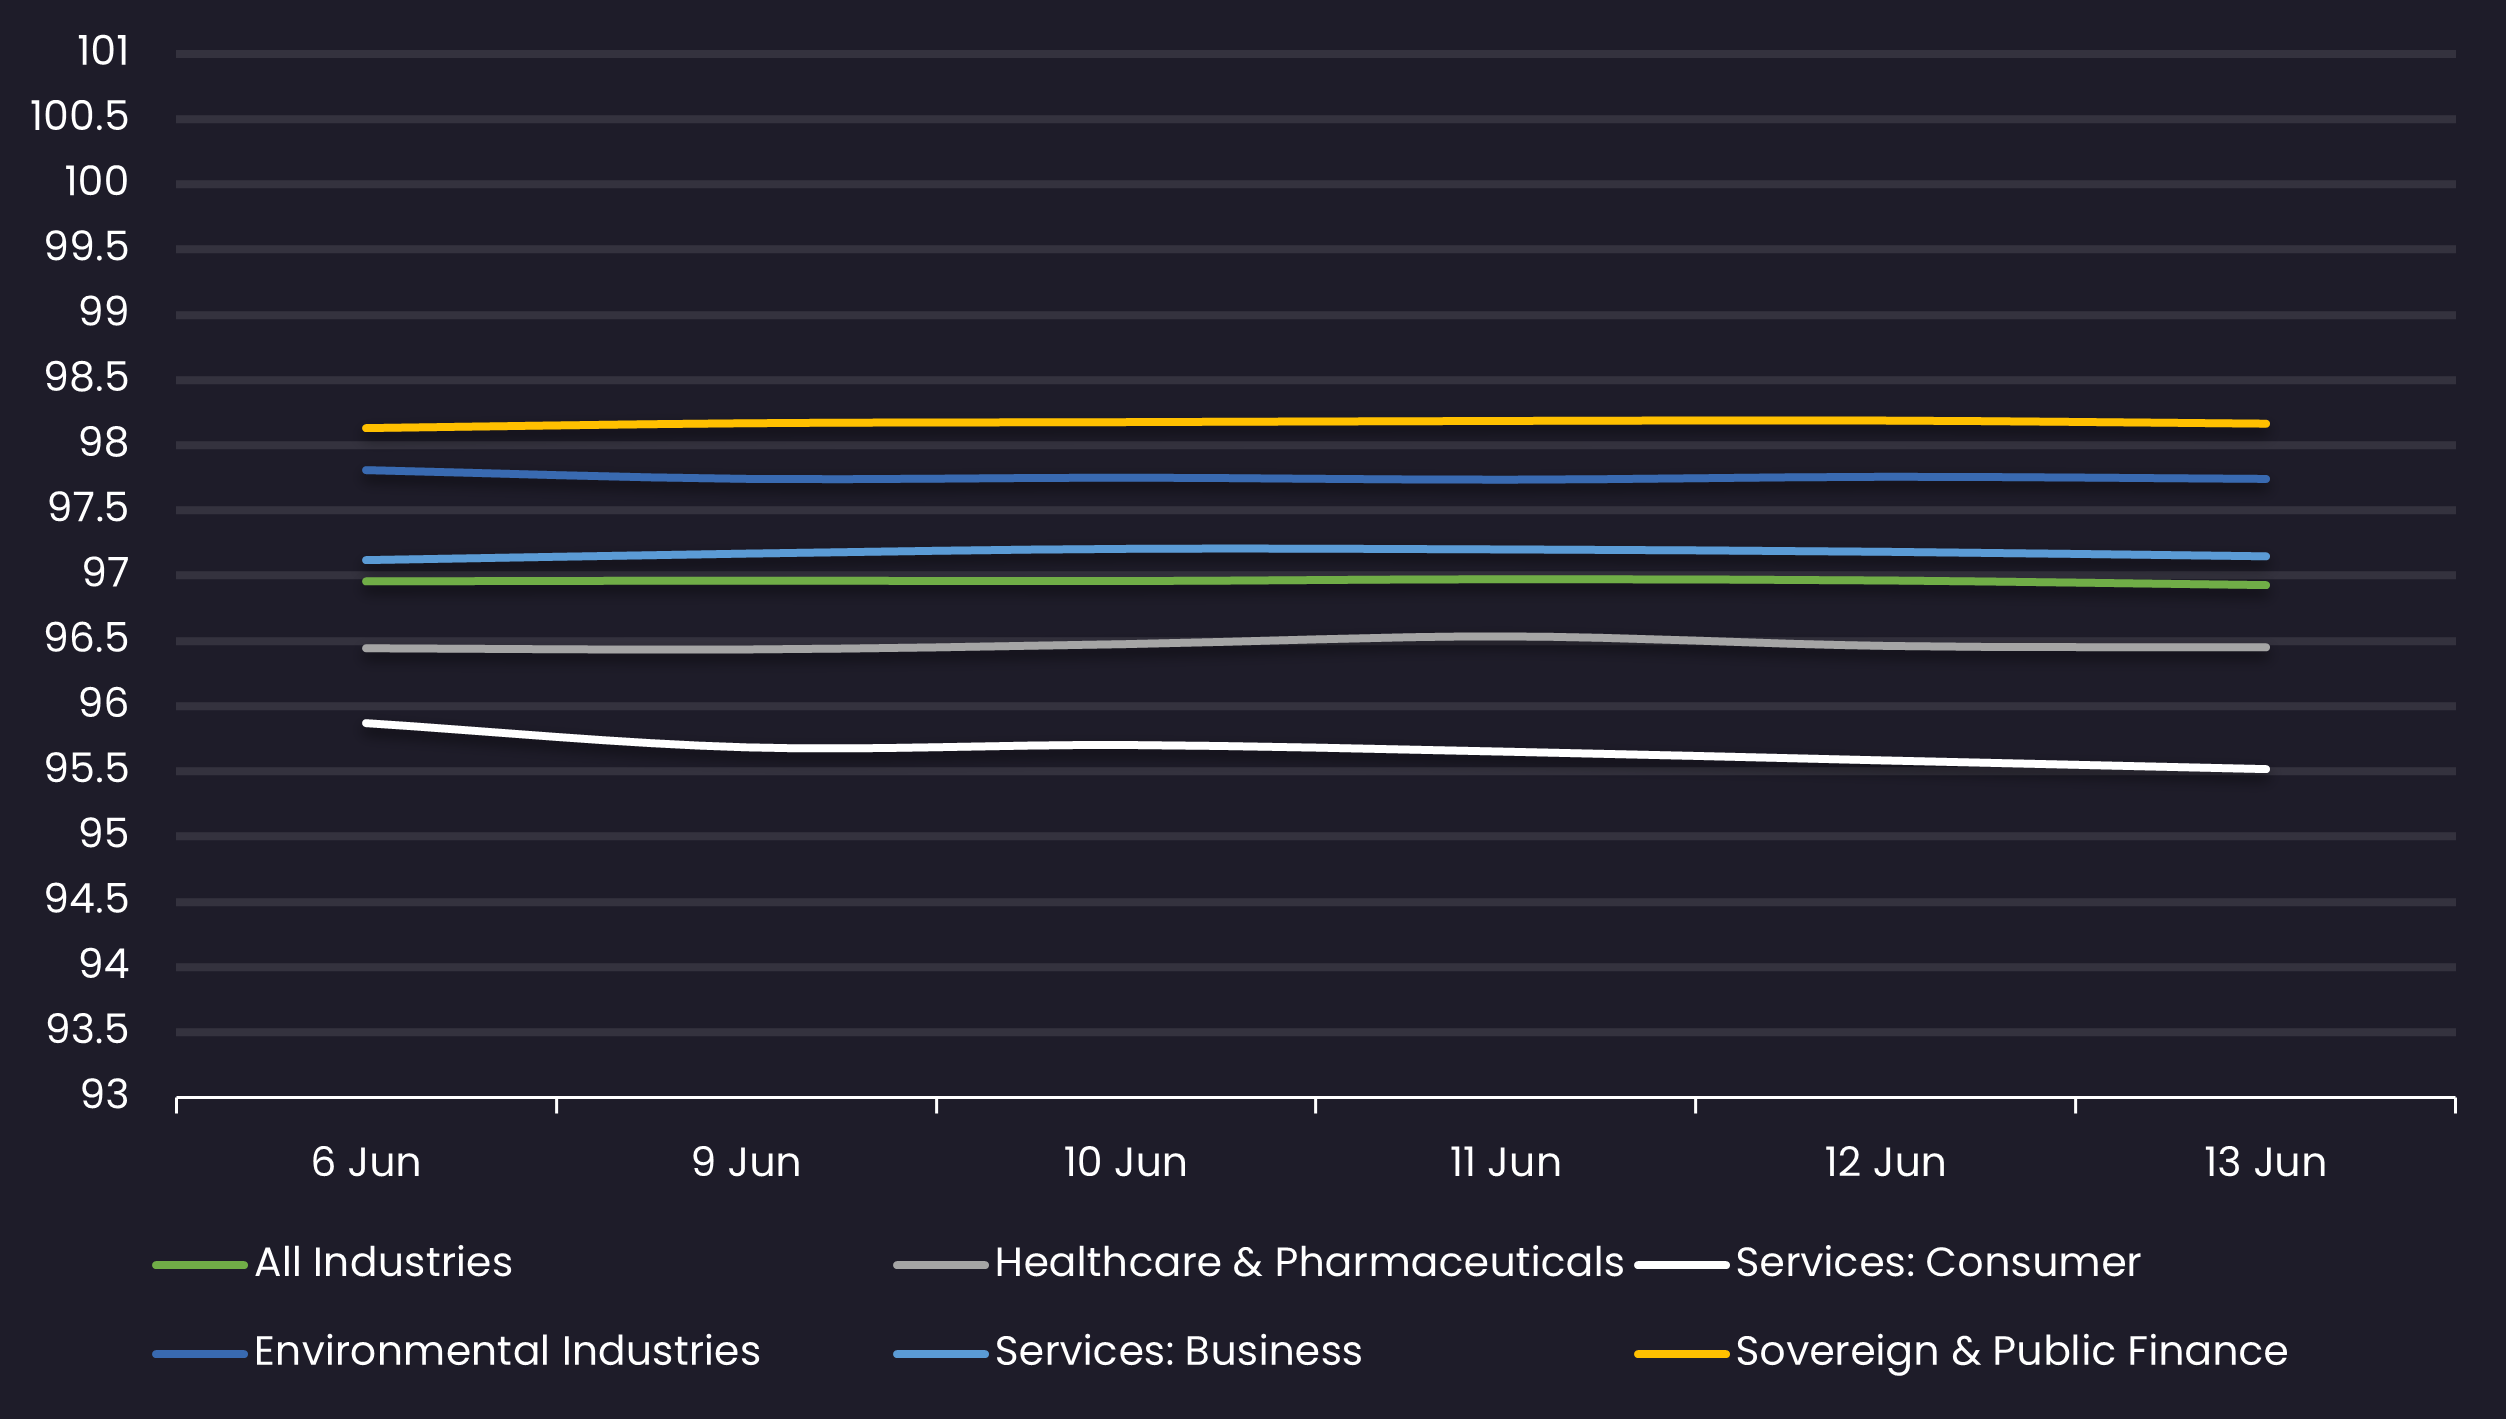
Avg Bid PX by Sector
Displays the average loan bid price by sector between 6/6/25-6/13/25 Results are based on 5 select industry sectors, however, we offer data across 36 sectors
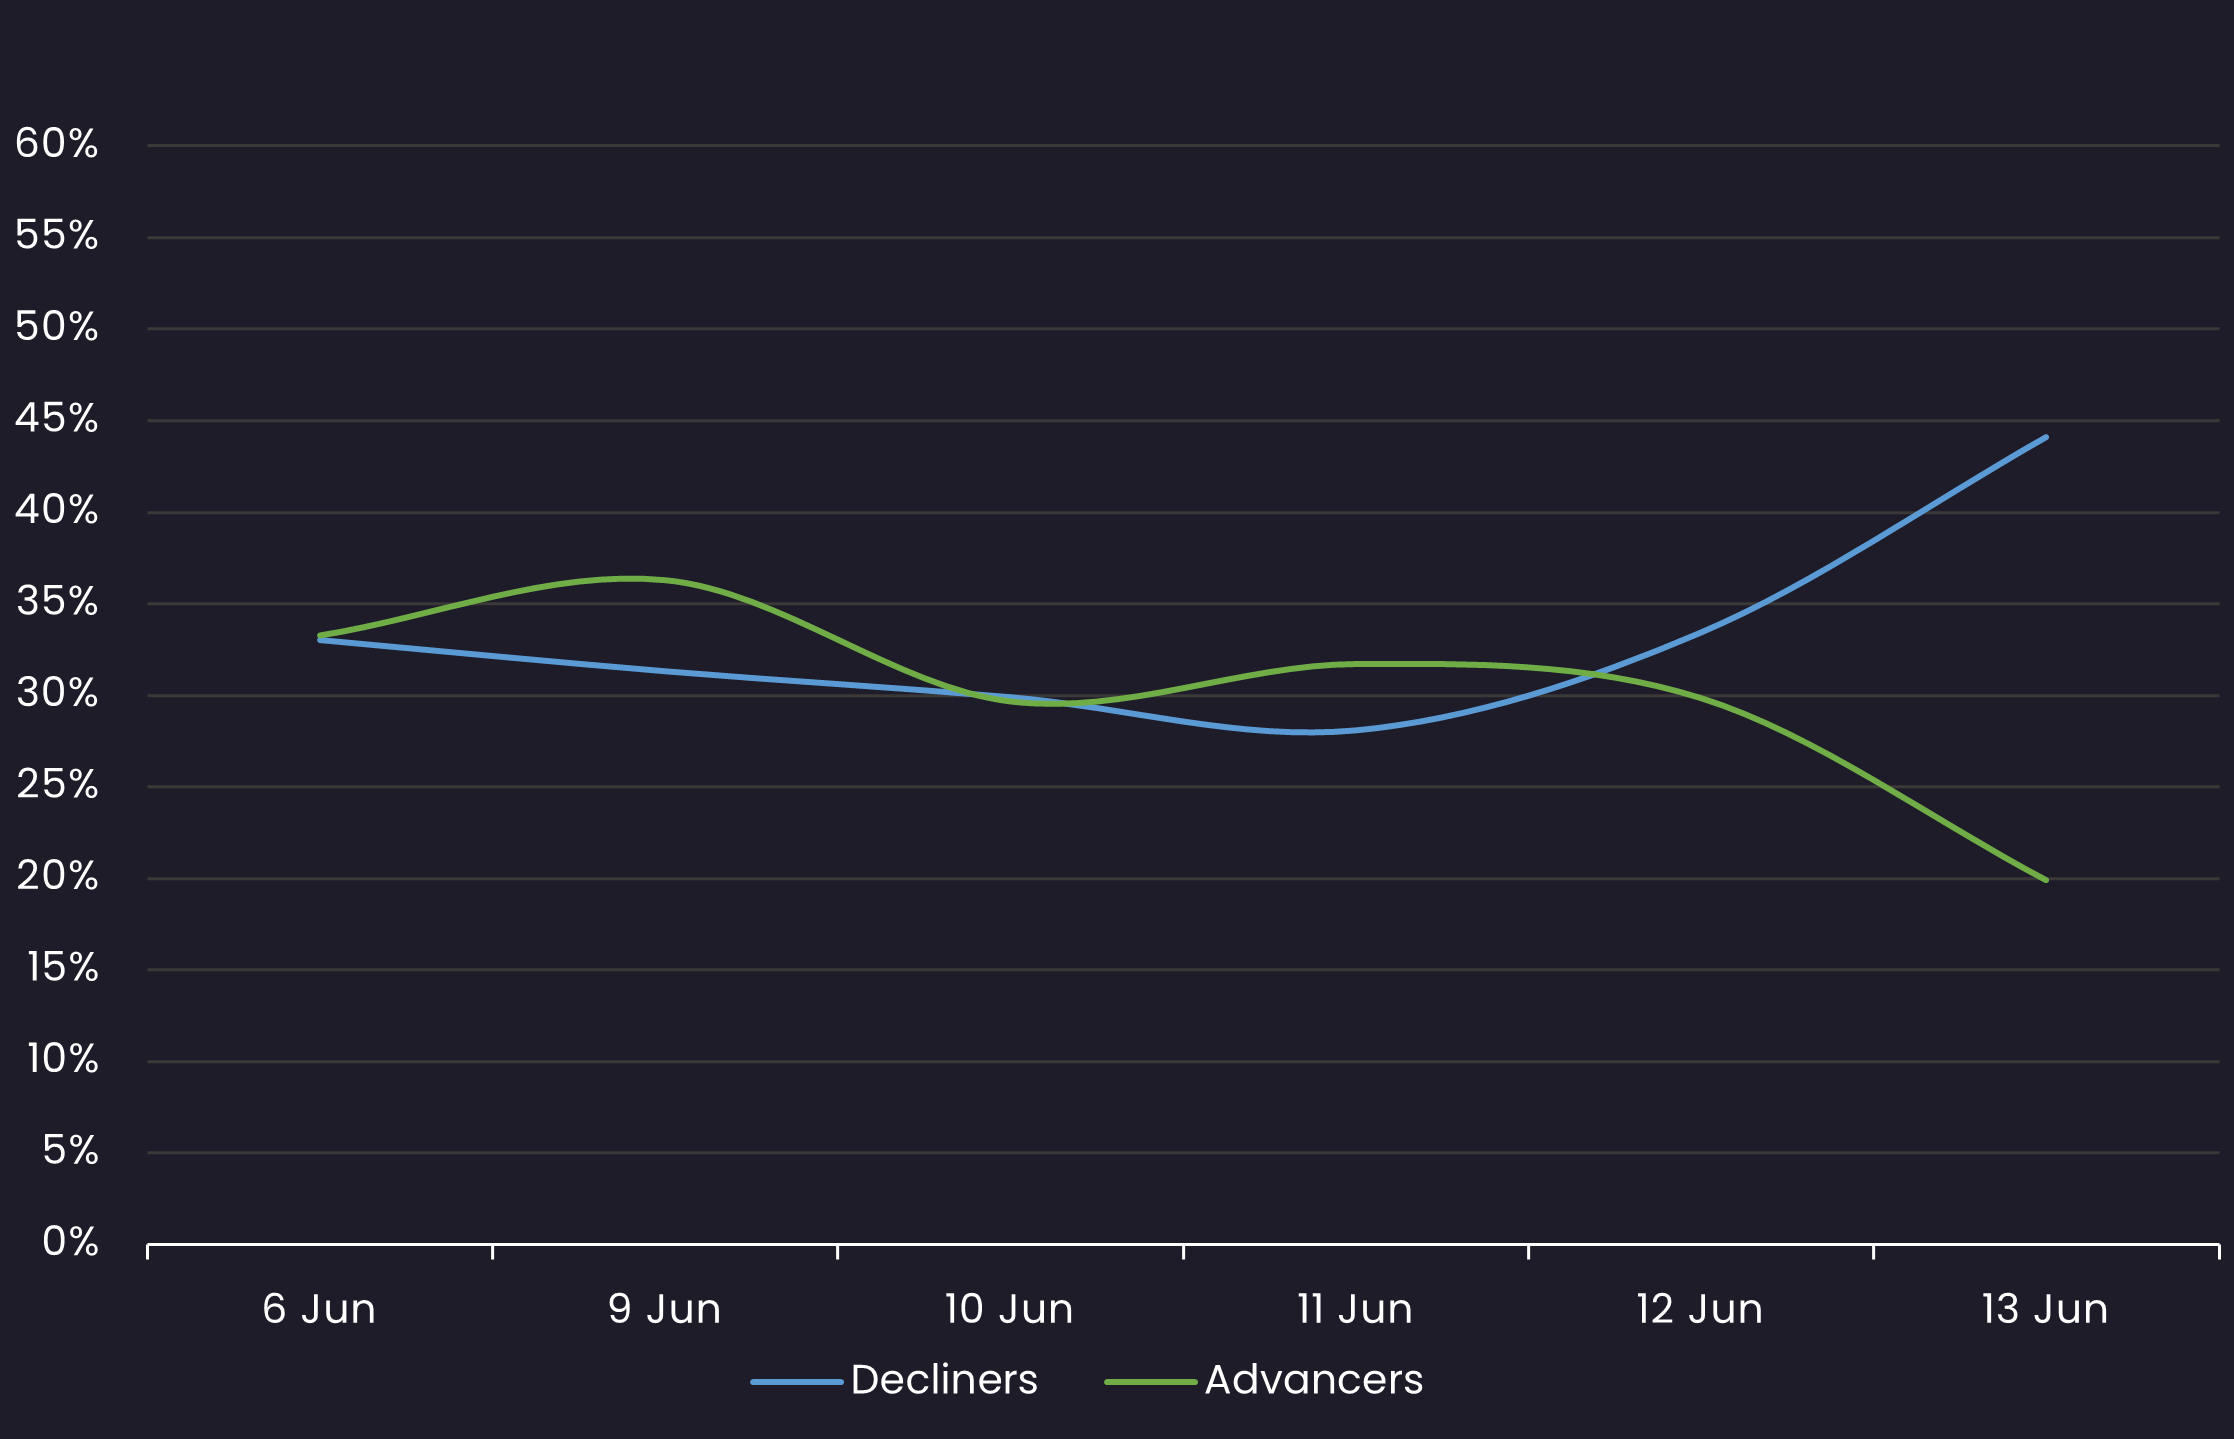
Sentiment
Reveals the percent of loans increasing in price (advancers) vs. loans decreasing in price (decliners) between 6/6/25-6/13/25
Top Quote Volume Movers: This Week vs Last Week
Exhibits the loans with the largest increase in quote volume for the week ending 6/6/25 vs. the week ending 6/13/25
| RANK | TRANCHE | PRIOR WEEK | THIS WEEK | INCREASE | % INCREASE |
|---|---|---|---|---|---|
| 1 | INTL GAME TECH PLC (USD) TL B S+475 5/8/2032 | 30 | 66 | 36 | 120% |
| 2 | HELP SYSTEMS (USD) TL L+400 11/19/2026 | 32 | 62 | 30 | 94% |
| 3 | EMERSON ELECTRIC CO TL B | 56 | 84 | 28 | 50% |
| 4 | POWER SOLUTIONS TL B | 0 | 25 | 25 | NA |
| 5 | HERBALIFE LTD (USD) TL B S+675 4/5/2029 | 38 | 62 | 24 | 63% |
| 6 | AECOM (USD) TL S+175 4/19/2031 | 58 | 80 | 22 | 38% |
| 7 | CARDENAS MARKETS (USD) TL B S+675 8/1/2029 | 46 | 68 | 22 | 48% |
| 8 | VERIZON (USD) TL B2 L+550 9/1/2027 | 28 | 48 | 20 | 71% |
| 9 | AMERICAN BATH (USD) TL L+375 11/23/2027 | 66 | 86 | 20 | 30% |
| 10 | INNOVATIVE XCESSORIES (USD) TL L+425 3/5/2027 | 30 | 49 | 19 | 63% |
Most Quoted Loans
Ranks the loans that were quoted by the highest number of dealers between 6/6/25-6/13/25
| RANK | TRANCHE | DEALERS |
|---|---|---|
| 1 | ALLIANT HLDGS I INC (USD) TL B S+325 9/12/2031 | 19 |
| 2 | HUB INTL LTD (USD) TL B S+250 6/20/2030 | 18 |
| 3 | AMWINS GROUP INC (USD) TL B S+225 1/23/2032 | 18 |
| 4 | BMC SOFTWARE (USD) TL B S+325 7/30/2031 | 18 |
| 5 | WHITE CAP BUYER LLC (USD) TL B S+325 10/19/2029 | 18 |
| 6 | AVOLON HLDGS FNDG LTD (USD) TL B6 S+175 6/21/2030 | 18 |
| 7 | CEVA SANTE ANIMALE (EUR) TL B E+350 11/30/2030 | 17 |
| 8 | ZIGGO (EUR) TL H E+300 1/17/2029 | 17 |
| 9 | GOLDEN NUGGET INC (USD) TL B S+350 1/27/2029 | 17 |
| 10 | BROADSTREET PARTNERS INC (USD) TL B4 S+300 6/16/2031 | 17 |
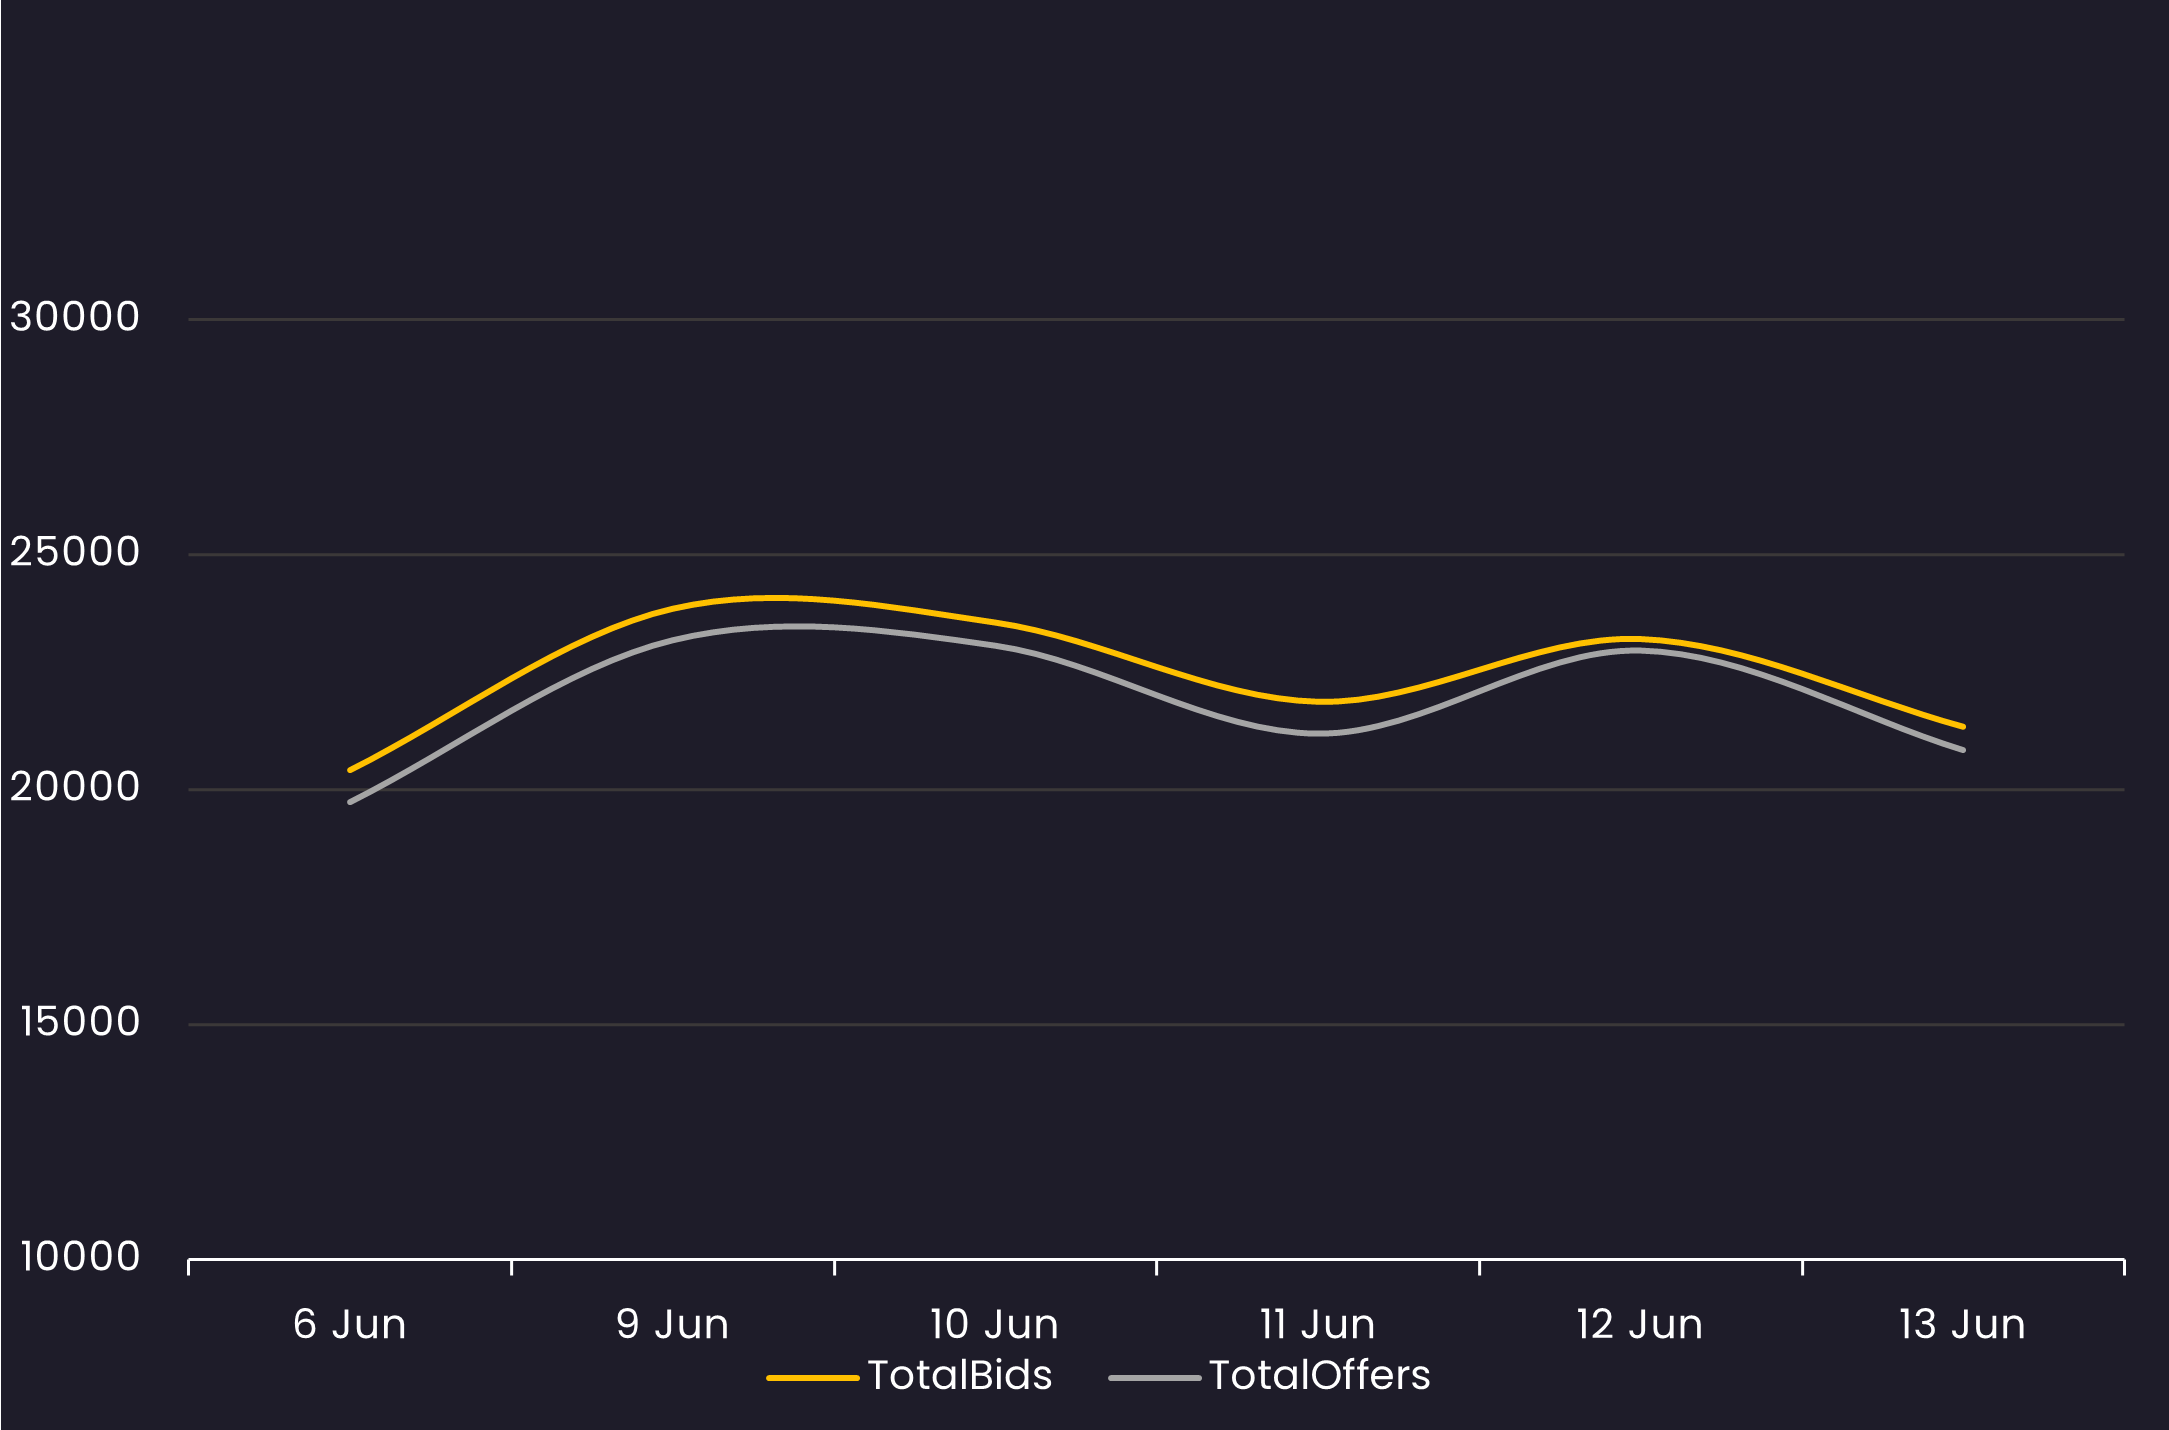
Bid and Offer Volume
Reveals the total number of quotes by bid and offer between 6/6/25-6/13/25
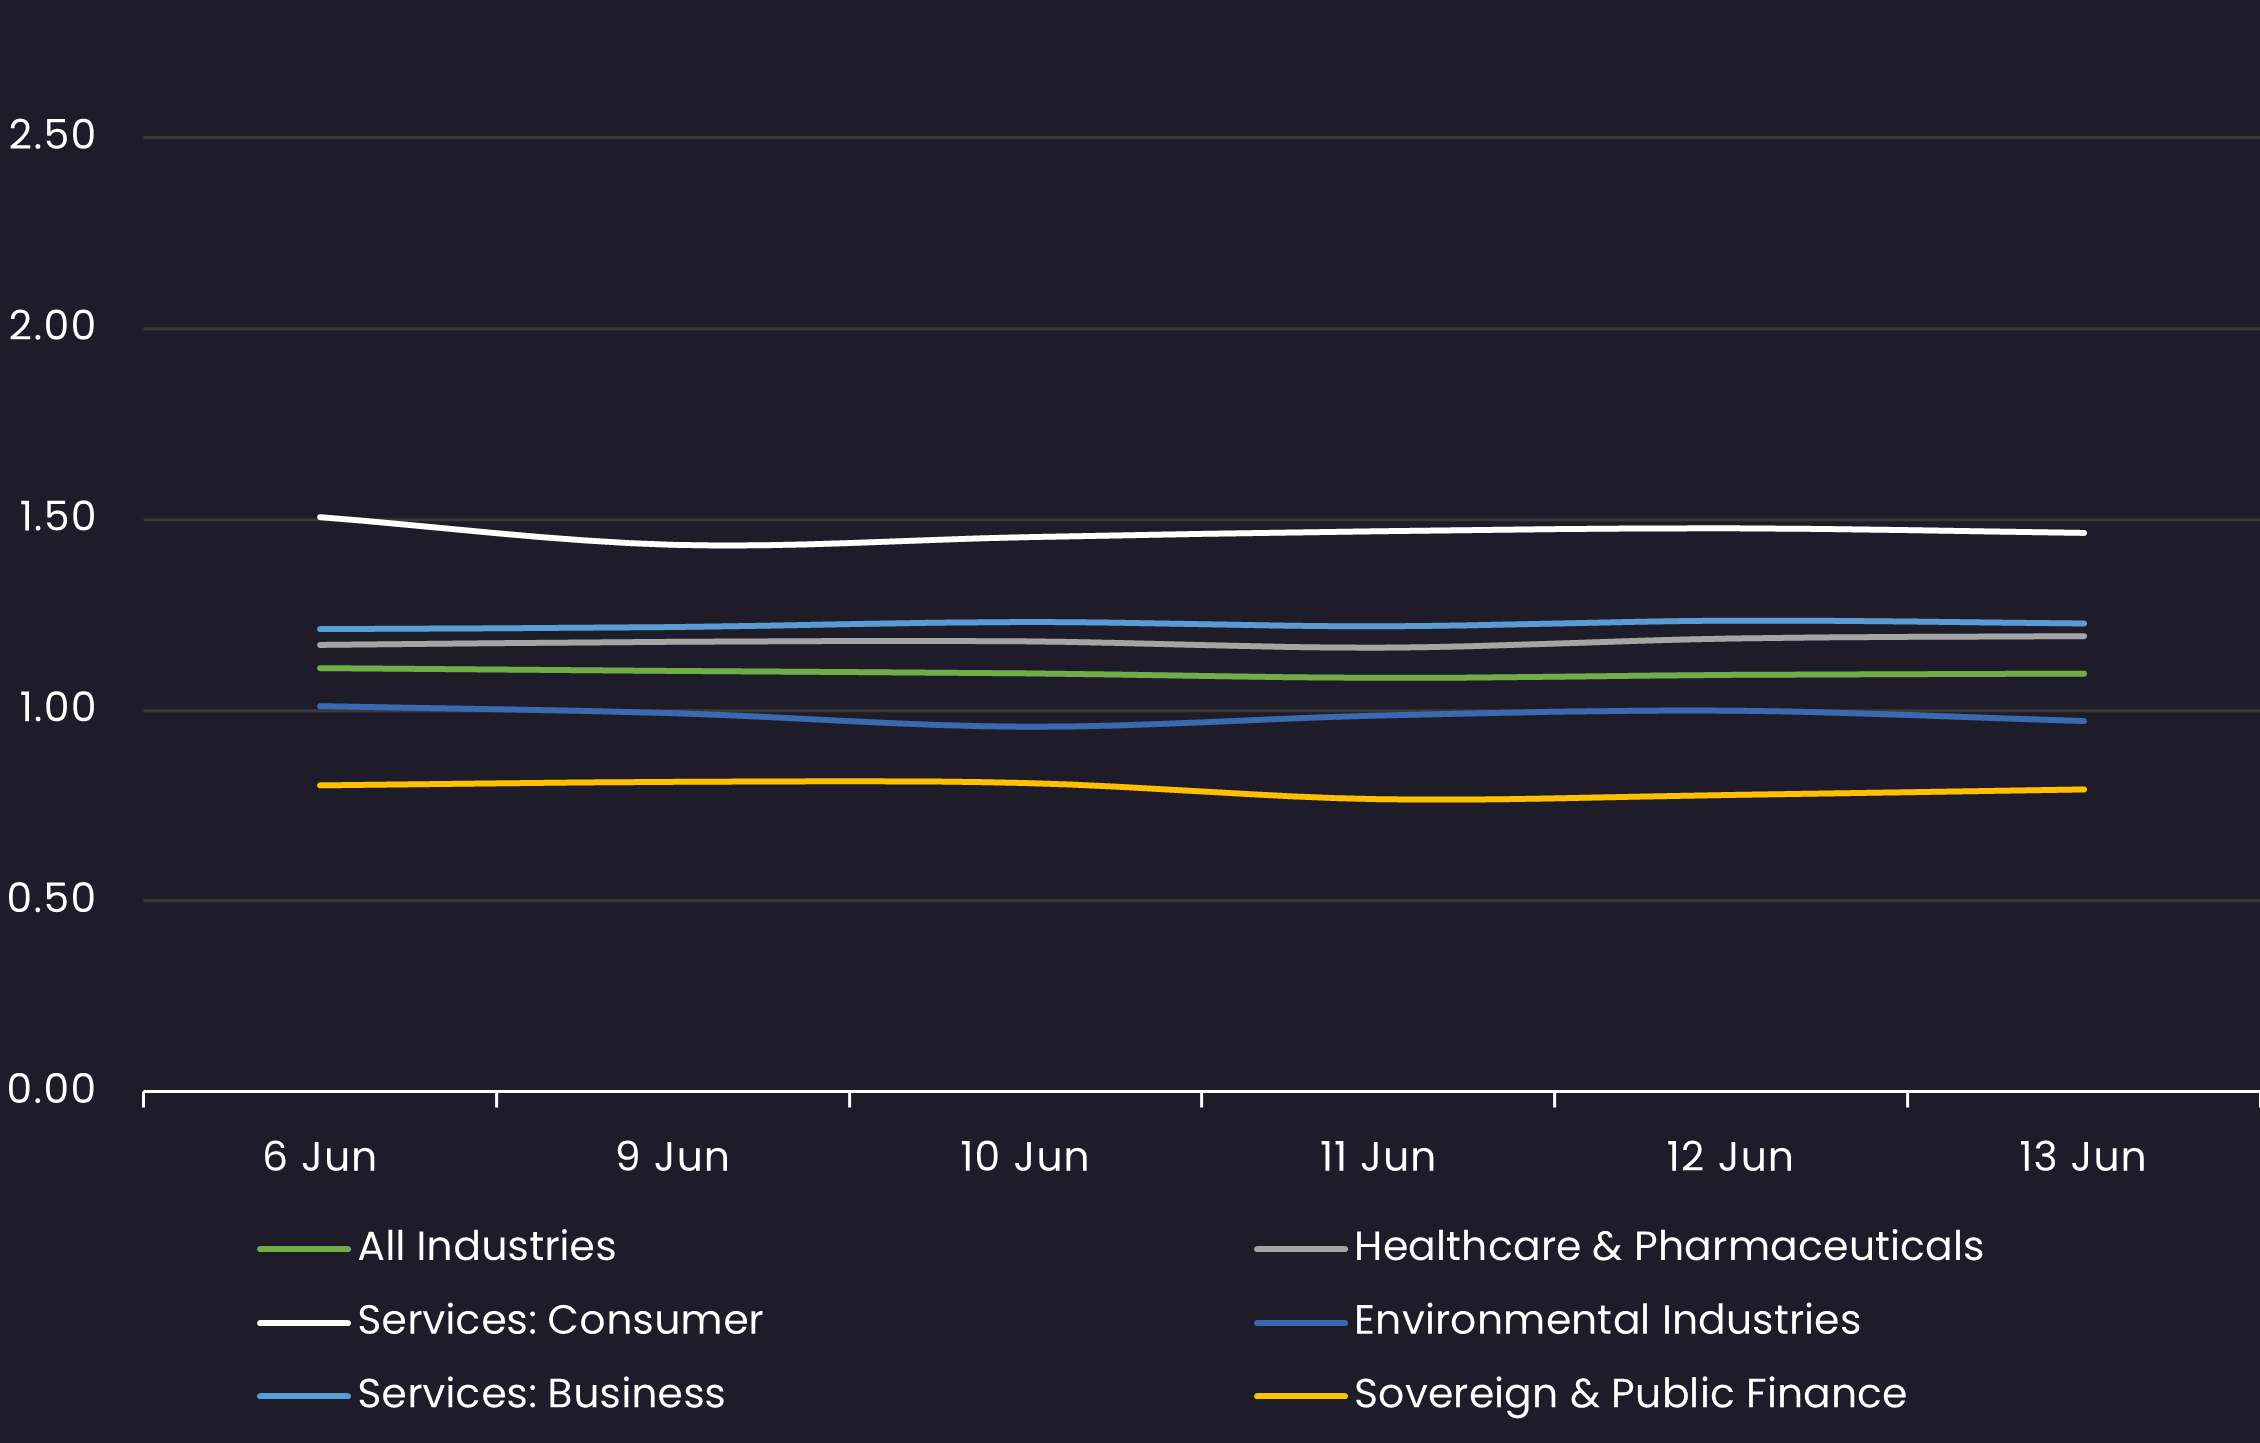
Sector Bid-Offer Spread
Results are based on 5 select industry sectors, however, we offer data across 36 sectors
Stay up-to-date with weekly summaries.
Related Resources
About SOLVE
SOLVE is the leading market data platform provider for fixed-income securities, trusted by sophisticated buy-side and sell-side firms worldwide. Founded in 2011, SOLVE leverages its AI-driven technology and deep industry expertise to offer unparalleled transparency into markets, reduce risk, and save hundreds of hours across front-office workflows. With the largest real-time datasets for Securitized Products, Municipal Bonds, Corporate Bonds, Syndicated Bank Loans, Convertible Bonds, CDS, and Private Credit, SOLVE empowers clients to transform the way they bring new securities to market, trade on secondary markets, and value highly illiquid securities. Headquartered in Connecticut, with offices across the globe, SOLVE is the definitive source for market pricing in fixed-income markets.
