Syndicated Bank Loan Market Summary – Week Ending 5/30/25
GET OUR BANK LOAN MARKET SUMMARIES STRAIGHT TO YOUR INBOX. LEARN MORE
Syndicated Bank Loan Market Summary: Week Ending 5/30/25
Our newsletter presents key trends derived from observable Syndicated Bank Loan pricing data over a weekly period.
New Issues
Loans issued during the week ending 5/30/25
| ISSUER | AMOUNT (MM) | LOAN TYPE | MATURITY | RATE |
|---|---|---|---|---|
| Dedalus Finance GmbH | 1225 | Term Loan | 5/1/2030 | E+425 |
| United Talent Agency LLC | 928 | Term Loan | 5/28/2032 | S+375 |
| Signature Aviation US Hldg Inc. | 770 | Term Loan | 7/2/2031 | S+275 |
| Boliden AB | 700 | Term Loan | 5/28/2028 | |
| Alvest | 540 | Term Loan | 5/28/2032 | E+375 |
forward calendar
Forward calendar during the week ending 5/30/25
| Issuer | Deal Information | Banks | Expected Issue Date |
|---|---|---|---|
| CFC Group | $1.27B (B2/B-) 0% floor, 101 soft call for 6M | JPM | Q2 2024 |
| Compass Power Generation Llc | $542.2 TLB ,1% floor, 101 soft call for 6M | MS | Q2 2024 |
| First Eagle Investment Management | “$2.85B (BB-/BB-) floor, OID 98.5 to 99, 101 soft call for 6M “ | MS, BofA, UBS, BMO, BCLY, GS, RBC, JEFF, HSBC, WF, TRUI, ING | Q2 2024 |
Largest Loans
Highlights the weekly price movements and quote depth for the 20 largest bank loans between 5/23/25-5/30/25
| RANK | SIZE (MM) | NAME | CHANGE | PRC | PRC-1W | DEALERS |
|---|---|---|---|---|---|---|
| 1 | 6,145 | MAGNOLIA (USD) TL L+375 2/1/2028 | 1.21% | 86.65 | 85.61 | 12 |
| 2 | 4,750 | ZAYO (USD) TL L+300 3/9/2027 | 0.98% | 95.07 | 94.15 | 14 |
| 3 | 4,741 | INTERNET BRANDS (USD) TL B S+425 4/20/2028 | -0.63% | 95.80 | 96.40 | 11 |
| 4 | 4,525 | TRANSDIGM INC (USD) TL I S+275 8/24/2028 | 0.14% | 100.30 | 100.16 | 16 |
| 5 | 4,479 | TIBCO (USD) TL B S+350 3/30/2029 | 0.00% | 99.69 | 99.69 | 11 |
| 6 | 3,935 | SS&C TECHS INC (USD) TL B8 S+200 5/2/2031 | 0.04% | 100.32 | 100.28 | 15 |
| 7 | 3,900 | DIRECTV FNCG LLC (USD) TL L+500 8/2/2027 | 0.11% | 100.30 | 100.19 | 11 |
| 8 | 3,640 | TRANSDIGM INC (USD) TL J S+250 2/12/2031 | 0.18% | 99.95 | 99.77 | 16 |
| 9 | 3,573 | CDK GLOBAL (USD) TL B S+325 7/6/2029 | 0.87% | 88.82 | 88.05 | 17 |
| 10 | 3,420 | RCN GRANDE (USD) TL L+325 9/25/2026 | -0.13% | 87.51 | 87.62 | 10 |
| 11 | 3,380 | SOLERA (USD) TL B L+400 6/2/2028 | 0.16% | 96.78 | 96.63 | 15 |
| 12 | 3,340 | PROOFPOINT (USD) TL B S+300 8/31/2028 | 0.32% | 99.92 | 99.60 | 12 |
| 13 | 3,100 | ASURION (USD) TL B8 L+325 12/23/2026 | 0.06% | 99.89 | 99.83 | 10 |
| 14 | 3,095 | PAREXEL INTERNATIONAL (USD) TL B S+250 11/15/2028 | 0.10% | 99.96 | 99.86 | 12 |
| 15 | 3,000 | DELTA SKYMILES (USD) TL B L+375 10/20/2027 | 0.13% | 100.53 | 100.40 | 14 |
| 16 | 2,750 | REALPAGE INC (USD) TL B L+325 4/24/2028 | 0.29% | 99.23 | 98.95 | 14 |
| 17 | 2,710 | DELL SOFTWARE GROUP (USD) TL B S+425 2/1/2029 | -4.20% | 50.32 | 52.53 | 10 |
| 18 | 2,700 | SYNEOS HEALTH INC (USD) TL B S+400 9/20/2030 | -0.04% | 98.02 | 98.07 | 12 |
| 19 | 2,619 | TEAM HEALTH (USD) EXT TL B S+525 3/2/2027 | 0.19% | 99.47 | 99.28 | 12 |
| 20 | 2,600 | CORNERSTONE BLDG BRANDS INC (USD) TL L+325 4/12/2028 | 0.64% | 88.32 | 87.75 | 15 |
| AVERAGE | 3,620 | 0.02% | 94.34 | 99.99 | 13.0 |
Top 10 Performers
Showcases the top 10 loan performers based on the largest bid price increases between 5/23/25-5/30/25
| RANK | NAME | CHANGE | PRC | PRC-1W | DEALERS |
|---|---|---|---|---|---|
| 1 | 8TH AVENUE FOOD & PROVISIONS (USD) TL L+375 10/1/2025 | 5.93% | 96.92 | 91.49 | 9 |
| 2 | KIK CUSTOM (USD) TL B S+400 6/26/2031 | 3.35% | 85.11 | 82.36 | 13 |
| 3 | OREGON TOOL LUX LP (USD) 2L TL B S+400 10/15/2029 | 2.21% | 78.52 | 76.82 | 4 |
| 4 | FONCIA GROUPE (EUR) TL B E+525 3/27/2028 | 1.97% | 90.17 | 88.43 | 13 |
| 5 | OMNI LOGISTICS (USD) TL B S+400 9/20/2030 | 1.54% | 98.08 | 96.60 | 12 |
| 6 | ZAYO (USD) TL S+425 3/9/2027 | 1.30% | 95.64 | 94.41 | 14 |
| 7 | MULTI-COLOR (USD) TL B L+500 10/29/2028 | 1.23% | 89.22 | 88.14 | 14 |
| 8 | BIOGROUP (EUR) TL B E+350 1/28/2028 | 1.05% | 99.17 | 98.14 | 15 |
| 9 | ACPRODUCTS HLDGS INC (USD) TL B L+425 5/17/2028 | 0.88% | 73.64 | 73.00 | 10 |
| 10 | CDK GLOBAL (USD) TL B S+325 7/6/2029 | 0.87% | 88.82 | 88.05 | 17 |
Bottom 10 Perfromers
Showcases the bottom 10 loan performers based on the largest bid price decreases between 5/23/25-5/30/25
| RANK | NAME | CHANGE | PRC | PRC-1W | DEALERS |
|---|---|---|---|---|---|
| 1 | INTERIOR LOGIC (USD) TL B L+350 4/3/2028 | -7.32% | 67.31 | 72.62 | 10 |
| 2 | CAST & CREW (USD) TL B S+375 12/30/2028 | -2.98% | 94.12 | 97.01 | 5 |
| 3 | VANTAGE SPECIALTY (USD) TL B S+475 10/26/2026 | -2.14% | 95.10 | 97.18 | 11 |
| 4 | CERAMTEC (EUR) TL B E+425 3/16/2029 | -1.63% | 96.87 | 98.48 | 16 |
| 5 | SITEL LLC / SITEL FIN CORP (USD) TL B L+375 8/28/2028 | -1.45% | 57.73 | 58.58 | 10 |
| 6 | MERLIN ENTERTAINMENTS (USD) TL B S+350 11/24/2029 | -1.13% | 94.02 | 95.10 | 9 |
| 7 | BRAND INDL SERVS INC (USD) TL B S+450 8/1/2030 | -0.85% | 84.56 | 85.28 | 14 |
| 8 | STYROLUTION (USD) TL B S+425 3/9/2029 | -0.72% | 91.21 | 91.87 | 5 |
| 9 | INTERNET BRANDS (USD) TL B S+425 4/20/2028 | -0.63% | 95.80 | 96.40 | 11 |
| 10 | CERBA HEALTHCARE (EUR) TL C E+400 2/16/2029 | -0.41% | 77.42 | 77.74 | 14 |
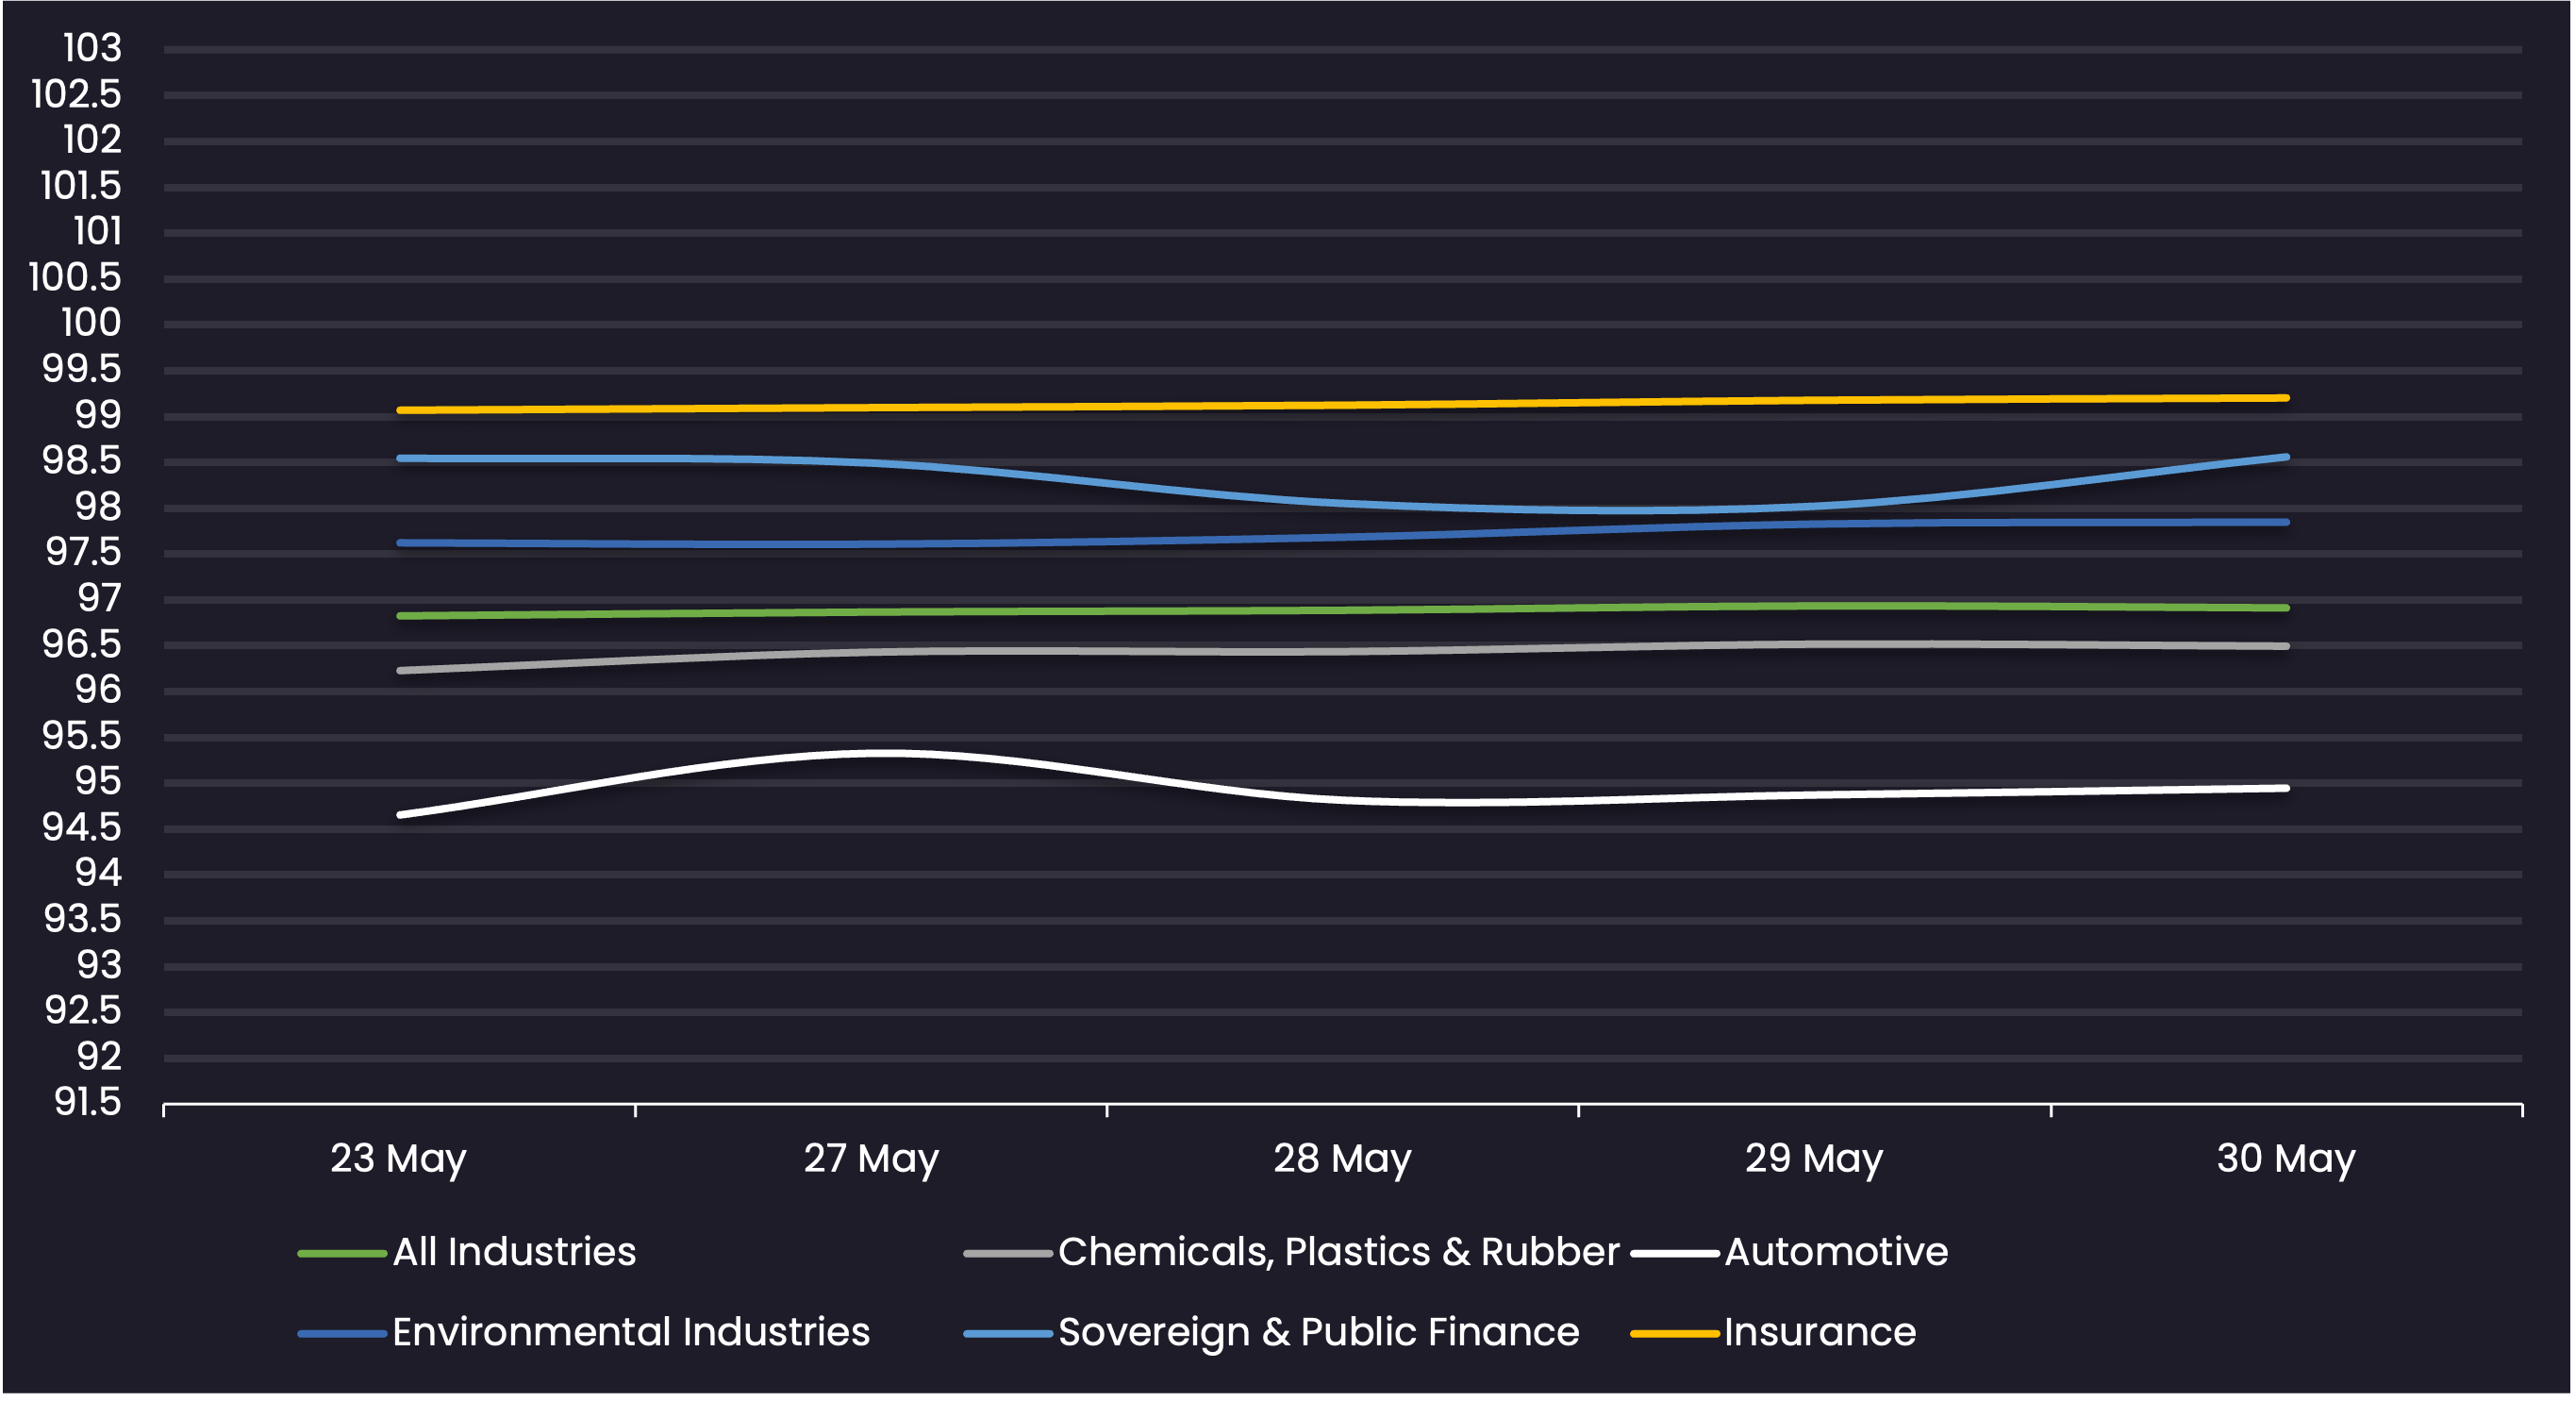
Avg Bid PX by Sector
Displays the average loan bid price by sector between 5/23/25-5/30/25 Results are based on 5 select industry sectors, however, we offer data across 36 sectors
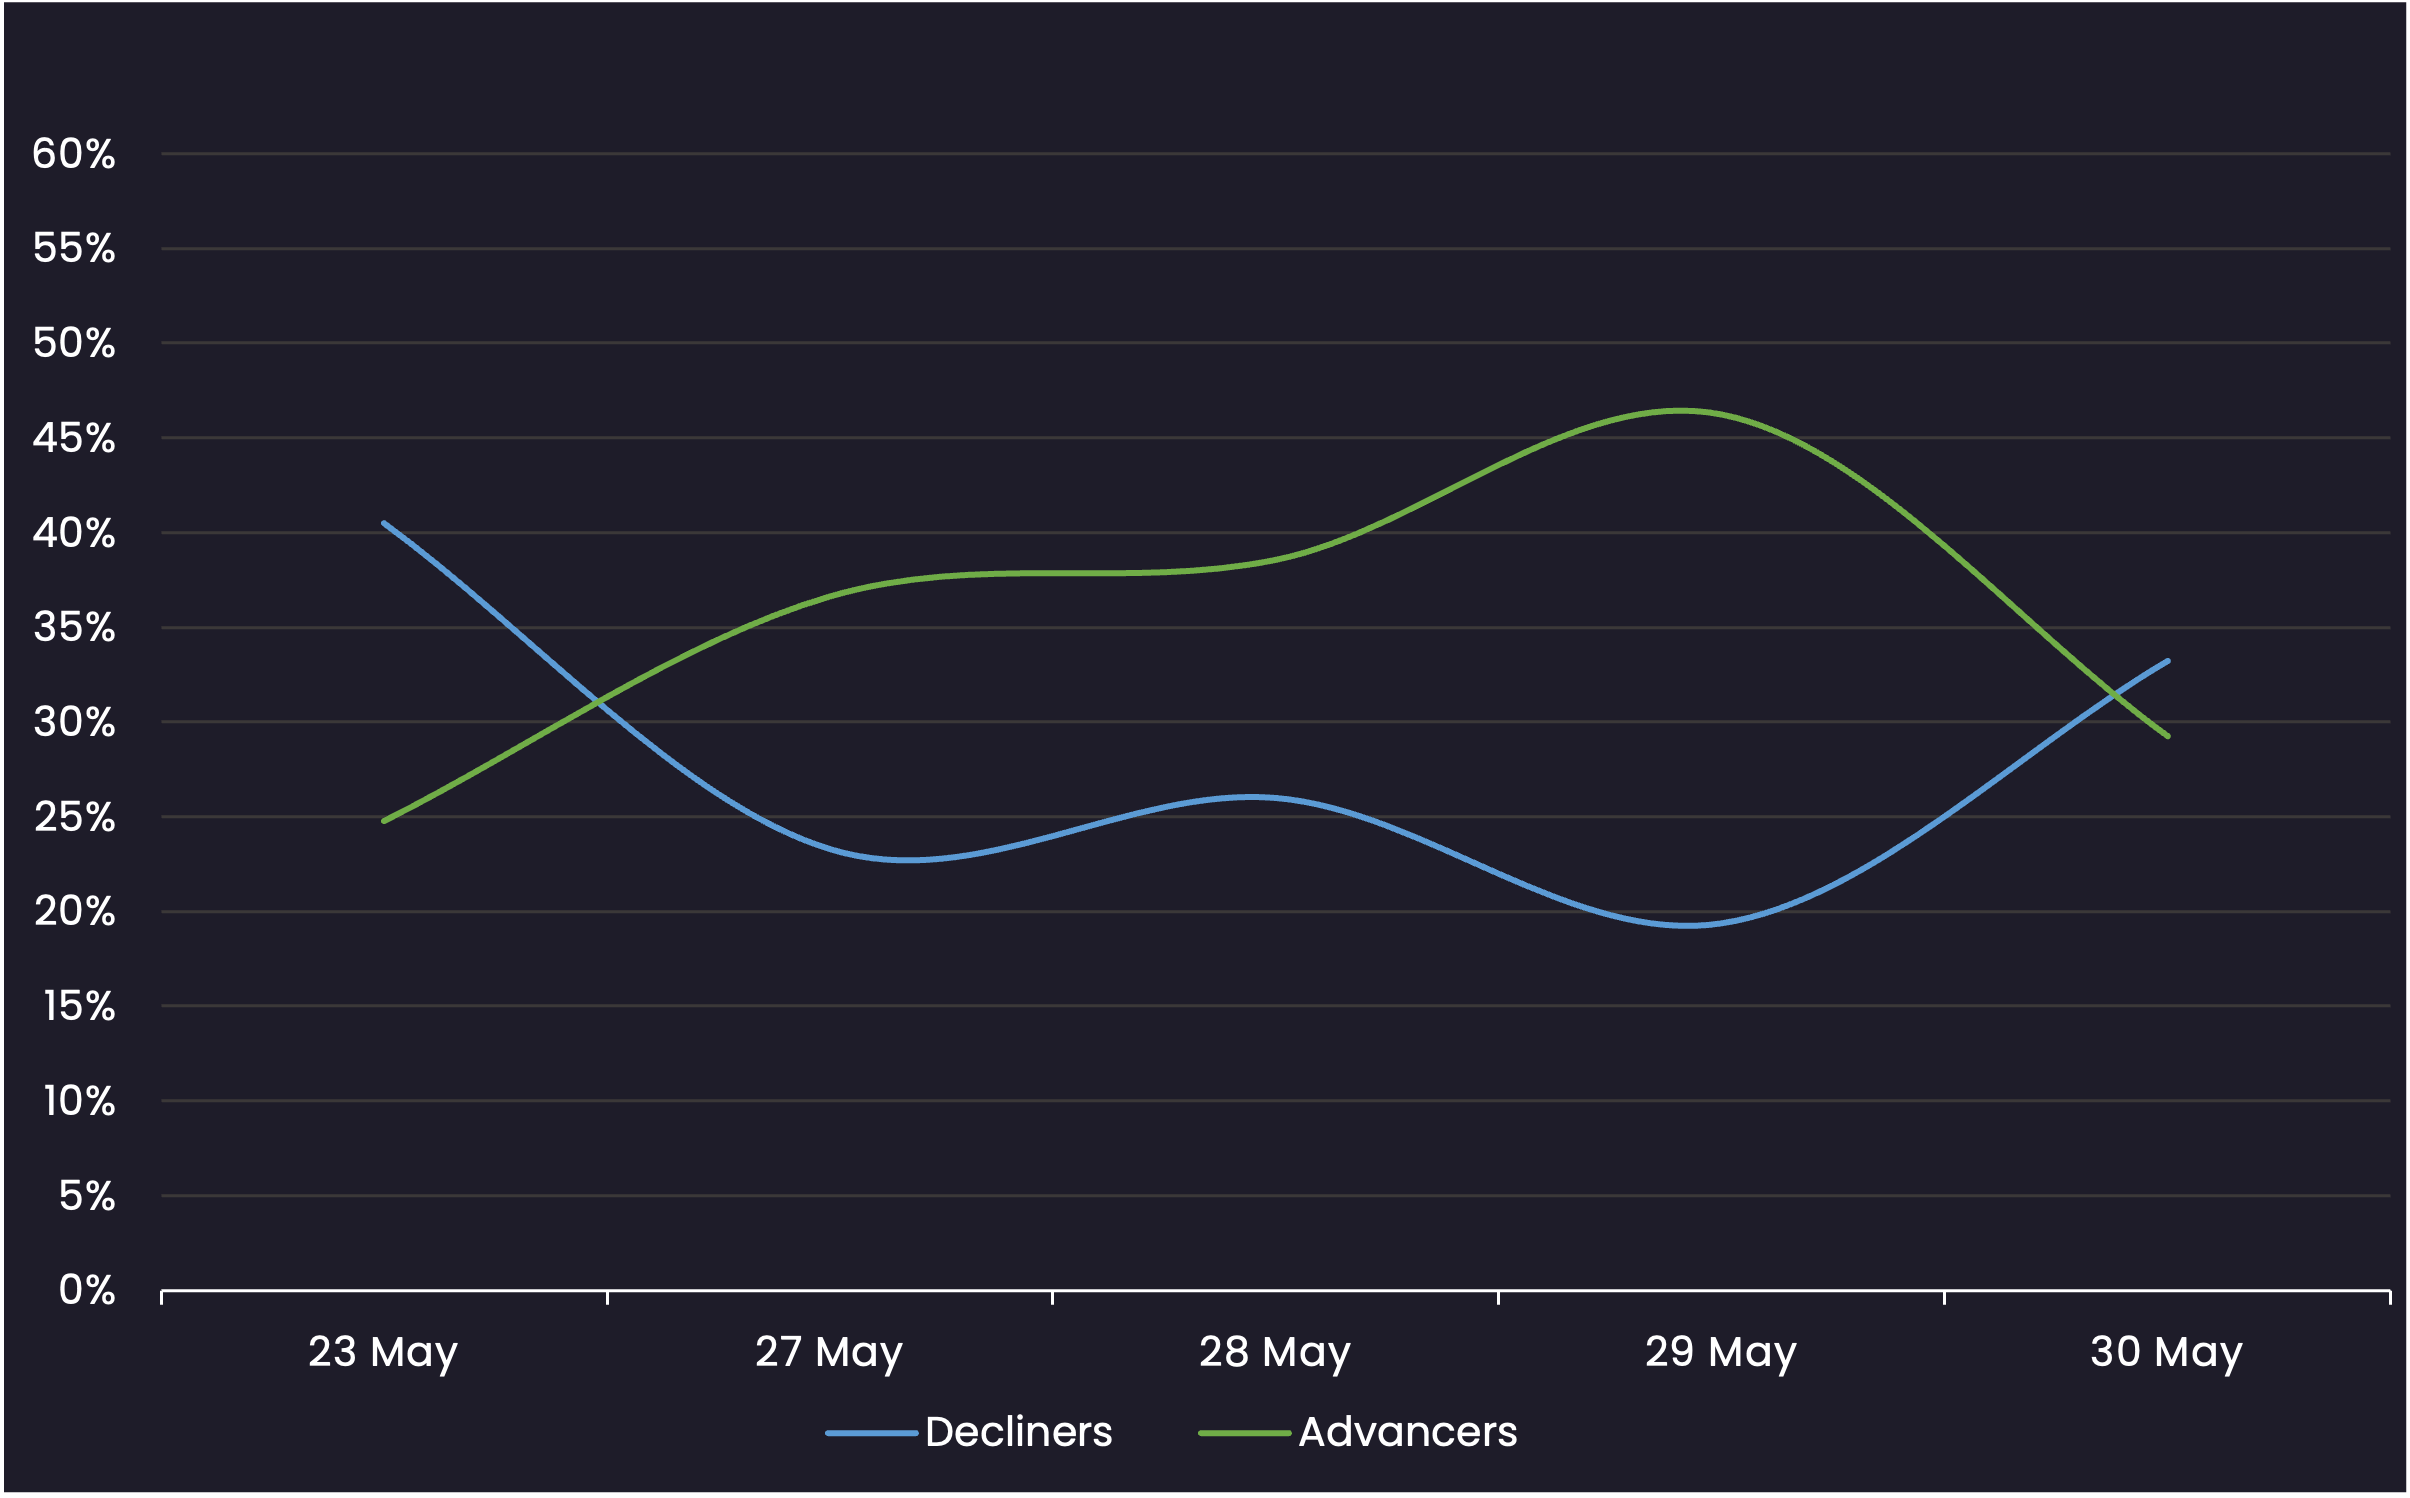
Sentiment
Reveals the percent of loans increasing in price (advancers) vs. loans decreasing in price (decliners) between 5/23/25-5/30/25
Top Quote Volume Movers: This Week vs Last Week
Exhibits the loans with the largest increase in quote volume for the week ending 5/23/25 vs. the week ending 5/30/25
| RANK | TRANCHE | PRIOR WEEK | THIS WEEK | INCREASE | % INCREASE |
|---|---|---|---|---|---|
| 1 | HOMEVI (EUR) TL B E+500 10/27/2029 | 0 | 16 | 16 | NA |
| 2 | RCN GRANDE (USD) TL L+325 9/25/2026 | 14 | 28 | 14 | 100% |
| 3 | ALTICE FNCG SA (EUR) TL B E+500 10/27/2027 | 0 | 8 | 8 | NA |
| 4 | ACCELERATED HEALTH SYSTEMS LLC (USD) TL B S+450 2/15/2029 | 7 | 14 | 7 | 100% |
| 5 | ALTICE FNCG SA (EUR) TL B S+500 10/2/2027 | 10 | 16 | 6 | 60% |
| 6 | HOLOGIC INC (USD) TL L+125 9/27/2026 | 0 | 6 | 6 | NA |
| 7 | INEOS FIN PLC (EUR) TL B E+275 11/8/2028 | 20 | 26 | 6 | 30% |
| 8 | INTRAWEST (USD) TL B L+350 8/17/2028 | 0 | 6 | 6 | NA |
| 9 | SGB-SMIT (EUR) TL B E+450 4/18/2028 | 0 | 6 | 6 | NA |
| 10 | INFORMATICA (USD) TL B S+250 10/29/2028 | 18 | 24 | 6 | 33% |
Most Quoted Loans
Ranks the loans that were quoted by the highest number of dealers between 5/23/25-5/30/25
| RANK | TRANCHE | DEALERS |
|---|---|---|
| 1 | ALLIANT HLDGS I INC (USD) TL B S+325 9/12/2031 | 19 |
| 2 | AMWINS GROUP INC (USD) TL B S+225 1/23/2032 | 19 |
| 3 | HUB INTL LTD (USD) TL B S+250 6/20/2030 | 19 |
| 4 | CEVA SANTE ANIMALE (EUR) TL B E+350 11/30/2030 | 18 |
| 5 | ZIGGO (EUR) TL H E+300 1/17/2029 | 17 |
| 6 | BMC SOFTWARE (USD) TL B S+325 7/30/2031 | 17 |
| 7 | CDK GLOBAL (USD) TL B S+325 7/6/2029 | 17 |
| 8 | WHITE CAP BUYER LLC (USD) TL B S+325 10/19/2029 | 17 |
| 9 | GOLDEN NUGGET INC (USD) TL B S+350 1/27/2029 | 17 |
| 10 | BROADSTREET PARTNERS INC (USD) TL B4 S+300 6/16/2031 | 17 |
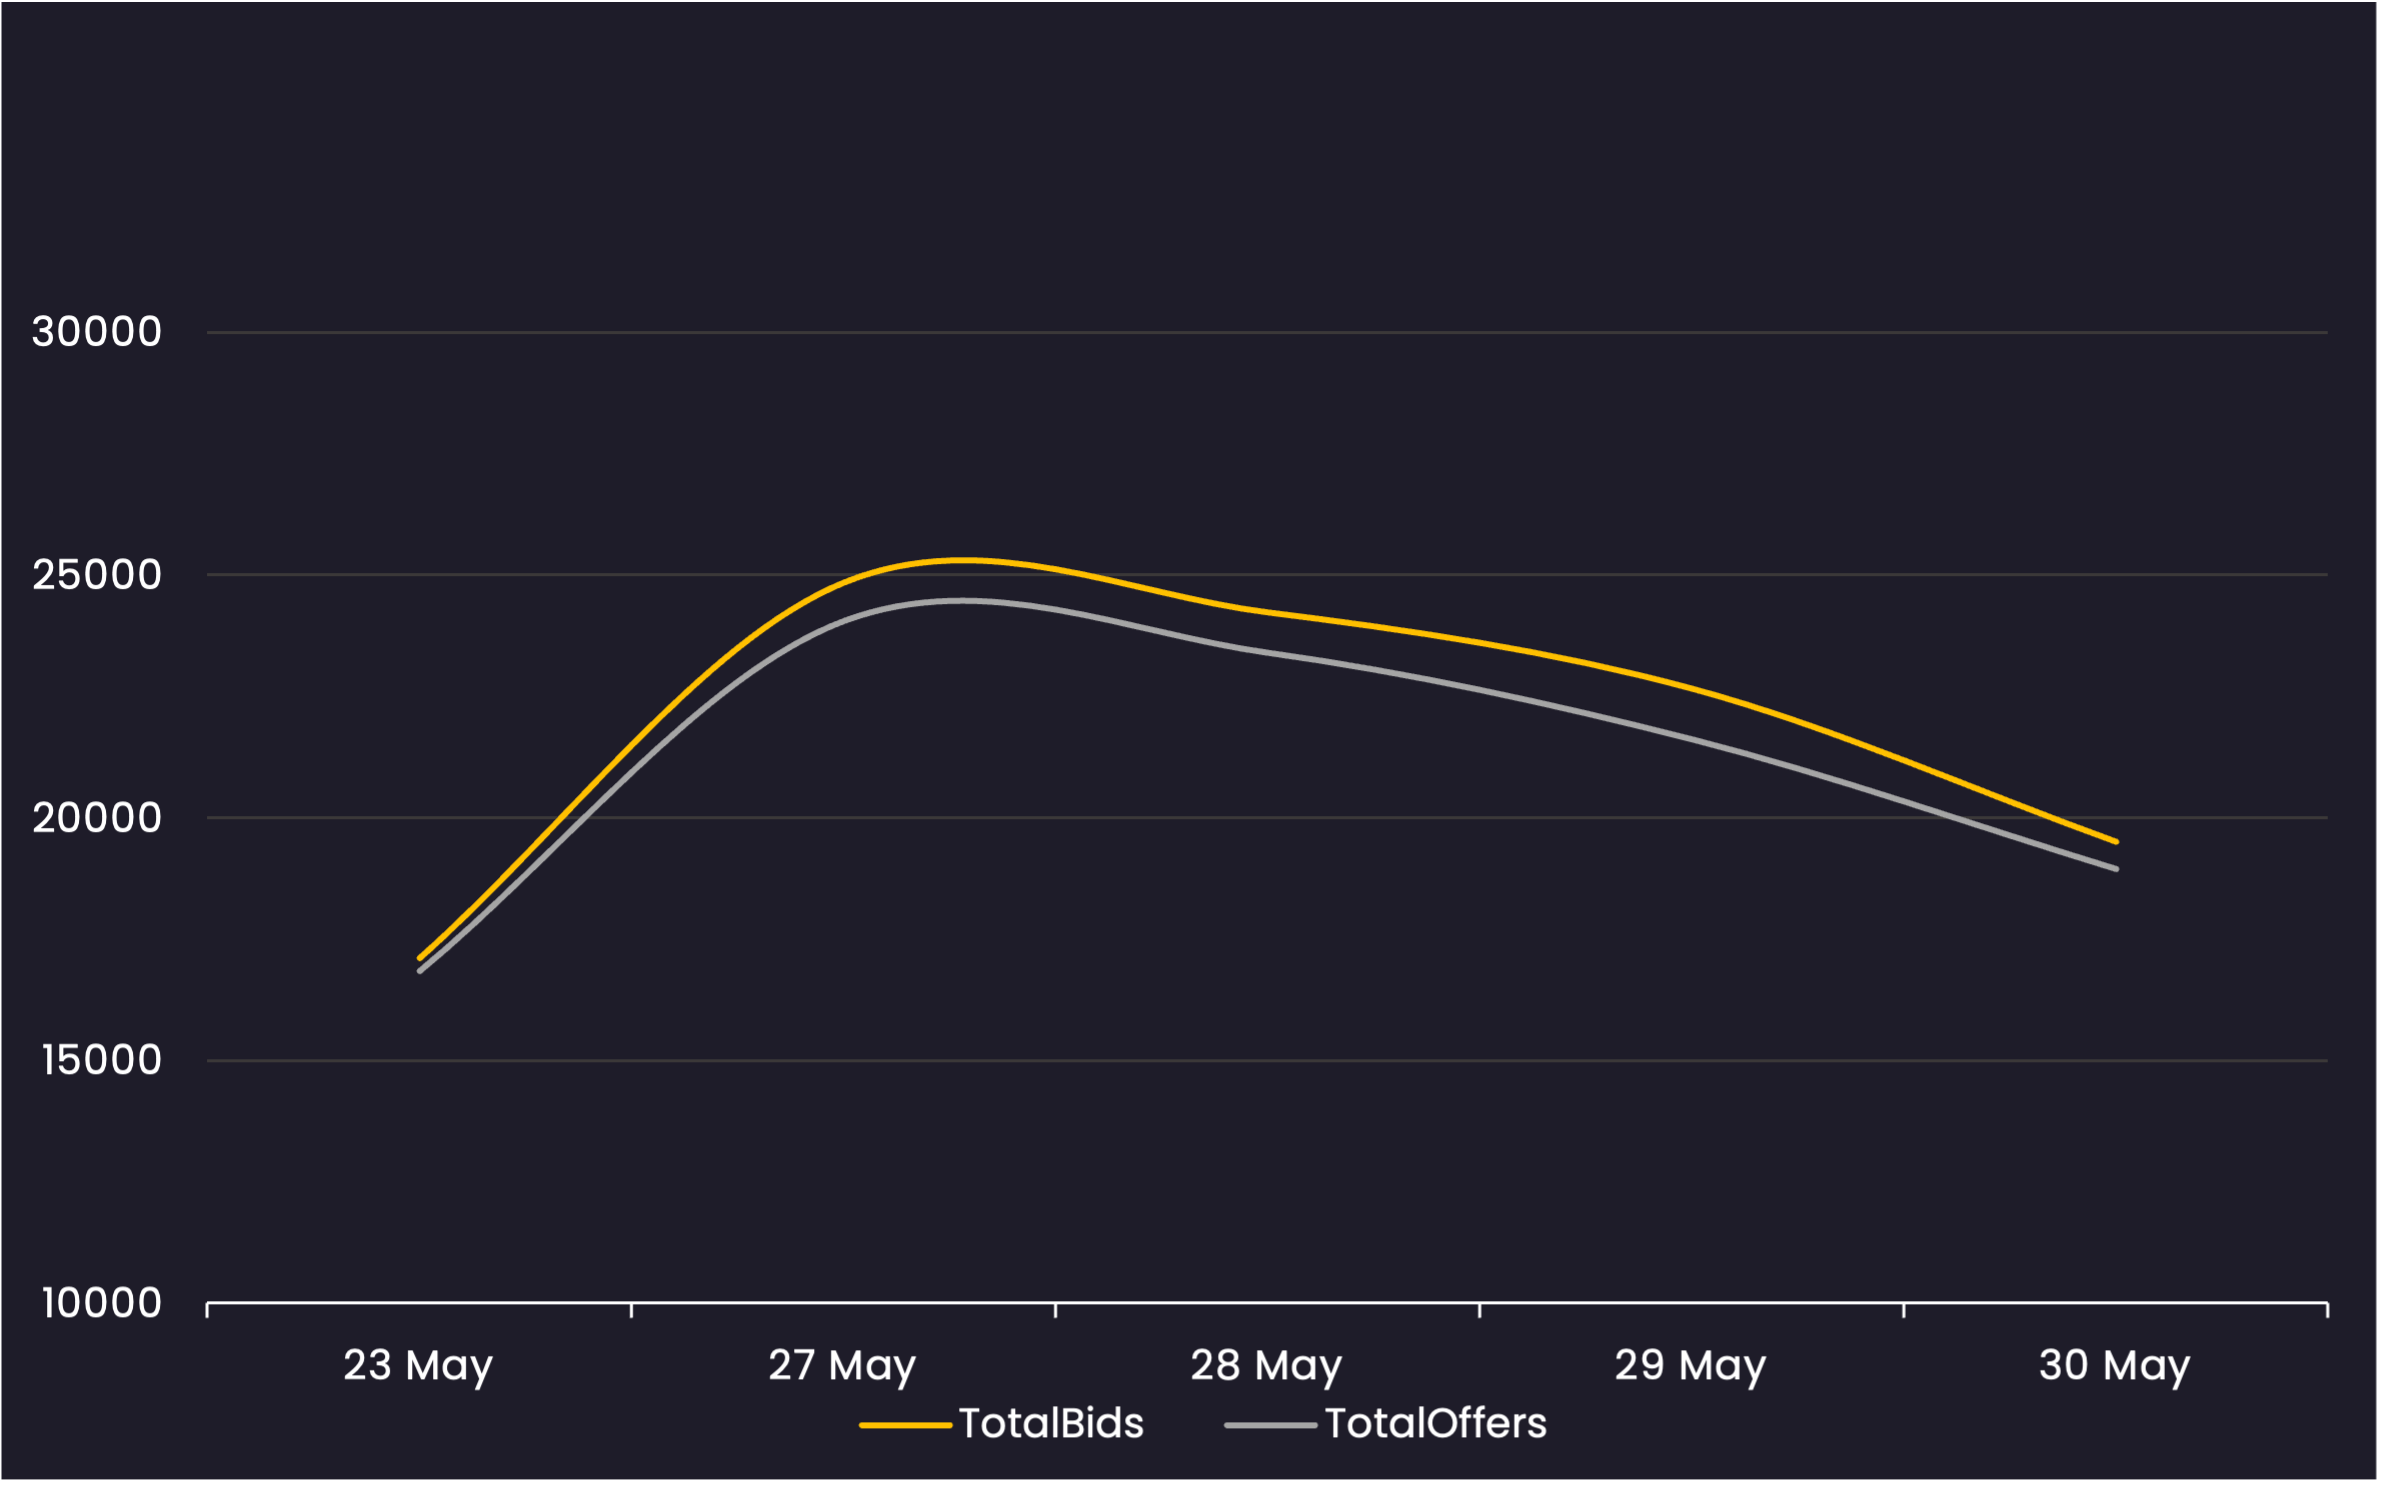
Bid and Offer Volume
Reveals the total number of quotes by bid and offer between 5/23/25-5/30/25
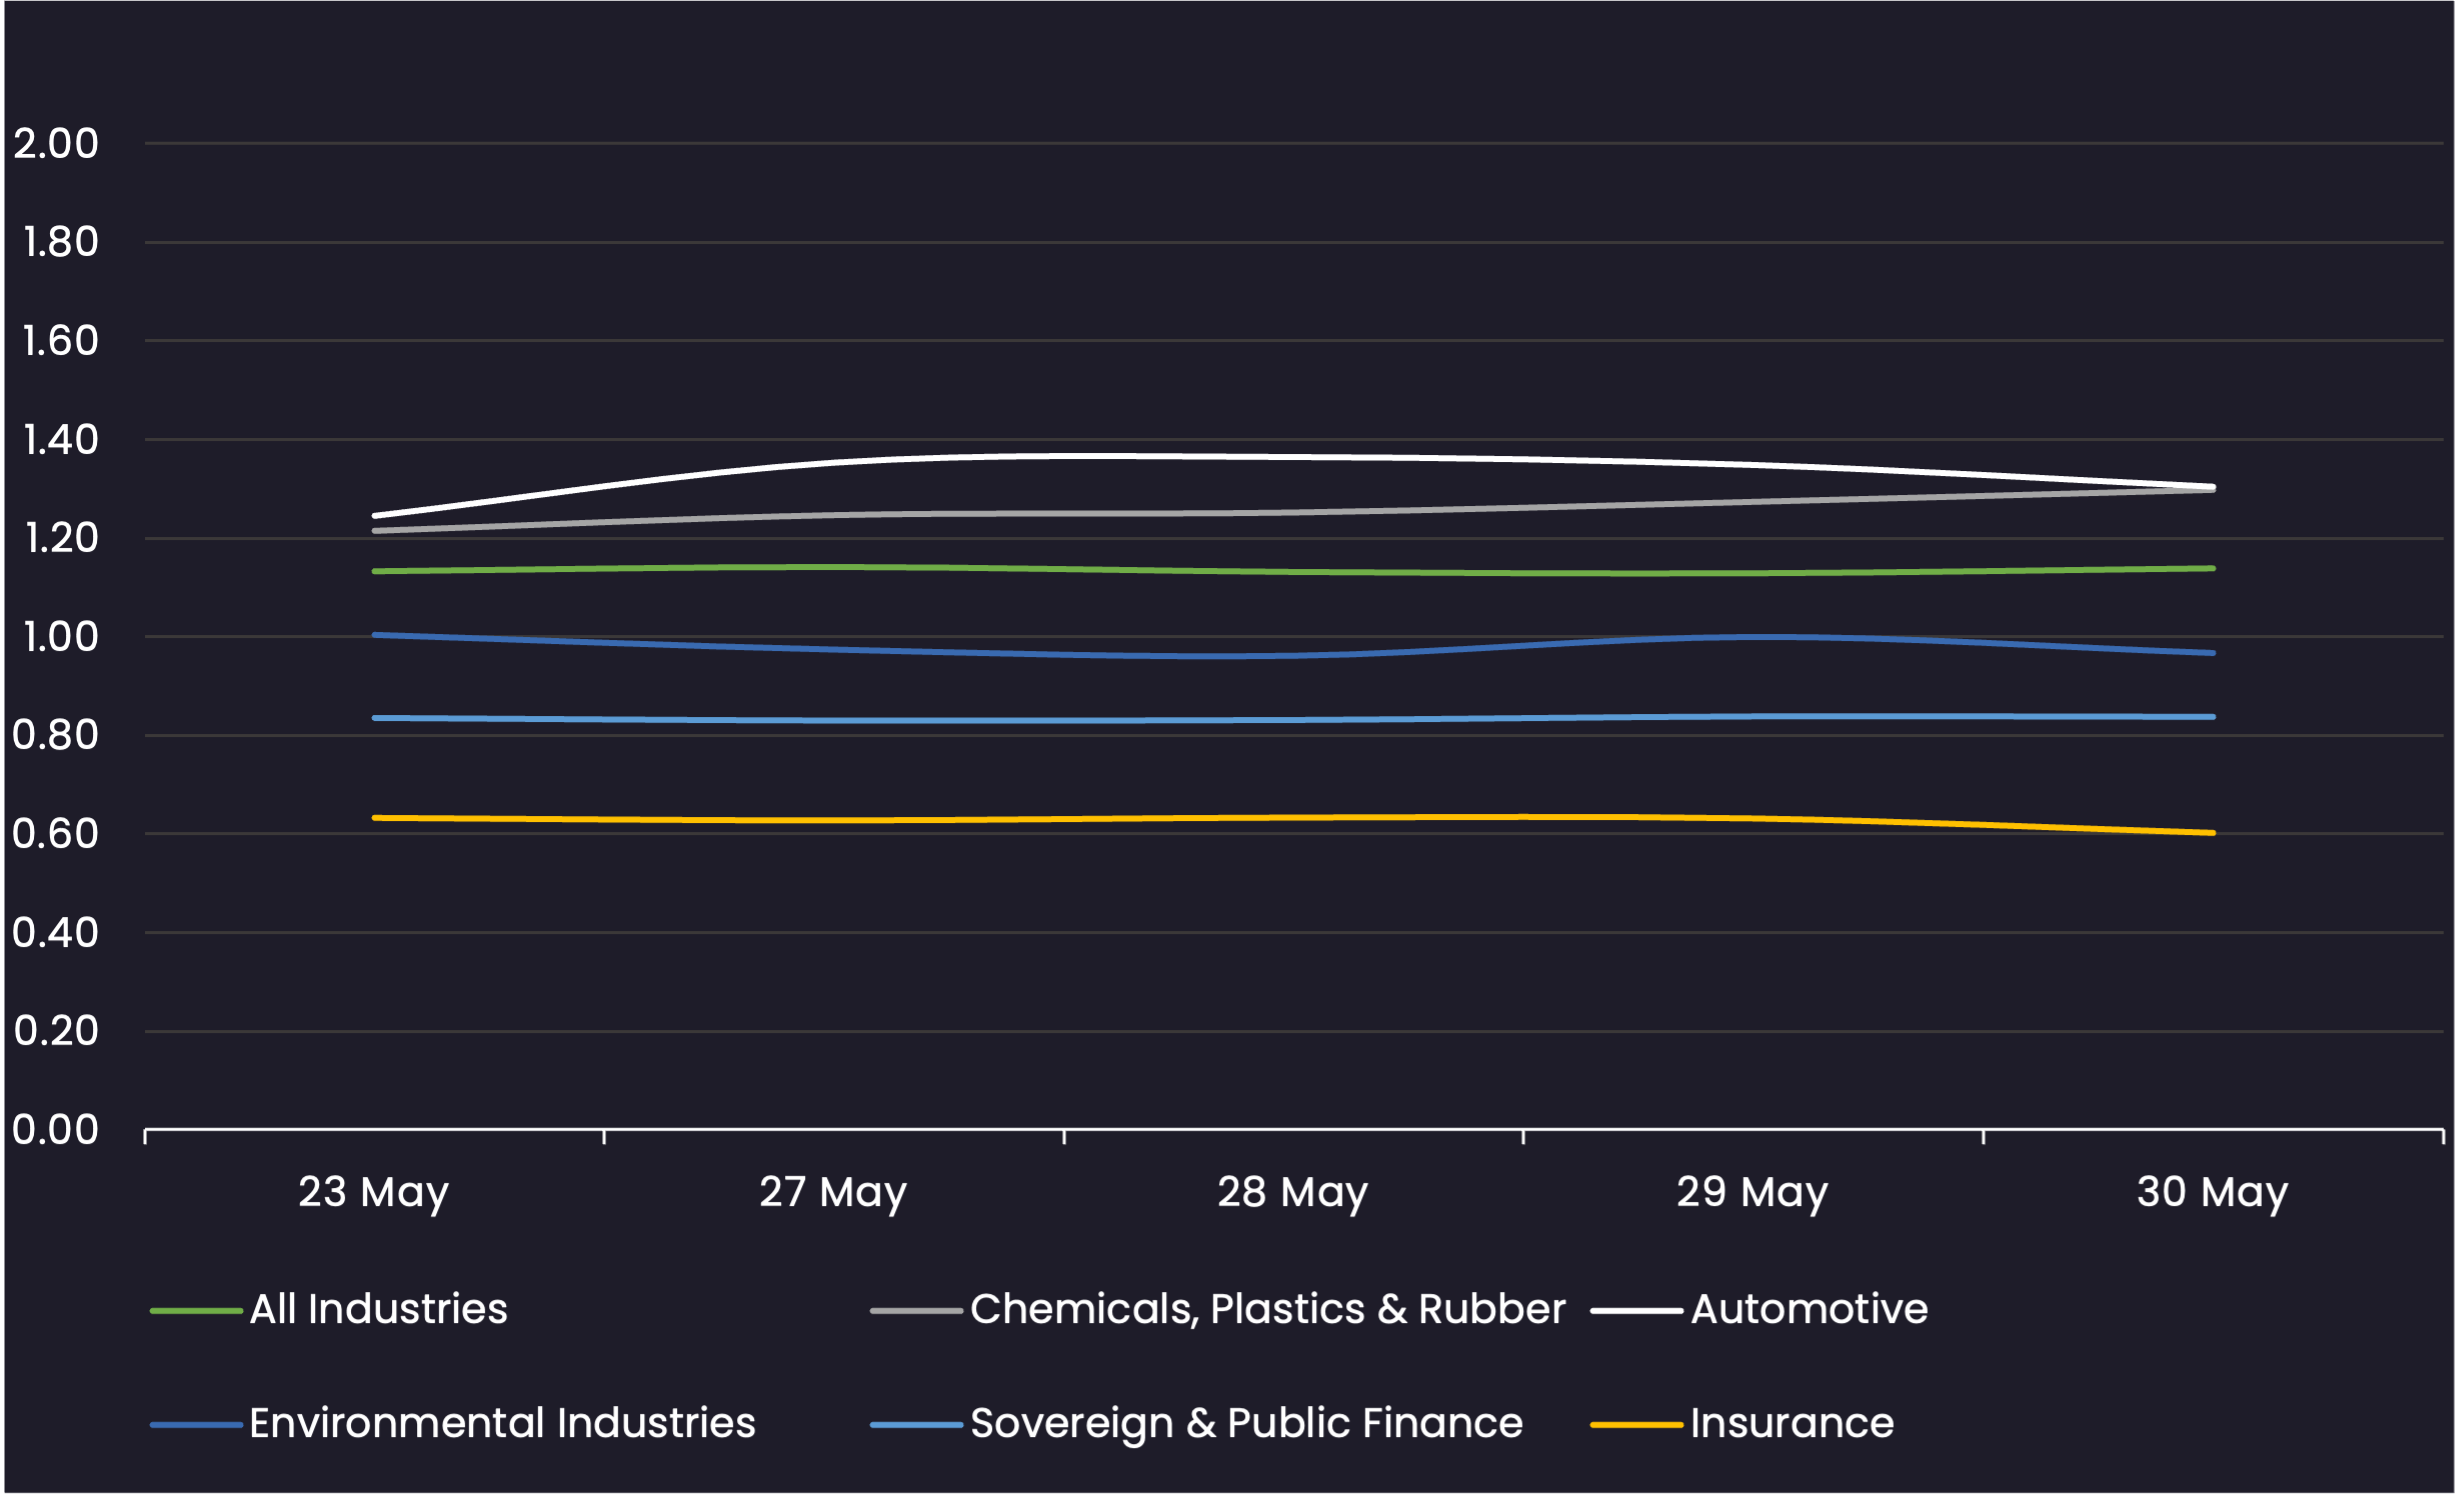
Sector Bid-Offer Spread
Results are based on 5 select industry sectors, however, we offer data across 36 sectors
Stay up-to-date with weekly summaries.
Related Resources
About SOLVE
SOLVE is the leading market data platform provider for fixed-income securities, trusted by sophisticated buy-side and sell-side firms worldwide. Founded in 2011, SOLVE leverages its AI-driven technology and deep industry expertise to offer unparalleled transparency into markets, reduce risk, and save hundreds of hours across front-office workflows. With the largest real-time datasets for Securitized Products, Municipal Bonds, Corporate Bonds, Syndicated Bank Loans, Convertible Bonds, CDS, and Private Credit, SOLVE empowers clients to transform the way they bring new securities to market, trade on secondary markets, and value highly illiquid securities. Headquartered in Connecticut, with offices across the globe, SOLVE is the definitive source for market pricing in fixed-income markets.
