Syndicated Bank Loan Market Summary – Week Ending 5/10/24
GET OUR BANK LOAN MARKET SUMMARIES STRAIGHT TO YOUR INBOX. LEARN MORE
Syndicated Bank Loan Market Summary: Week Ending 5/10/24
Our newsletter presents key trends derived from observable Syndicated Bank Loan pricing data over a weekly period.
New Issues
Loans issued during the week ending 5/10/24
| ISSUER | AMOUNT (MM) | LOAN TYPE | MATURITY | RATE |
|---|---|---|---|---|
| Waterbridge Operating LLC | Term Loan | 575 | 4/23/2029 | S+450 |
| Caesars Entertainment Inc. | Term Loan | 2475 | 2/1/2030 | S+275 |
| Alderwoods Group Inc. | Term Loan | 675 | 1/11/2028 | S+150 |
forward calendar
Forward calendar during the week ending 5/10/24
| Issuer | Deal Information | Banks | Expected Issue Date |
|---|---|---|---|
| Amwins Group Inc. | $839M TL | GS | Q2 2024 |
| Grant Thornton Advisors | $1.8B TLB | DB,BMO,JEFF,GLB,BofA,KKR | Q2 2024 |
| Lifepoint Health | $500M TLB | CITI,BCLY,JPM,MS, RBC | Q2 2024 |
Largest Loans
Highlights the weekly price movements and quote depth for the 20 largest bank loans between 5/3/24 – 5/10/24
| RANK | SIZE (MM) | NAME | CHANGE | PRC | PRC-1W | DEALERS |
|---|---|---|---|---|---|---|
| 1 | 6,143 | MEDLINE TL B | 0.23% | 100.58 | 100.35 | 15 |
| 2 | 5,385 | ULTIMATE SOFTWARE TL B | 0.18% | 100.77 | 100.58 | 14 |
| 3 | 4,860 | HUB INTL LTD TL B | 0.21% | 100.79 | 100.57 | 17 |
| 4 | 4,750 | ZAYO TL | -2.88% | 84.43 | 86.93 | 16 |
| 5 | 4,741 | INTERNET BRANDS TL B | 0.28% | 100.04 | 99.76 | 13 |
| 6 | 4,525 | TRANSDIGM INC. TL I | 0.18% | 100.71 | 100.53 | 17 |
| 7 | 4,260 | NUMERICABLE TL B14 | -0.02% | 74.15 | 74.16 | 10 |
| 8 | 4,050 | CITRIX TL B | 0.04% | 100.18 | 100.14 | 13 |
| 9 | 3,900 | DIRECTV TL | 0.27% | 100.68 | 100.41 | 18 |
| 10 | 3,580 | CDK GLOBAL TL B | 0.22% | 100.43 | 100.21 | 16 |
| 11 | 3,500 | SEDGWICK TL B | 0.09% | 100.54 | 100.45 | 11 |
| 12 | 3,500 | WESTINGHOUSE TL B | 0.31% | 100.46 | 100.15 | 15 |
| 13 | 3,500 | AMERICAN AIRLINES TL B | 0.22% | 104.26 | 104.04 | 14 |
| 14 | 3,420 | RCN GRANDE TL | -2.57% | 77.65 | 79.70 | 13 |
| 15 | 3,380 | SOLERA TL B | 0.43% | 99.94 | 99.51 | 16 |
| 16 | 3,350 | THE NIELSEN COMPANY B.V. TL B | 1.12% | 95.19 | 94.13 | 11 |
| 17 | 3,300 | NTL CABLE PLC TL N | 0.41% | 98.45 | 98.05 | 13 |
| 18 | 3,300 | NTL CABLE PLC TL N | 0.41% | 98.45 | 98.05 | 13 |
| 19 | 3,250 | CORELOGIC TL B | 1.41% | 98.75 | 97.38 | 10 |
| 20 | 3,242 | GOLDEN NUGGET INC TL B | 0.19% | 100.43 | 100.24 | 11 |
| AVERAGE | 3,997 | 0.04% | 96.84 | 96.77 | 13.8 |
Top 10 Performers
Showcases the top 10 loan performers based on the largest bid price increases between 5/3/24-5/10/24
| RANK | NAME | CHANGE | PRC | PRC-1W | DEALERS |
|---|---|---|---|---|---|
| 1 | SCIONHEALTH TL B | 11.90% | 44.00 | 39.32 | 3 |
| 2 | TRINSEO TL B | 8.57% | 75.48 | 69.53 | 12 |
| 3 | ANASTASIA BEVERLY HILLS TL B | 6.65% | 68.33 | 64.07 | 13 |
| 4 | TEAM HEALTH EXT TL B | 6.41% | 93.44 | 87.81 | 8 |
| 5 | MAGENTA BUYER LLC TL | 5.94% | 53.55 | 50.54 | 10 |
| 6 | EMBECTA TL B | 5.25% | 92.54 | 87.92 | 12 |
| 7 | ASURION 2ND LIEN TL B4 | 3.92% | 93.55 | 90.03 | 10 |
| 8 | MAVENIR TL B | 3.59% | 76.77 | 74.11 | 6 |
| 9 | SECTOR ALARM HOLDING EUR TL B1 | 2.88% | 98.14 | 95.40 | 14 |
| 10 | RESEARCH NOW TL | 2.82% | 63.75 | 62.00 | 11 |
Bottom 10 Perfromers
Showcases the bottom 10 loan performers based on the largest bid price decreases between 5/3/24-5/10/24
| RANK | NAME | CHANGE | PRC | PRC-1W | DEALERS |
|---|---|---|---|---|---|
| 1 | CORRECT CARE TL B | -6.21% | 72.35 | 77.13 | 11 |
| 2 | MULTIPLAN TL B | -5.63% | 86.90 | 92.09 | 10 |
| 3 | IHEART TL B | -4.91% | 83.20 | 87.49 | 8 |
| 4 | PETCO TL B | -4.40% | 81.65 | 85.41 | 17 |
| 5 | CISION TL B | -3.70% | 66.44 | 69.00 | 11 |
| 6 | COMMERCEHUB TL B | -3.51% | 94.03 | 97.45 | 9 |
| 7 | LIGHTPATH TL | -3.28% | 94.67 | 97.88 | 7 |
| 8 | RINCHEM TL | -3.15% | 84.89 | 87.65 | 7 |
| 9 | LANDESK TL B | -2.99% | 88.81 | 91.54 | 9 |
| 10 | ZAYO TL | -2.88% | 84.43 | 86.93 | 15 |
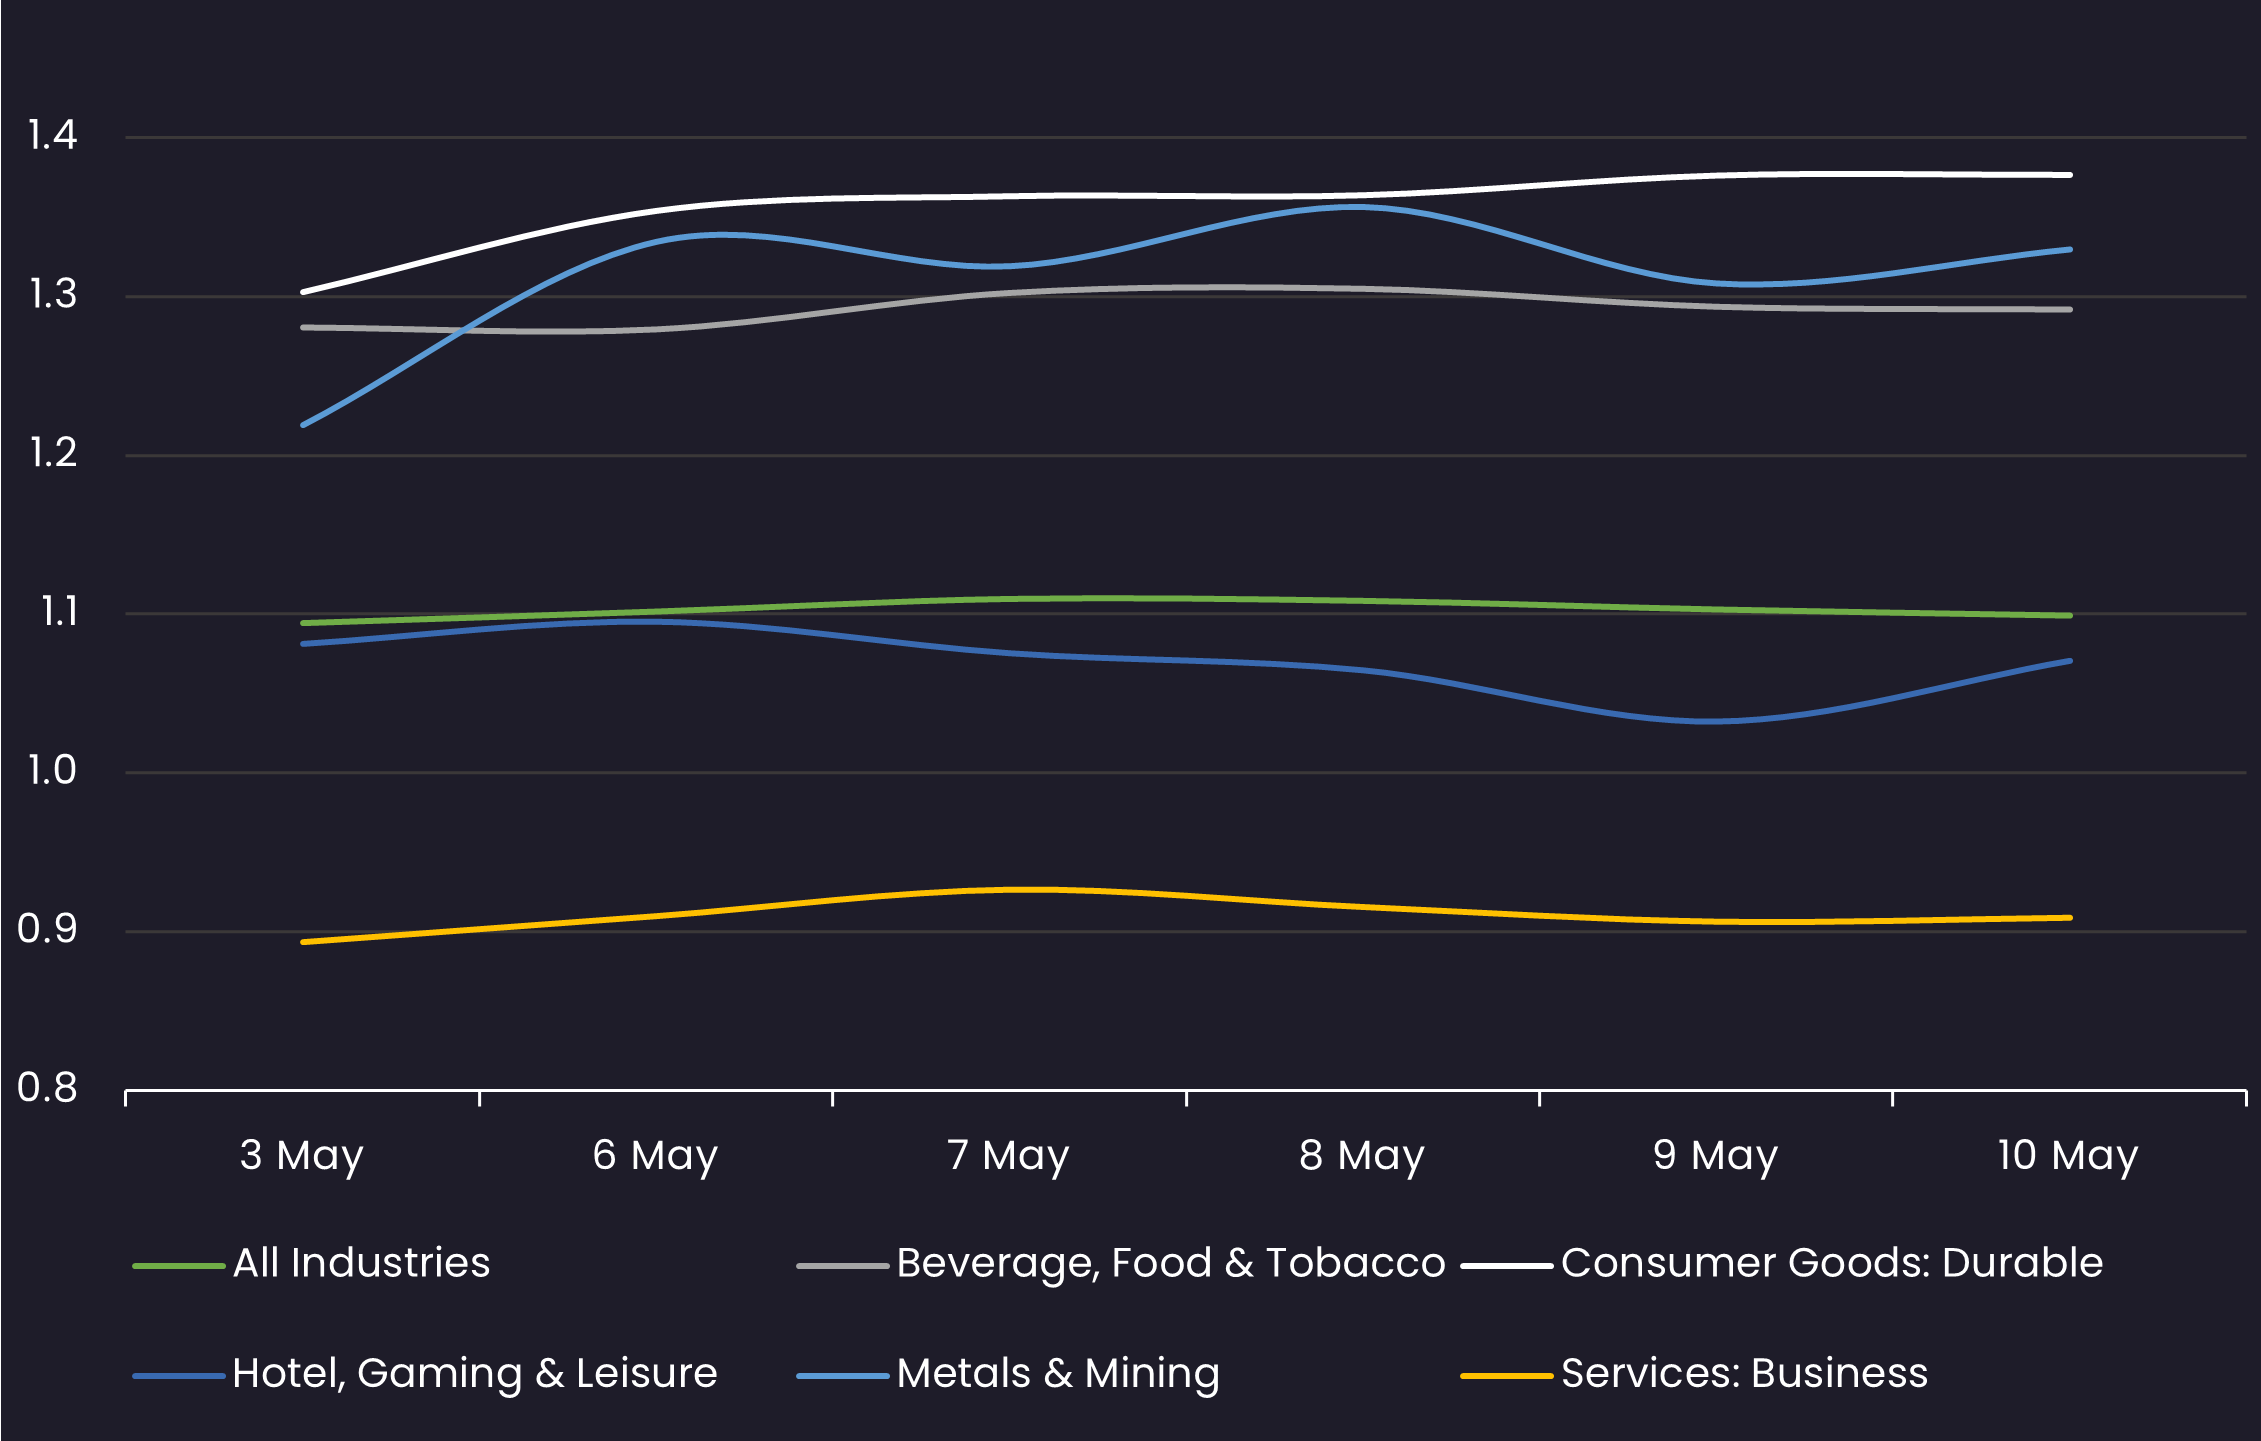
Avg Bid PX by Sector
Displays the average loan bid price by sector between 5/3/24-5/10/24 Results are based on 5 select industry sectors, however, we offer data across 36 sectors

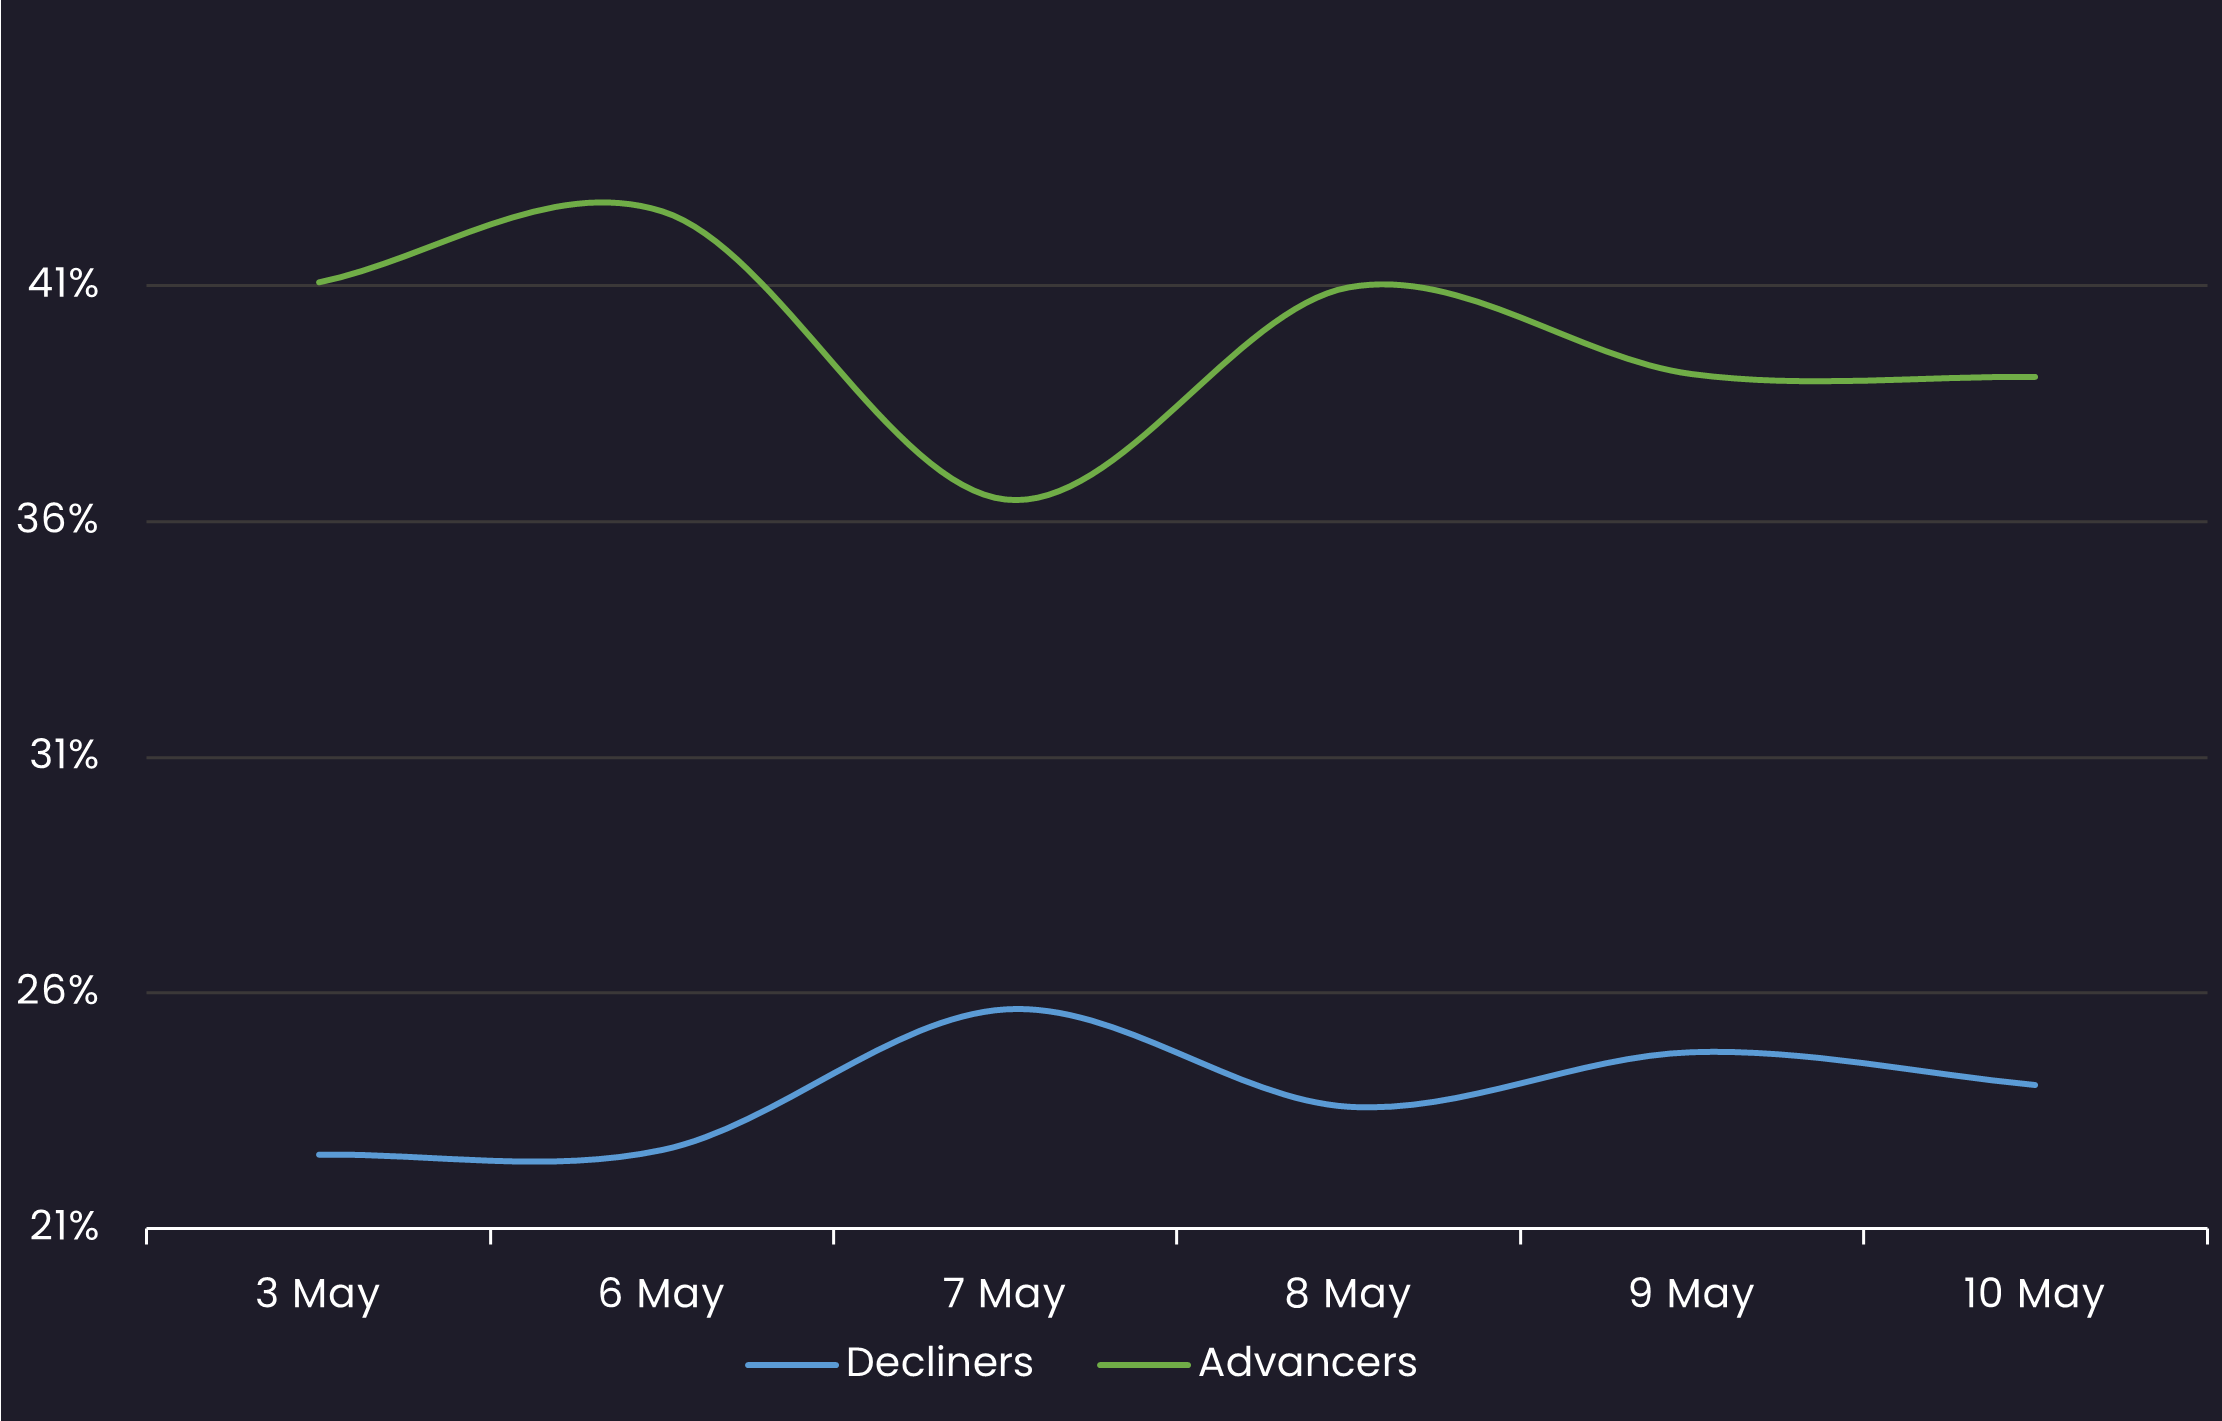
Sentiment
Reveals the percent of loans increasing in price (advancers) vs. loans decreasing in price (decliners) between 5/3/24-5/10/24
Top Quote Volume Movers: This Week vs Last Week
Exhibits the loans with the largest increase in quote volume for the week ending 5/3/24 vs. the week ending 5/10/24
| RANK | TRANCHE | PRIOR WEEK | THIS WEEK | INCREASE | % INCREASE |
|---|---|---|---|---|---|
| 1 | 1-800 CONTACTS TL | 18 | 58 | 40 | 222% |
| 2 | ALL 3 MEDIA TL B | 10 | 40 | 30 | 300% |
| 3 | JANUS INTERNATIONAL TL B | 16 | 46 | 30 | 188% |
| 4 | BEACON ROOFING TL B | 76 | 104 | 28 | 37% |
| 5 | AZZ INC TL B | 10 | 34 | 24 | 240% |
| 6 | ANCHOR PACKAGING TL B | 4 | 28 | 24 | 600% |
| 7 | US SILICA CO TL B | 7 | 31 | 24 | 343% |
| 8 | TRANSUNION TL B5 | 41 | 64 | 23 | 56% |
| 9 | STORABLE TL B | 10 | 32 | 22 | 220% |
| 10 | SELECT STAFFING TL B | 45 | 66 | 21 | 47% |
Most Quoted Loans
Ranks the loans that were quoted by the highest number of dealers between 5/3/24-5/10/24
| RANK | TRANCHE | DEALERS |
|---|---|---|
| 1 | TENNECO TL B | 19 |
| 2 | ALKEGEN TL B | 19 |
| 3 | FRONERI TL B | 19 |
| 4 | TRANSDIGM INC. TL J | 18 |
| 5 | BERRY PLASTICS TL | 18 |
| 6 | HILEX POLY TL B | 18 |
| 7 | GRAHAM PACKAGING TL B | 18 |
| 8 | REYNOLDS GROUP HOLDINGS LIMITED TL B3 | 18 |
| 9 | DIRECTV TL | 18 |
| 10 | HUB INTL LTD TL B | 17 |
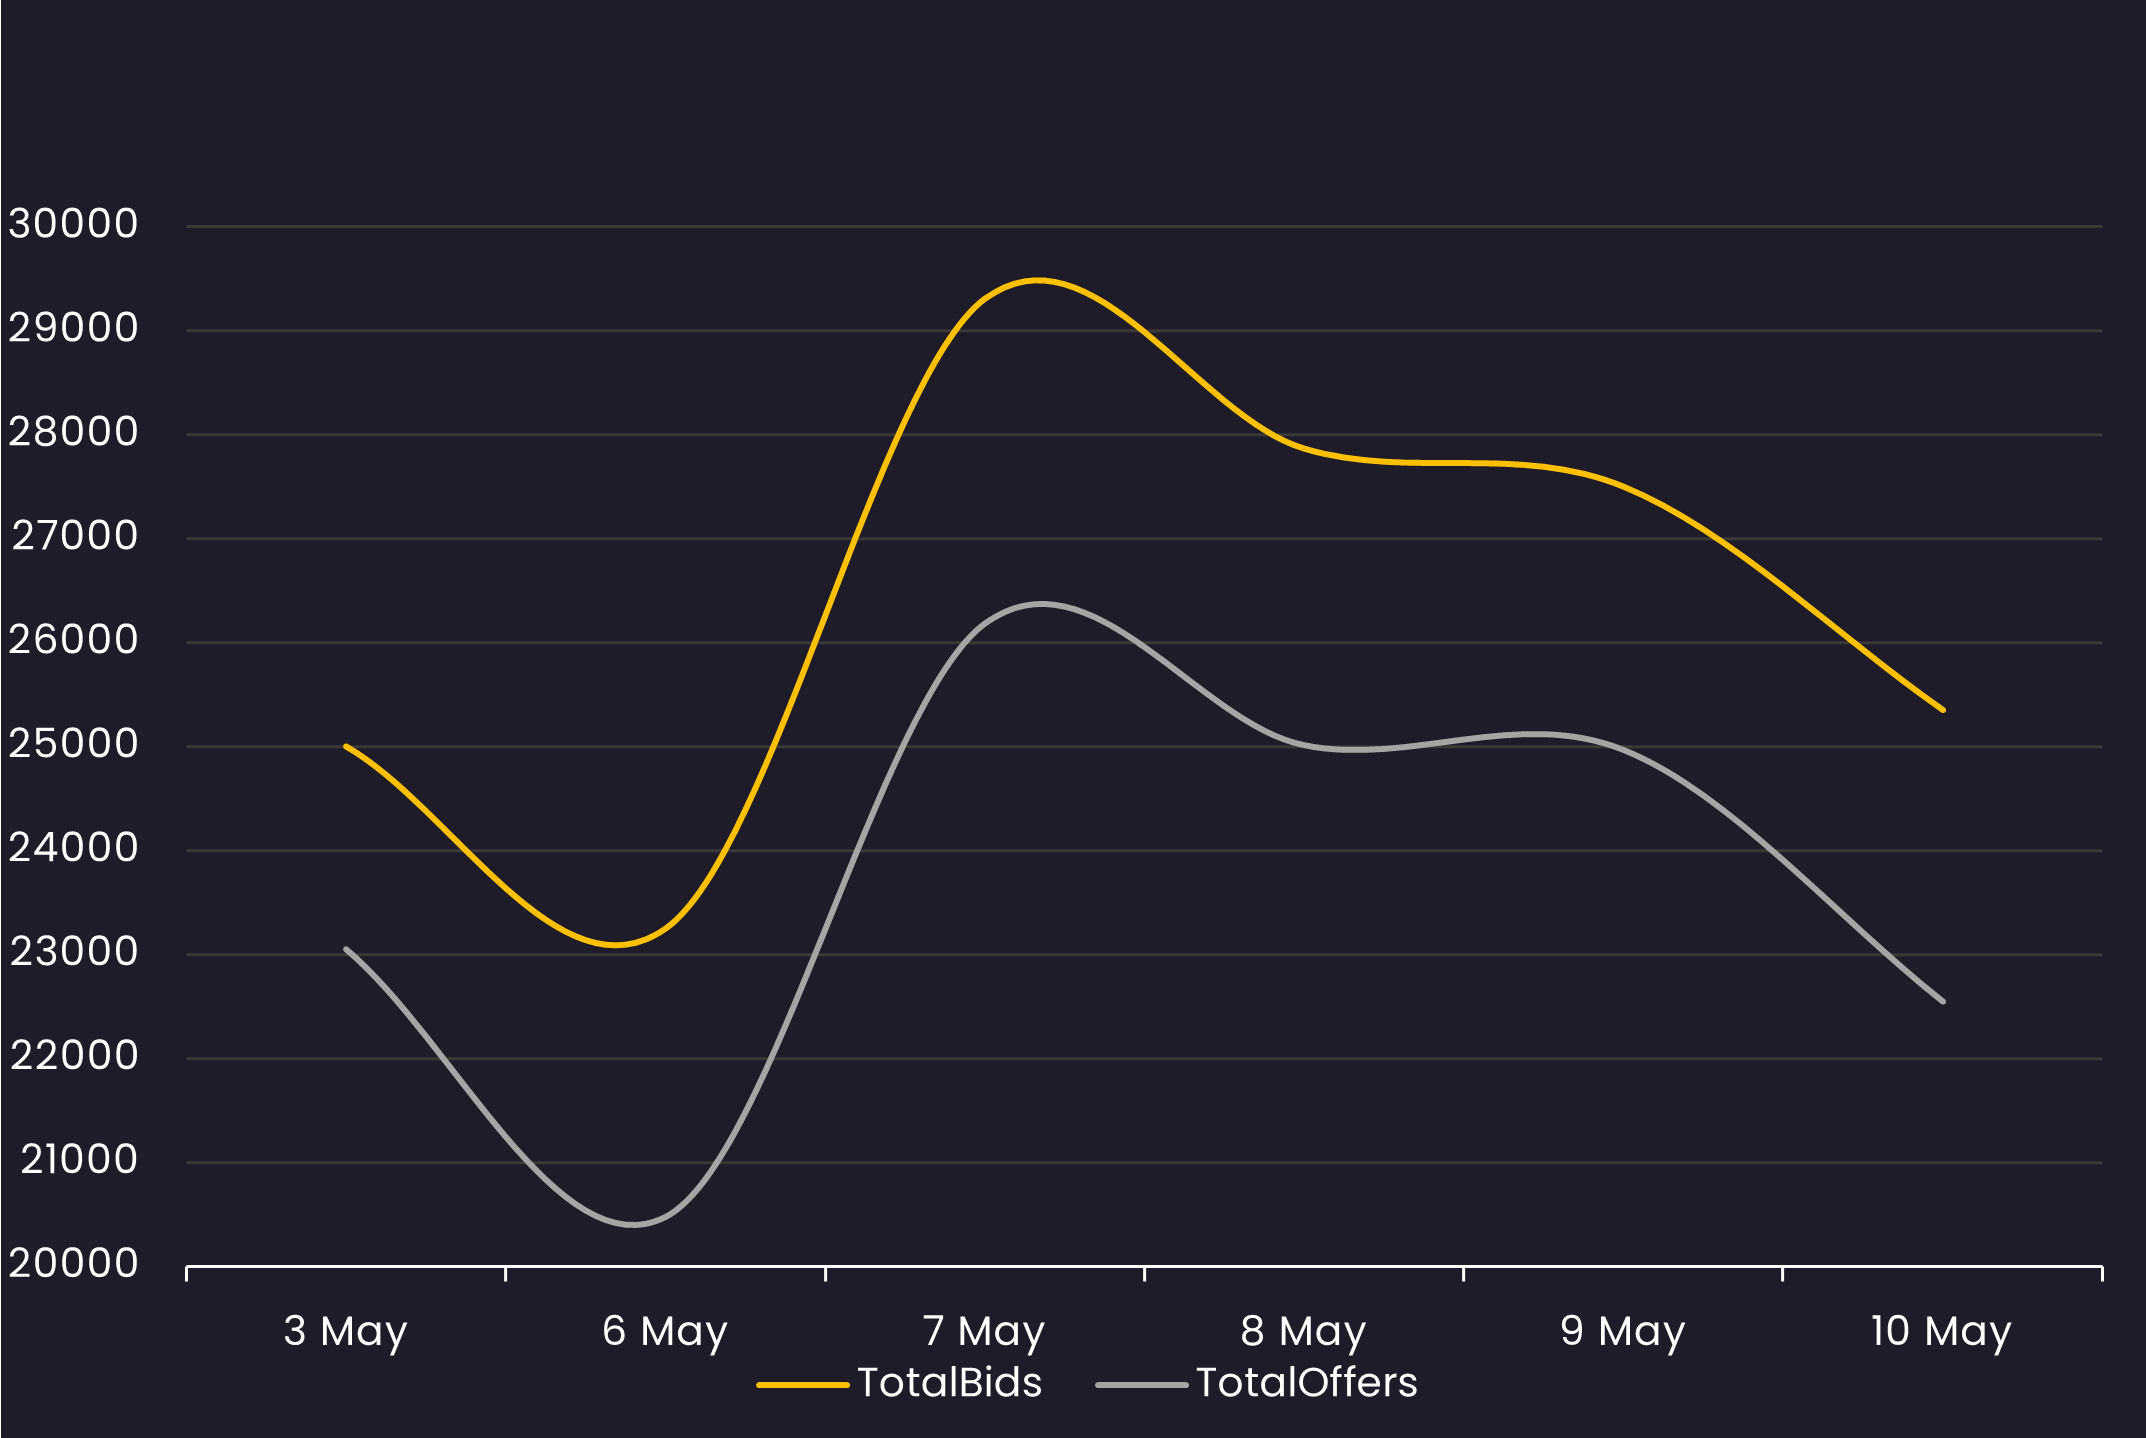
Bid and Offer Volume
Reveals the total number of quotes by bid and offer between 5/3/24-5/10/24
Sector Bid-Offer Spread
Results are based on 5 select industry sectors, however, we offer data across 36 sectors
Stay up-to-date with weekly summaries.
Related Resources
About SOLVE
SOLVE is the leading market data platform provider for fixed-income securities, trusted by sophisticated buy-side and sell-side firms worldwide. Founded in 2011, SOLVE leverages its AI-driven technology and deep industry expertise to offer unparalleled transparency into markets, reduce risk, and save hundreds of hours across front-office workflows. With the largest real-time datasets for Securitized Products, Municipal Bonds, Corporate Bonds, Syndicated Bank Loans, Convertible Bonds, CDS, and Private Credit, SOLVE empowers clients to transform the way they bring new securities to market, trade on secondary markets, and value highly illiquid securities. Headquartered in Connecticut, with offices across the globe, SOLVE is the definitive source for market pricing in fixed-income markets.
