Syndicated Bank Loan Market Summary – Week Ending 5/3/24
GET OUR BANK LOAN MARKET SUMMARIES STRAIGHT TO YOUR INBOX. LEARN MORE
Syndicated Bank Loan Market Summary: Week Ending 5/3/24
Our newsletter presents key trends derived from observable Syndicated Bank Loan pricing data over a weekly period.
New Issues
Loans issued during the week ending 5/3/24
| ISSUER | AMOUNT (MM) | LOAN TYPE | MATURITY | RATE |
|---|---|---|---|---|
| Aspect Software Inc. | Term Loan | 39 | 5/5/2028 | S+600 |
| Avantor Performance Materials Holdings Inc. | Term Loan | 772 | 11/8/2027 | S+200 |
| Supplyone Inc. | Term Loan | 795 | 3/20/2031 | S+425 |
forward calendar
Forward calendar during the week ending 5/3/24
| Issuer | Deal Information | Banks | Expected Issue Date |
|---|---|---|---|
| Caesars Entertainment Inc. | $2.475B | JPM | Q2 2024 |
| Cornerstone Building Brands Inc. | $500MM TLB (B2/B) | DB | Q2 2024 |
| Grant Thornton Advisors | $1.8B TLB | DB,BMO,JEFF,GLB,BofA,KKR | Q2 2024 |
Largest Loans
Highlights the weekly price movements and quote depth for the 20 largest bank loans between 4/26/24 – 5/3/24
| RANK | SIZE (MM) | NAME | CHANGE | PRC | PRC-1W | DEALERS |
|---|---|---|---|---|---|---|
| 1 | 4,750 | ZAYO TL | 0.94% | 86.93 | 86.13 | 15 |
| 2 | 3,900 | DIRECTV TL | 0.08% | 100.41 | 100.32 | 17 |
| 3 | 3,500 | AMERICAN AIRLINES TL B | 0.19% | 104.04 | 103.84 | 14 |
| 4 | 3,300 | NTL CABLE PLC TL N | 0.01% | 98.05 | 98.04 | 13 |
| 5 | 3,300 | NTL CABLE PLC TL N | 0.01% | 98.05 | 98.04 | 13 |
| 6 | 3,100 | ASURION TL B8 | 0.21% | 97.80 | 97.60 | 10 |
| 7 | 2,985 | HARBOR FREIGHT TL B | 0.10% | 100.16 | 100.06 | 15 |
| 8 | 2,800 | ASURION 2ND LIEN TL B4 | 0.22% | 90.03 | 89.83 | 10 |
| 9 | 2,670 | FRONERI TL B | 0.11% | 100.14 | 100.03 | 18 |
| 10 | 2,550 | GENESEE & WYOMING TL | 0.00% | 100.00 | 100.00 | 13 |
| 11 | 2,525 | ZIGGO TL I | 0.28% | 98.81 | 98.53 | 13 |
| 12 | 2,500 | GRIFOLS WORLDWIDE TL B | 0.62% | 98.18 | 97.57 | 12 |
| 13 | 2,295 | TELENET TL | 0.20% | 96.14 | 95.95 | 11 |
| 14 | 2,250 | ZIGGO EUR TL H | 0.21% | 97.90 | 97.69 | 16 |
| 15 | 2,192 | UNIVERSAL SERVICES TL B | 0.16% | 100.14 | 99.98 | 11 |
| 16 | 2,190 | SRS DISTRIBUTION TL B | 0.01% | 100.67 | 100.66 | 11 |
| 17 | 2,180 | FRONERI EUR TL B | -0.20% | 99.46 | 99.65 | 13 |
| 18 | 2,105 | STADA ARZNEIMITTEL EUR TL F | -0.08% | 99.64 | 99.72 | 14 |
| 19 | 2,000 | STAPLES TL B1 | -0.54% | 98.26 | 98.79 | 14 |
| 20 | 2,000 | VERISURE EUR TL B | 0.21% | 99.74 | 99.53 | 15 |
| AVERAGE | 2,755 | 0.14% | 98.23 | 98.10 | 13.4 |
Top 10 Performers
Showcases the top 10 loan performers based on the largest bid price increases between 4/26/24-5/3/24
| RANK | NAME | CHANGE | PRC | PRC-1W | DEALERS |
|---|---|---|---|---|---|
| 1 | WEIGHT WATCHERS TL B | 15.62% | 48.66 | 42.08 | 11 |
| 2 | DUPAGE MEDICAL GROUP TL B | 14.77% | 82.81 | 72.15 | 9 |
| 3 | PEDIATRIC ASSOCIATES TL B | 8.94% | 95.71 | 87.86 | 9 |
| 4 | ANVIL INTERNATIONAL 2ND LIEN TL | 6.96% | 91.10 | 85.17 | 5 |
| 5 | EOS US FINCO LLC TL B | 4.73% | 73.60 | 70.28 | 10 |
| 6 | KLOECKNER TL B | 4.14% | 90.13 | 86.55 | 12 |
| 7 | QUORUM HEALTH EXIT TL | 4.06% | 67.78 | 65.14 | 4 |
| 8 | SABRE TL B | 3.65% | 90.05 | 86.88 | 6 |
| 9 | TROPICANA TL | 3.33% | 96.54 | 93.42 | 12 |
| 10 | AT HOME STORES TL B | 3.30% | 53.79 | 52.07 | 6 |
Bottom 10 Perfromers
Showcases the bottom 10 loan performers based on the largest bid price decreases between 4/26/24-5/3/24
| RANK | NAME | CHANGE | PRC | PRC-1W | DEALERS |
|---|---|---|---|---|---|
| 1 | SANDVINE TL | -13.50% | 23.46 | 27.13 | 12 |
| 2 | RUNNER BUYER TL B | -12.53% | 61.14 | 69.90 | 10 |
| 3 | ANASTASIA BEVERLY HILLS TL B | -10.00% | 64.07 | 71.19 | 12 |
| 4 | SITEL LLC / SITEL FIN CORP TL B | -7.76% | 70.93 | 76.89 | 10 |
| 5 | EMPIRE TODAY TL | -5.91% | 70.64 | 75.08 | 11 |
| 6 | NTHRIVE TL B | -5.19% | 79.51 | 83.86 | 6 |
| 7 | CABLEVISION TL B5 | -4.99% | 83.22 | 87.59 | 8 |
| 8 | MEDICAL SOLUTIONS TL | -4.87% | 84.32 | 88.63 | 9 |
| 9 | FRANCHISE GROUP TL B | -4.32% | 81.30 | 84.97 | 7 |
| 10 | USS PARENT TL B | -3.77% | 67.50 | 70.15 | 16 |
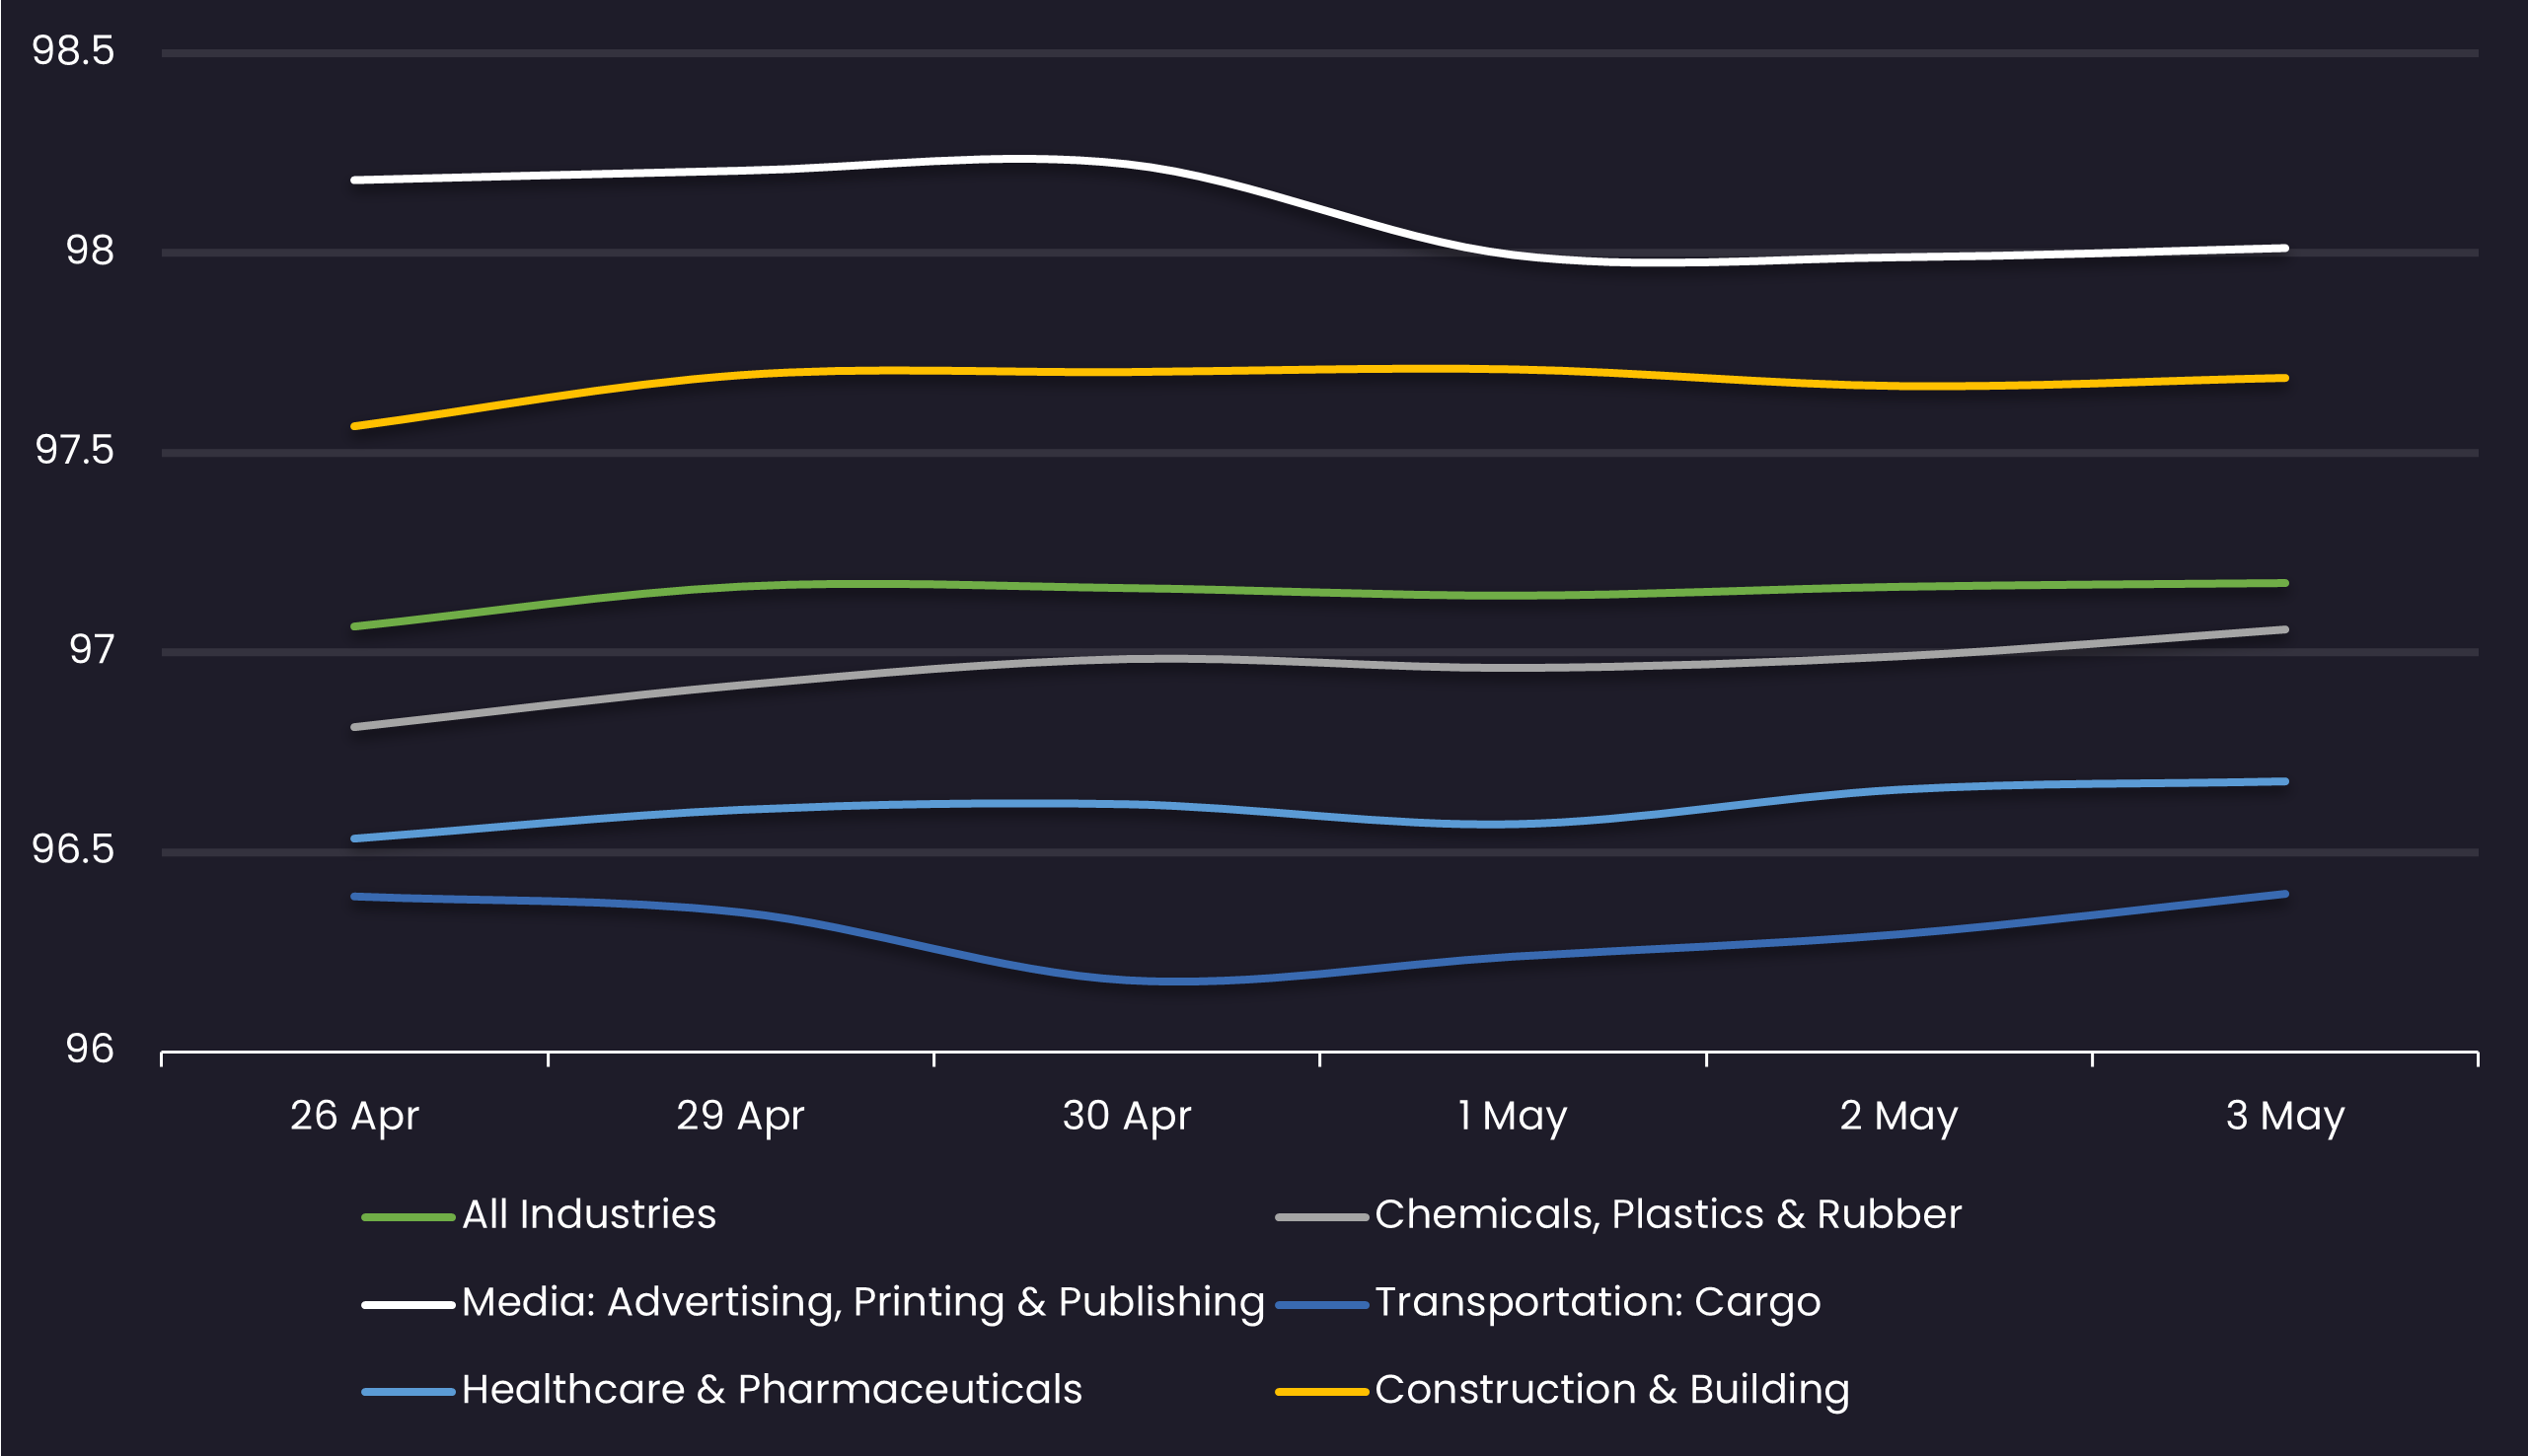
Avg Bid PX by Sector
Displays the average loan bid price by sector between 4/26/24-5/3/24 Results are based on 5 select industry sectors, however, we offer data across 36 sectors
Sentiment
Reveals the percent of loans increasing in price (advancers) vs. loans decreasing in price (decliners) between 4/26/24-5/3/24

Top Quote Volume Movers: This Week vs Last Week
Exhibits the loans with the largest increase in quote volume for the week ending 4/26/24 vs. the week ending 5/3/24
| RANK | TRANCHE | PRIOR WEEK | THIS WEEK | INCREASE | % INCREASE |
|---|---|---|---|---|---|
| 1 | BISON MIDSTREAM TL B | 12 | 44 | 32 | 267% |
| 2 | SURGEY CENTER TL | 64 | 95 | 31 | 48% |
| 3 | ICP GROUP 2ND LIEN TL | 0 | 28 | 28 | NA |
| 4 | CONSTELLIS HOLDINGS LLC 2ND LIEN TL | 0 | 28 | 28 | NA |
| 5 | REGIONALCARE HOSPITAL PARTNERS TL B | 24 | 48 | 24 | 100% |
| 6 | GRAHAM PACKAGING TL B | 101 | 125 | 24 | 24% |
| 7 | EPIC HEALTH TL B | 44 | 68 | 24 | 55% |
| 8 | SPRINGS WINDOW TL B | 56 | 78 | 22 | 39% |
| 9 | SOLENIS TL B | 48 | 70 | 22 | 46% |
| 10 | PAREXEL INTERNATIONAL TL | 73 | 94 | 21 | 29% |
Most Quoted Loans
Ranks the loans that were quoted by the highest number of dealers between 4/26/24-5/3/24
| RANK | TRANCHE | DEALERS |
|---|---|---|
| 1 | TENNECO TL B | 19 |
| 2 | TRANSDIGM INC. TL J | 18 |
| 3 | ALKEGEN TL B | 18 |
| 4 | FRONERI TL B | 18 |
| 5 | GRAHAM PACKAGING TL B | 18 |
| 6 | DIRECTV TL | 18 |
| 7 | REYNOLDS GROUP HOLDINGS LIMITED TL B3 | 18 |
| 8 | HILEX POLY TL B | 17 |
| 9 | BERRY PLASTICS TL | 17 |
| 10 | BMC SOFTWARE TL B | 17 |
Bid and Offer Volume
Reveals the total number of quotes by bid and offer between 4/26/24-5/3/24

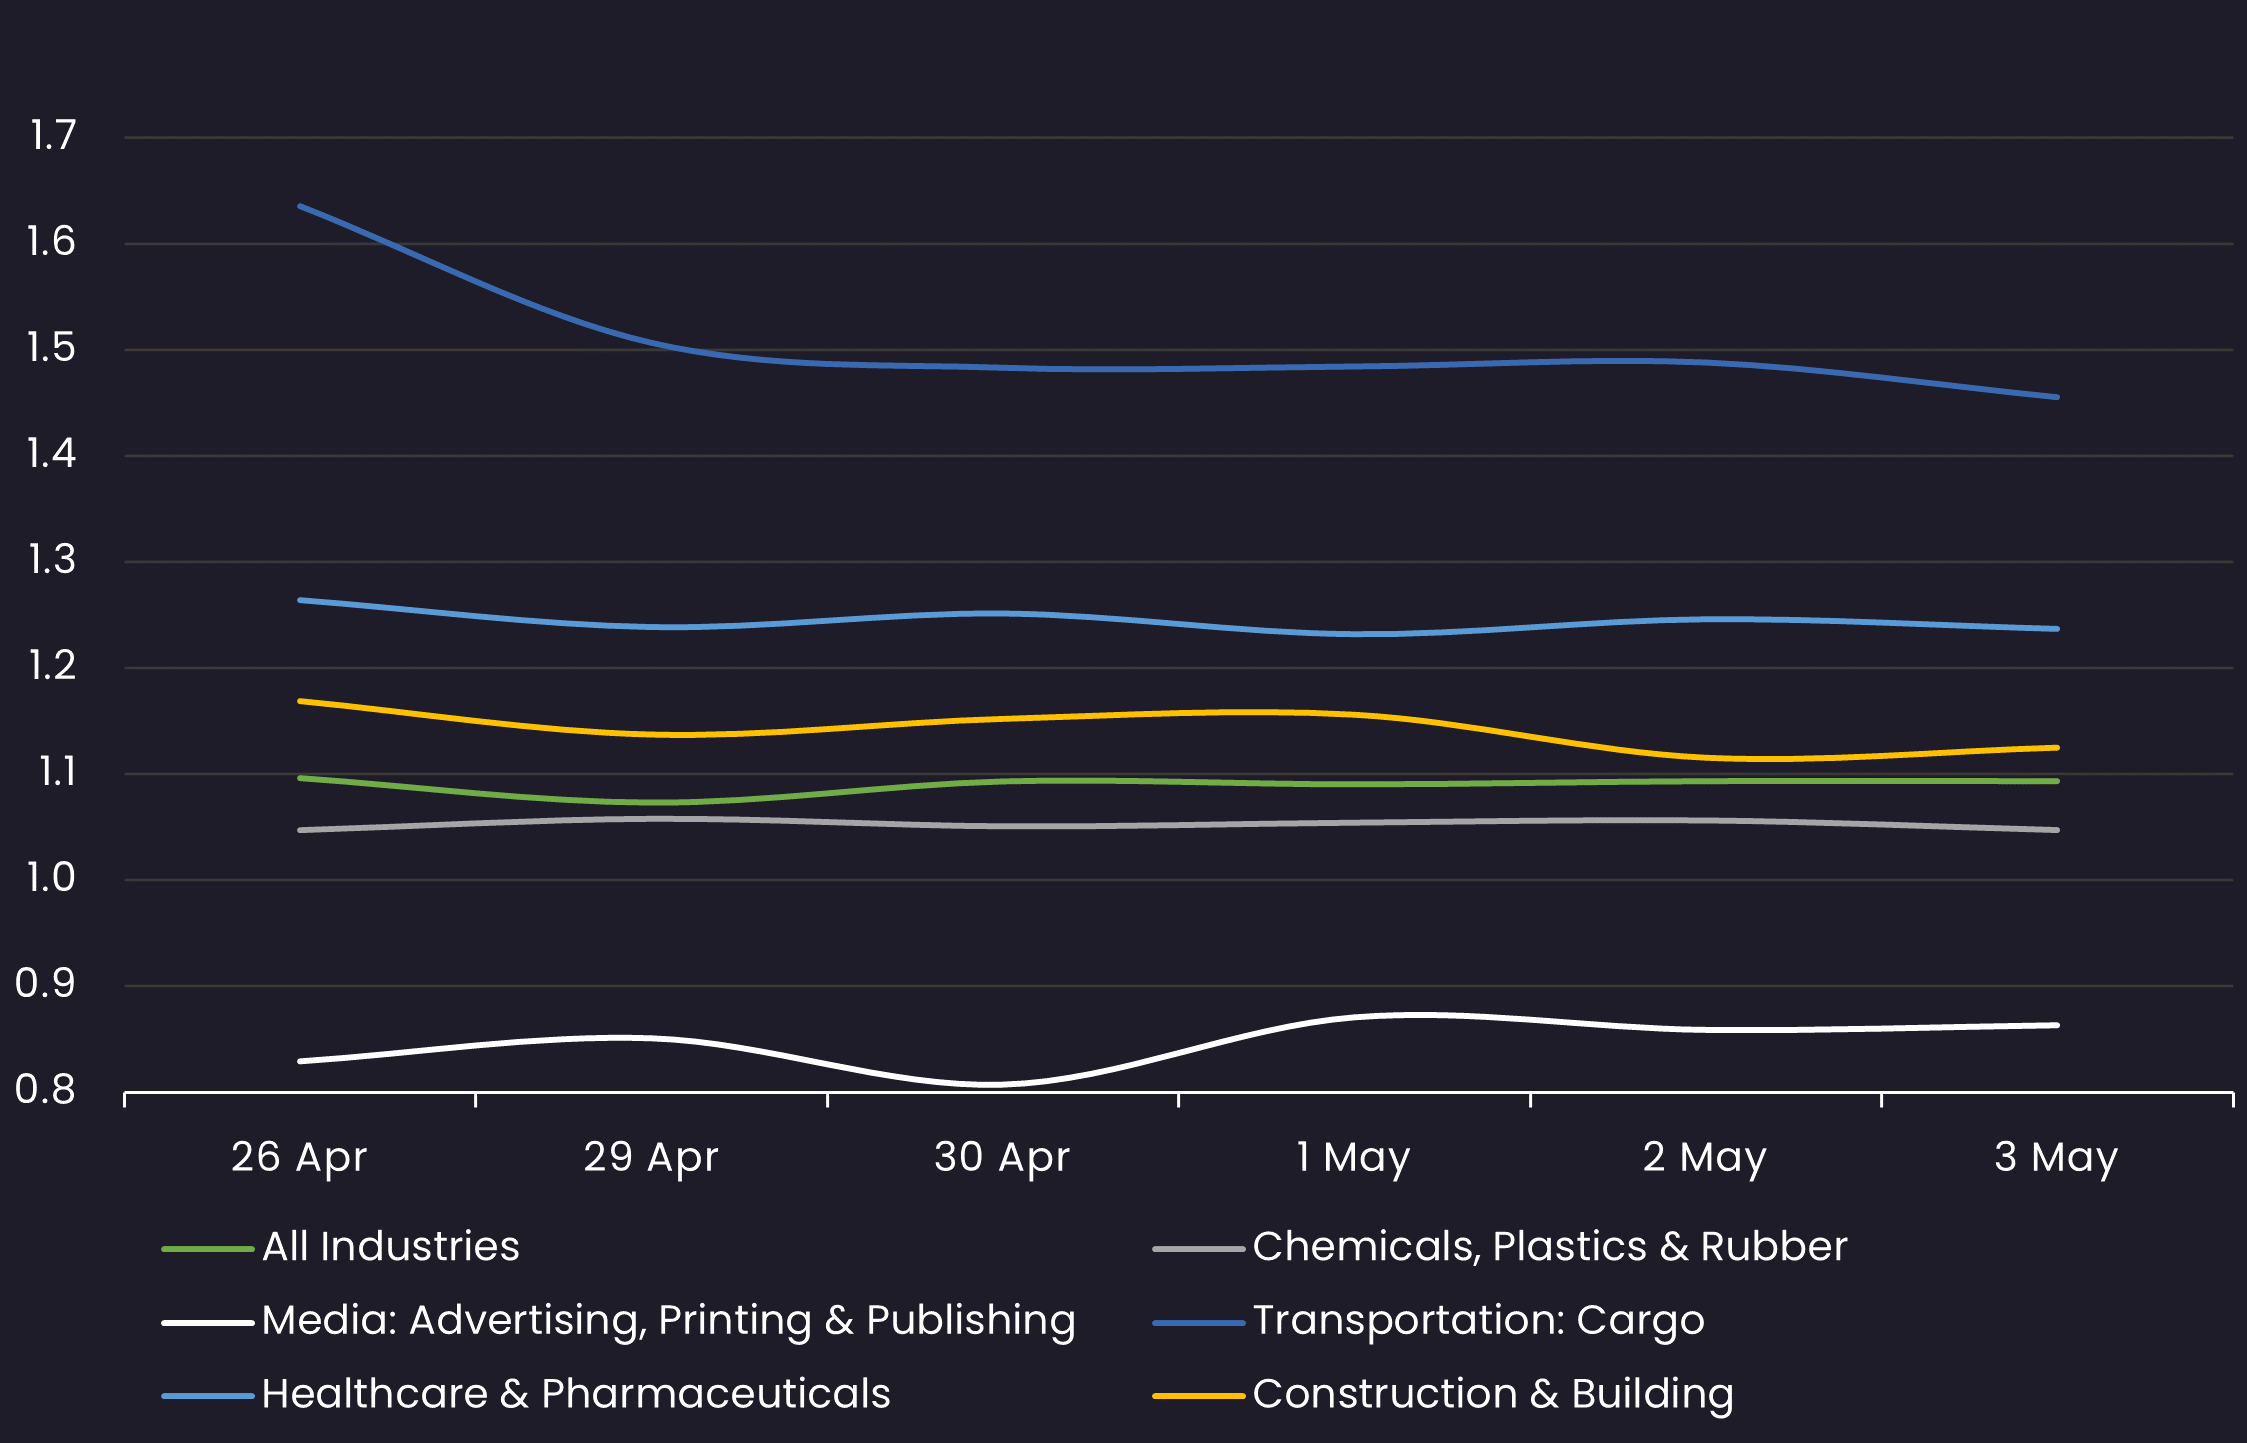
Sector Bid-Offer Spread
Results are based on 5 select industry sectors, however, we offer data across 36 sectors
Stay up-to-date with weekly summaries.
Related Resources
About SOLVE
SOLVE is the leading market data platform provider for fixed-income securities, trusted by sophisticated buy-side and sell-side firms worldwide. Founded in 2011, SOLVE leverages its AI-driven technology and deep industry expertise to offer unparalleled transparency into markets, reduce risk, and save hundreds of hours across front-office workflows. With the largest real-time datasets for Securitized Products, Municipal Bonds, Corporate Bonds, Syndicated Bank Loans, Convertible Bonds, CDS, and Private Credit, SOLVE empowers clients to transform the way they bring new securities to market, trade on secondary markets, and value highly illiquid securities. Headquartered in Connecticut, with offices across the globe, SOLVE is the definitive source for market pricing in fixed-income markets.
