Investment Grade CDS Market Summary – March 2025
GET OUR CDS MARKET SUMMARIES STRAIGHT TO YOUR INBOX. LEARN MORE
Investment Grade CDS Market March 2025
Our newsletter presents key trends derived from observable Credit Default Swaps pricing data over a monthly period.
Top 10 Outperformers
Showcases the top 10 IG CDS “outperformers” based on the largest mid spread decreases between 3/1/25 – 3/31/25
| RANK | BOND NAME | ISSUER | % CHANGE | BPS CHANGE | SPRD | SPRD-1 MONTH | DEALERS |
|---|---|---|---|---|---|---|---|
| 1 | WBA 5Y | WALGREENS BOOTS ALLIANCE INC. | -26.2% | -136 | 382 | 517 | 3 |
| 2 | EQIX 5Y | EQUINIX INC | -22.2% | -30 | 105 | 135 | 2 |
| 3 | RBI 5Y | RAIFFEISEN INTL BK HLDG AG | -14.3% | -20 | 120 | 140 | 1 |
| 4 | APA 5Y | APACHE CORP | -11.0% | -7 | 53 | 60 | 2 |
| 5 | SUMICH 5Y | SUMITOMO CHEMICAL CO LTD | -7.6% | -3 | 33 | 35 | 3 |
| 6 | UUW 5Y | UNITED UTILS PLC | -6.5% | -3 | 37 | 40 | 4 |
| 7 | CXGD 5Y | CAIXA GERAL DE DEPOSITOS N Y | -5.9% | -5 | 80 | 85 | 1 |
| 8 | BRK 5Y | BERKSHIRE HATHAWAY FIN | -4.9% | -1 | 13 | 14 | 3 |
| 9 | ADECCO 5Y | ADECCO SA | -3.8% | -4 | 106 | 111 | 3 |
| 10 | CABKSM 5Y | CAIXABANK | -2.9% | -1 | 49 | 50 | 3 |
Top 10 Underperformers
Showcases the top 10 IG CDS “underperformers” based on the largest mid spread increases between 3/1/25 – 3/31/25
| RANK | BOND NAME | ISSUER | % CHANGE | BPS CHANGE | SPRD | SPRD-1 MONTH | DEALERS |
|---|---|---|---|---|---|---|---|
| 1 | HONDA 5Y | AMERICAN HONDA FIN CORP MEDIUM | 67.9% | 27 | 67 | 40 | 3 |
| 2 | COFB 5Y | CAPITAL ONE FINL CORP | 58.9% | 21 | 58 | 36 | 4 |
| 3 | PERNOD 5Y | PERNOD RICARD S A | 52.9% | 19 | 55 | 36 | 3 |
| 4 | EXPE 5Y | EXPEDIA INC | 49.7% | 25 | 75 | 50 | 6 |
| 5 | CCI 5Y | CROWN CASTLE INTERNATIONAL CORP | 48.3% | 21 | 66 | 44 | 2 |
| 6 | COFF 5Y | CAPITAL ONE FINL CORP | 48.2% | 31 | 94 | 63 | 4 |
| 7 | LUV 5Y | AIRTRAN HLDGS INC | 46.1% | 39 | 125 | 85 | 4 |
| 8 | PSON 5Y | PEARSON DLR FIN PLC | 44.6% | 16 | 52 | 36 | 5 |
| 9 | ORCL 5Y | ORACLE CORP | 44.4% | 16 | 53 | 36 | 5 |
| 10 | TGT 5Y | DAYTON HUDSON CORP MEDIUM TERM | 43.9% | 16.1 | 53 | 37 | 6 |
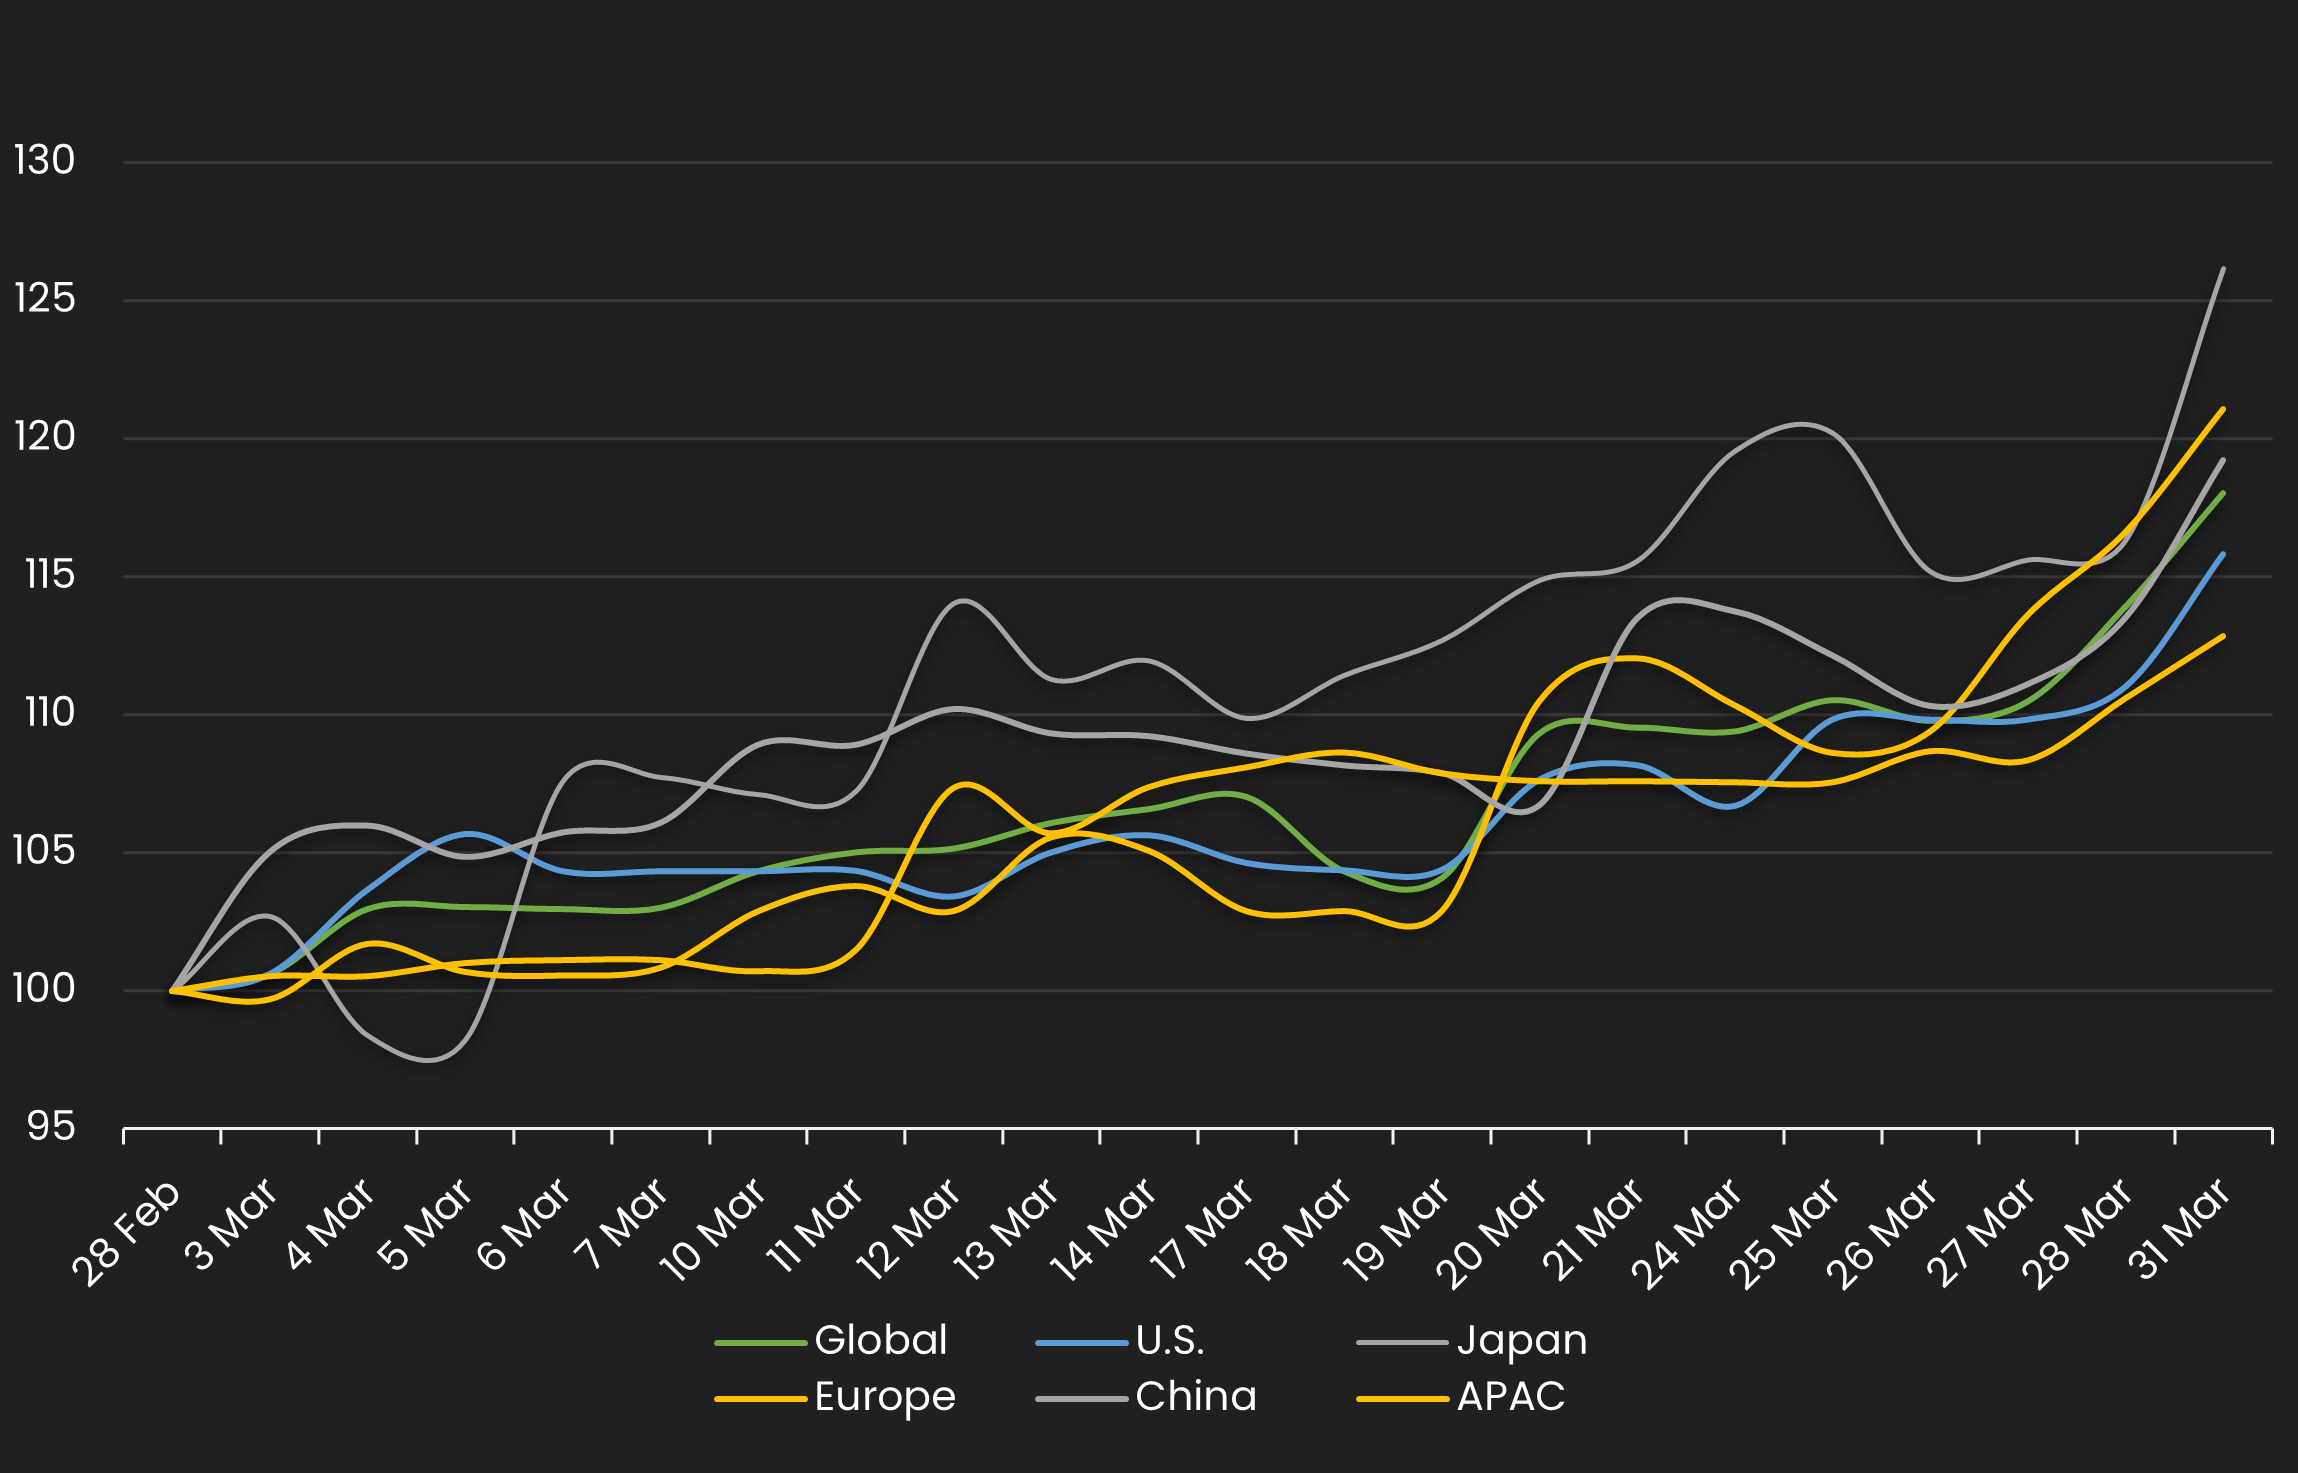
Normalized IG Spread by Region
Displays the IG CDS spread by region between 3/1/25 – 3/31/25 Results are based on 5 select regions, however, we offer data across 12 regions
IG Spread by Region – Monthly Comparison
Exhibits the IG mid spread by region for the month ending 2/28/24 vs. the month ending 3/31/25
| REGION | PREVIOUS SPREAD | CURRENT SPREAD | BPS CHANGE | MONTHLY PERFORMANCE | CDS COUNT |
|---|---|---|---|---|---|
| Global | 46 | 54 | 8 | Wider | 596 |
| U.S. | 46 | 53 | 7 | Wider | 243 |
| U.K. | 50 | 63 | 13 | Wider | 41 |
| Canada | 47 | 56 | 9 | Wider | 16 |
| China | 45 | 54 | 9 | Wider | 9 |
| APAC | 49 | 56 | 6 | Wider | 46 |
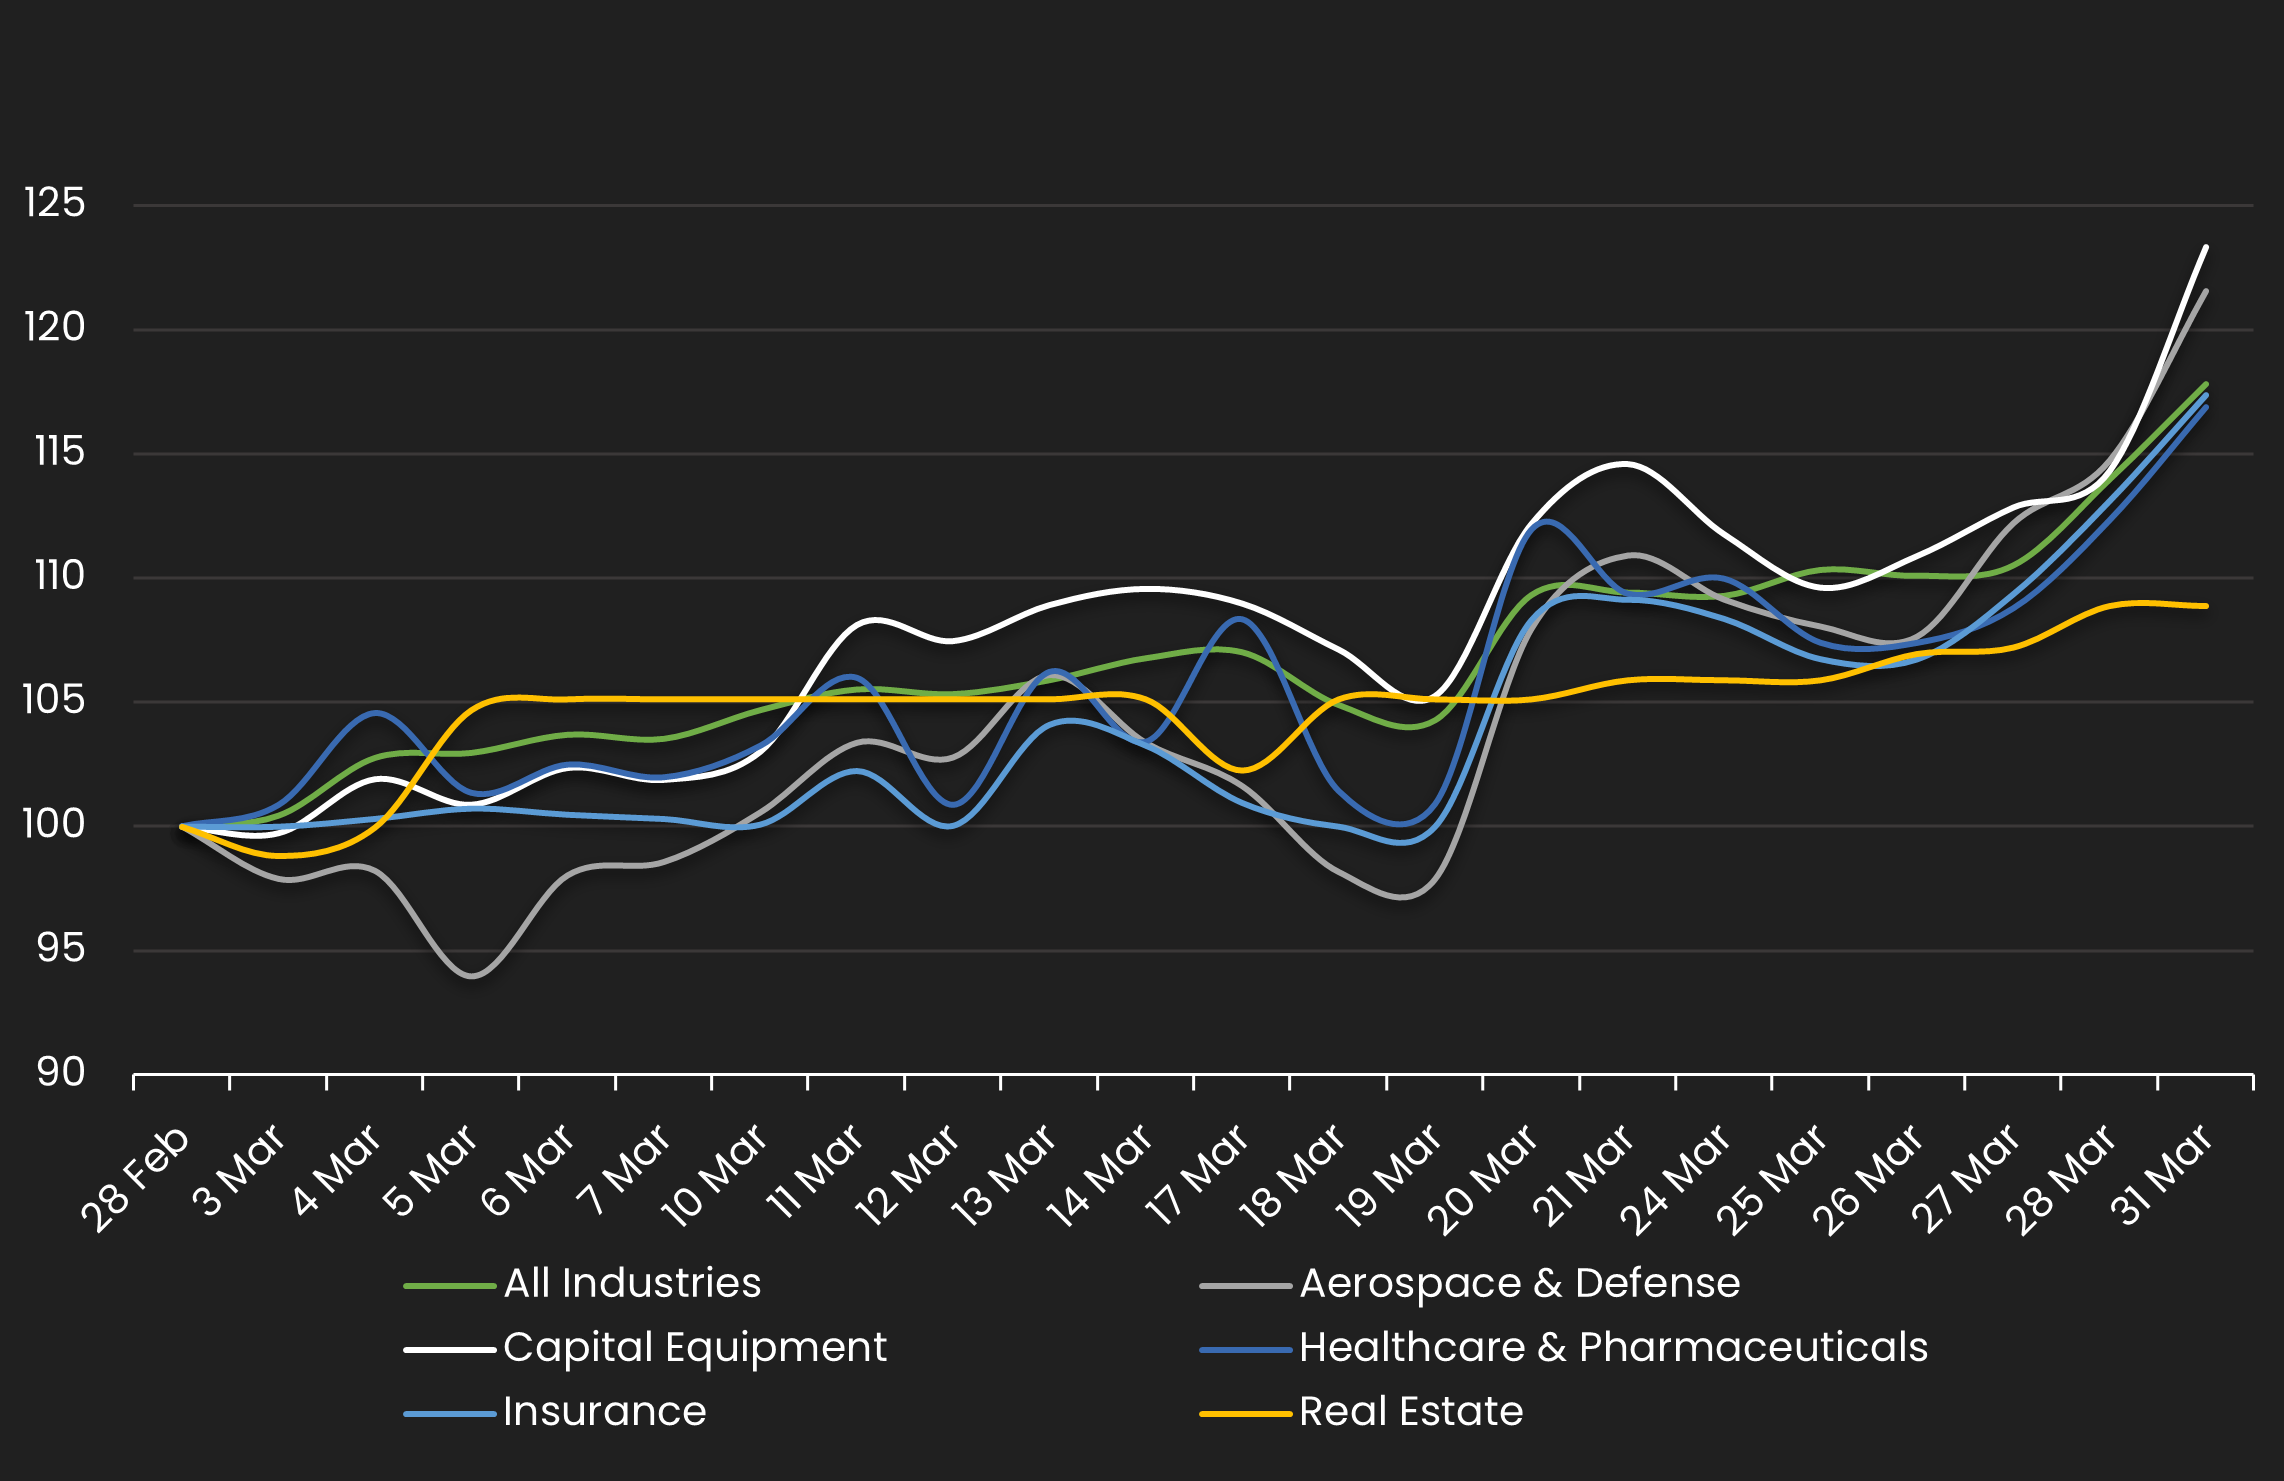
Normalized IG Spread by Industry
Displays the IG CDS spread by industry between 3/1/25 – 3/31/25 Results are based on 5 select industry sectors, however, we offer data across 36 sectors
IG Spread by Industries – Monthly Comparison
Exhibits the IG spread by industry for the month ending 2/28/24 vs. the month ending 3/31/25
| INDUSTRIES | PREVIOUS SPREAD | CURRENT SPREAD | BPS CHANGE | MONTHLY PERFORMANCE | CDS COUNT |
|---|---|---|---|---|---|
| All Industries | 46 | 0 | -46 | Tighter | 0 |
| Aerospace & Defense | 34 | 0 | -34 | Tighter | 0 |
| Capital Equipment | 55 | 0 | -55 | Tighter | 0 |
| Healthcare & Pharmaceuticals | 37 | 0 | -37 | Tighter | 0 |
| Insurance | 45 | 0 | -45 | Tighter | 0 |
| Real Estate | 72 | 0 | -72 | Tighter | 0 |
Stay up-to-date with monthly summaries.
Related Resources
About SOLVE
SOLVE is the leading market data platform provider for fixed-income securities, trusted by sophisticated buy-side and sell-side firms worldwide. Founded in 2011, SOLVE leverages its AI-driven technology and deep industry expertise to offer unparalleled transparency into markets, reduce risk, and save hundreds of hours across front-office workflows. With the largest real-time datasets for Securitized Products, Municipal Bonds, Corporate Bonds, Syndicated Bank Loans, Convertible Bonds, CDS, and Private Credit, SOLVE empowers clients to transform the way they bring new securities to market, trade on secondary markets, and value highly illiquid securities. Headquartered in Connecticut, with offices across the globe, SOLVE is the definitive source for market pricing in fixed-income markets.
