Investment Grade CDS Market Summary – June 2023
GET OUR CDS MARKET SUMMARIES STRAIGHT TO YOUR INBOX. LEARN MORE
Investment Grade CDS Market Summary:June 2023
Our newsletter presents key trends derived from observable Credit Default Swaps pricing data over a monthly period.
Top 10 Outperformers
Showcases the top 10 IG CDS “outperformers” based on the largest mid spread decreases between 6/1/23 – 6/30/23
| RANK | BOND NAME | ISSUER | % CHANGE | BPS CHANGE | SPRD | SPRD-1 MONTH | DEALERS |
|---|---|---|---|---|---|---|---|
| 1 | COFB 5Y | CAPITAL ONE FINL CORP | -28.2% | -18 | 45 | 63 | 3 |
| 2 | BRK 5Y | BERKSHIRE HATHAWAY FIN | -25.7% | -5 | 13 | 18 | 3 |
| 3 | CB 5Y | CHUBB CORP | -23.8% | -8 | 27 | 35 | 4 |
| 4 | SUMIBK 5Y | SMFG PFD CAP USD 2 LTD | -21.1% | -12 | 44 | 56 | 2 |
| 5 | ALL 5Y | ALLIED CAP COML MTG TR | -20.9% | -7 | 28 | 35 | 4 |
| 6 | SESGLX 5Y | SES SA | -20.5% | -35 | 134 | 169 | 5 |
| 7 | CMBKKO 5Y | WOORI BK KOREA | -20.2% | -10 | 39 | 49 | 3 |
| 8 | EQM 5Y | EQT MIDSTREAM PARTNERS L P | -19.9% | -46 | 184 | 230 | 3 |
| 9 | AXPRS 5Y | AMERICAN EXPRESS BK FSB MEDIUM | -19.9% | -10 | 41 | 51 | 4 |
| 10 | NAB 5Y | NATIONAL AUSTRALIA BK LTD | -19.3% | -12 | 52 | 64 | 3 |
Top 10 Underperformers
Showcases the top 10 IG CDS “underperformers” based on the largest mid spread increases between 6/1/23 – 6/30/23
| RANK | BOND NAME | ISSUER | % CHANGE | BPS CHANGE | SPRD | SPRD-1 MONTH | DEALERS |
|---|---|---|---|---|---|---|---|
| 1 | PCG 5Y | PG&E CORP | 20.1% | 47 | 280 | 233 | 3 |
| 2 | LXSGR 5Y | LANXESS FINANCE BV | 19.3% | 32 | 197 | 165 | 7 |
| 3 | UUW 5Y | UNITED UTILS PLC | 19.3% | 8 | 52 | 44 | 6 |
| 4 | WALT 5Y | TWDC ENTERPRISES 18 CORP. | 18.6% | 5 | 30 | 25 | 4 |
| 5 | CPB 5Y | CAMPBELL SOUP CO | 13.4% | 7 | 60 | 53 | 4 |
| 6 | KAWHI 5Y | KAWASAKI HEAVY INDUSTRIES LTD | 11.9% | 5 | 43 | 38 | 4 |
| 7 | JFEHLD 5Y | JFE HOLDINGS INC | 11.8% | 6 | 52 | 47 | 5 |
| 8 | MCD 5Y | MCDONALDS CORP | 11.0% | 3 | 34 | 31 | 4 |
| 9 | VIVFP 5Y | SEAGRAM CO LTD | 10.4% | 10 | 112 | 101 | 5 |
| 10 | GLW 5Y | CORNING GLASS WKS | 10.1% | 7.1 | 77 | 70 | 3 |
Normalized IG Spread by Region
Displays the IG CDS spread by region between 6/1/23 – 6/30/23 Results are based on 5 select regions, however, we offer data across 12 regions
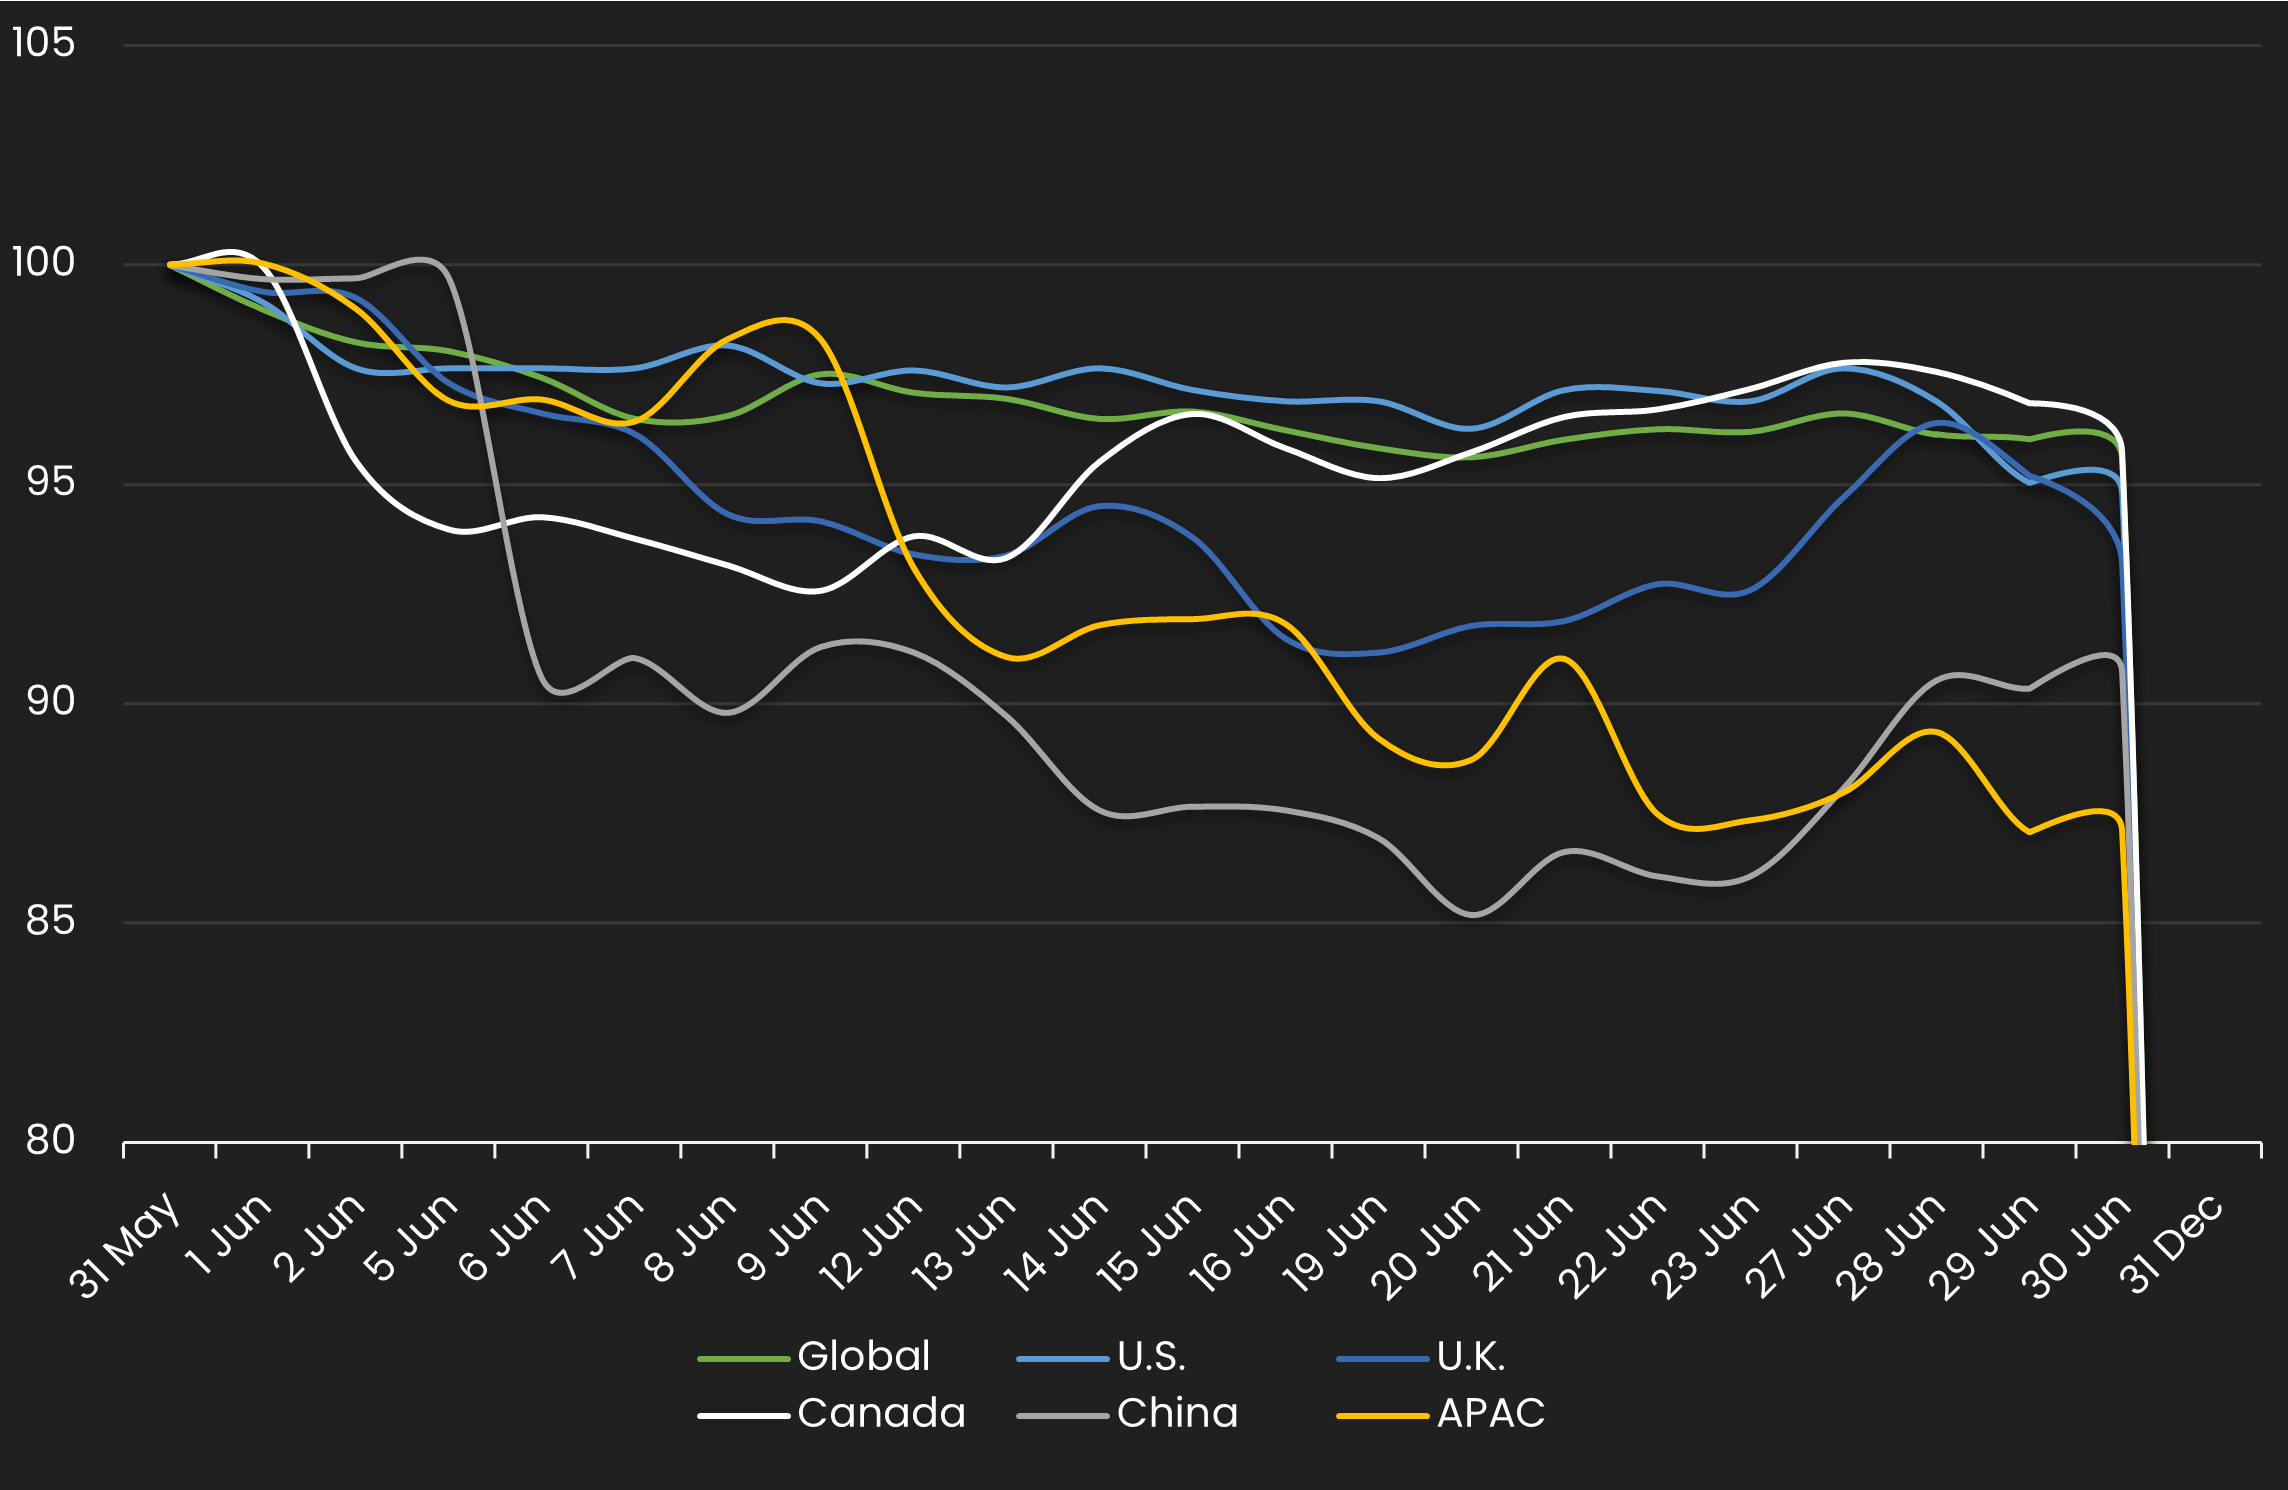
IG Spread by Region – Monthly Comparison
Exhibits the IG mid spread by region for the month ending 5/31/23 vs. the month ending 6/30/23
| REGION | PREVIOUS SPREAD | CURRENT SPREAD | BPS CHANGE | MONTHLY PERFORMANCE | CDS COUNT |
|---|---|---|---|---|---|
| Global | 68 | 65 | -3 | Tighter | 507 |
| U.S. | 67 | 63 | -3 | Tighter | 184 |
| U.K. | 86 | 81 | -6 | Tighter | 37 |
| Canada | 73 | 69 | -3 | Tighter | 6 |
| China | 84 | 76 | -8 | Tighter | 8 |
| APAC | 64 | 56 | -8 | Tighter | 42 |
Normalized IG Spread by Industry
Displays the IG CDS spread by industry between 6/1/23 – 6/30/23 Results are based on 5 select industry sectors, however, we offer data across 36 sectors
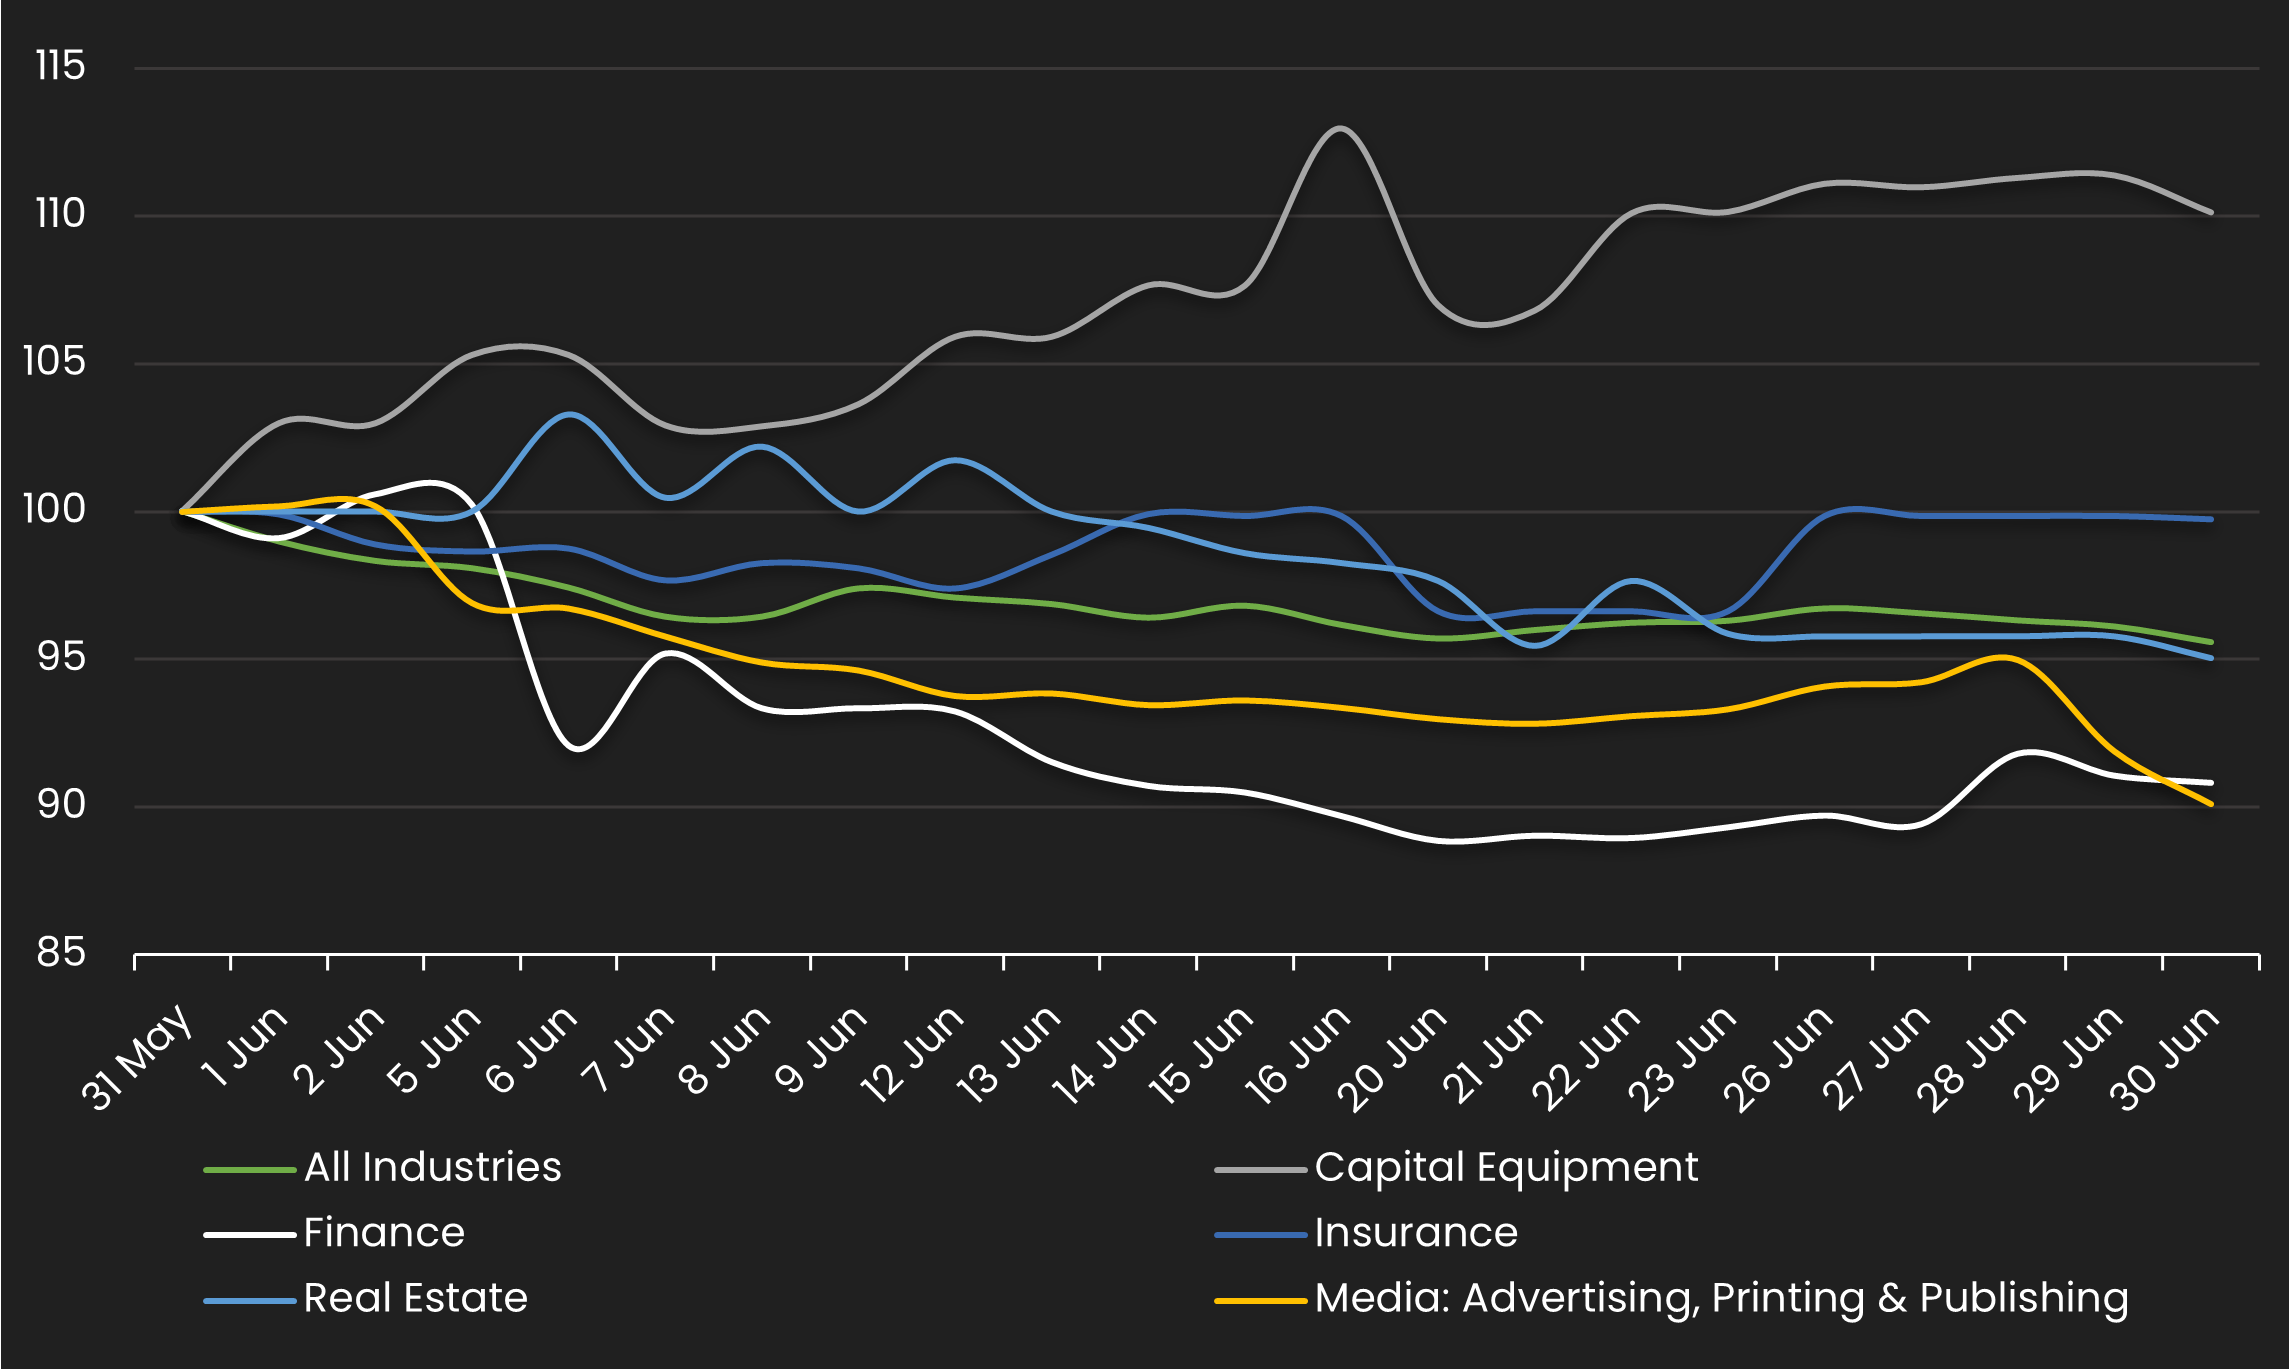
IG Spread by Industries – Monthly Comparison
Exhibits the IG spread by industry for the month ending 5/31/23 vs. the month ending 6/30/23
| INDUSTRIES | PREVIOUS SPREAD | CURRENT SPREAD | BPS CHANGE | MONTHLY PERFORMANCE | CDS COUNT |
|---|---|---|---|---|---|
| All Industries | 68 | 65 | -3 | Tighter | 508.00 |
| Capital Equipment | 70 | 77 | 7 | Wider | 11.00 |
| Finance | 81 | 73 | -7 | Tighter | 40.00 |
| Insurance | 62 | 61 | -1 | Tighter | 25.00 |
| Real Estate | 107 | 101 | -5 | Tighter | 23.00 |
| Media: Advertising, Printing & Publishing | 75 | 67 | -7 | Tighter | 3.00 |
Stay up-to-date with monthly summaries.
Related Resources
About SOLVE
SOLVE is the leading market data platform provider for fixed-income securities, trusted by sophisticated buy-side and sell-side firms worldwide. Founded in 2011, SOLVE leverages its AI-driven technology and deep industry expertise to offer unparalleled transparency into markets, reduce risk, and save hundreds of hours across front-office workflows. With the largest real-time datasets for Securitized Products, Municipal Bonds, Corporate Bonds, Syndicated Bank Loans, Convertible Bonds, CDS, and Private Credit, SOLVE empowers clients to transform the way they bring new securities to market, trade on secondary markets, and value highly illiquid securities. Headquartered in Connecticut, with offices across the globe, SOLVE is the definitive source for market pricing in fixed-income markets.
